How to Read a Candlestick Chart: Open, Close, Body and Wick Explained
Historical examples for learning · not current prices or trade recommendations.
Contents
Open any chart and the first things you see are red and green bars. Each one of those bars is a candlestick, or simply a candle. By the end of this lesson, you'll be able to look at one candle and read not only its four prices but also who won, and how far price was pushed before it came back.
All dates and times are Korea Standard Time (KST, UTC+9). A daily candle is dated by its 09:00 KST open, a weekly candle by its Monday 09:00 KST open, and intraday times are the open time of the candle on the timeframe shown.
1. One Candle = the Open, High, Low and Close of One Period
A candle compresses all the prices traded during a fixed period (1 hour, 4 hours, a day, a week) into a bar defined by four values.
- Open: the first traded price of the period
- High: the highest price during the period
- Low: the lowest price during the period
- Close: the last traded price when the period ends
Together, the four values are known by their initials: OHLC.
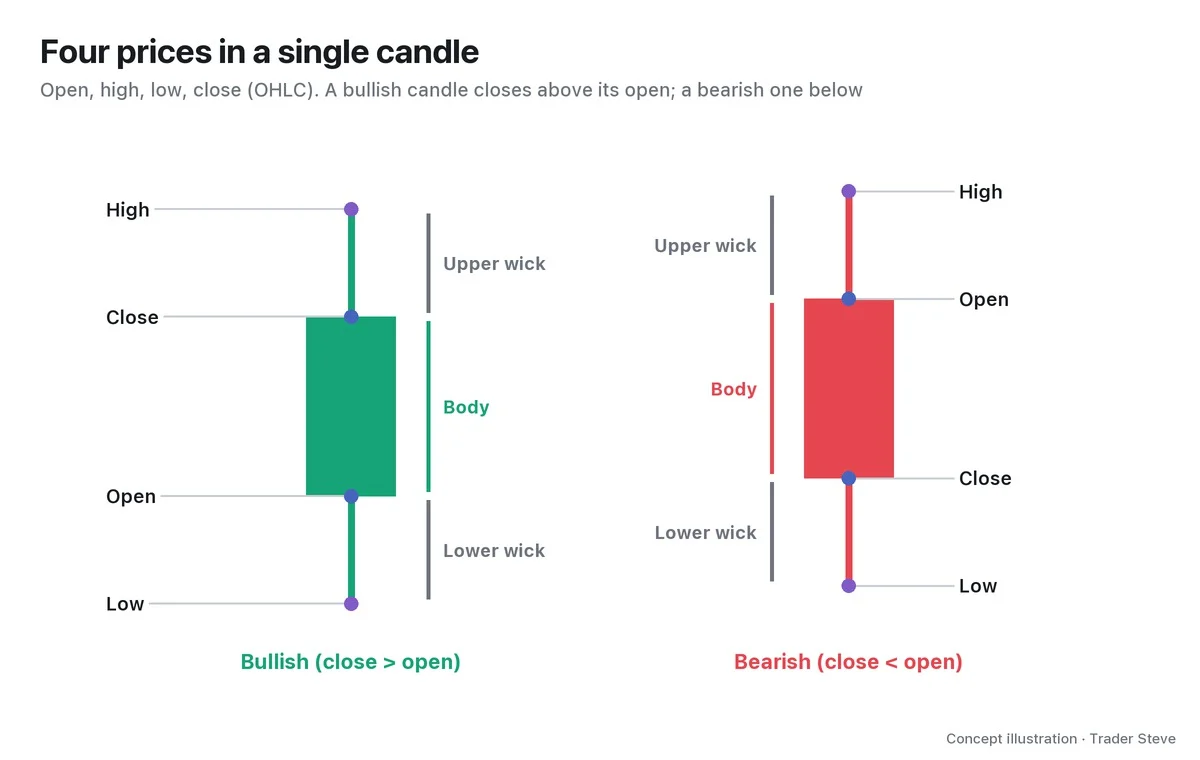
If the close is above the open, it's a bullish candle; if it's below, it's a bearish candle. The images in this lesson follow Binance: bullish candles are green and bearish candles are red. Korean brokerage apps use the opposite convention — bullish is red, bearish is blue — so it's safer to remember "is the close above or below the open?" than to rely on color.
A candle has two parts.
| Part | Range | How to read it |
|---|---|---|
| Body | open to close | the side that won by the end of the period |
| Upper wick | top of the body to the high | price went up and was pushed back down |
| Lower wick | the low to the bottom of the body | price went down and was pushed back up |
2. The Body: The Side That Won by the End of the Period
The body shows where price was standing at the close, relative to where it opened. However much it swung up and down in between, if it finished above the open, buyers won that period's tug-of-war; if it finished below, sellers did.
That's why the size of the body matters. A candle whose body fills almost its entire range (high − low) means one side pushed from start to finish. A candle with almost no body means the two sides fought up and down and price ended up back near where it started. In this series, the share of the range taken up by the body is called the body ratio, and I use it as a number when classifying patterns (Part 2).
There is one thing to remember above all. The body is set at the candle close — the moment the candle's period ends and the close is final. Until then, a candle is a picture still being drawn, and its shape can change at any time. You'll see a real example in Section 5.
3. The Wick: Where Price Went and Got Pushed Back
A wick is the range price reached during the period but couldn't hold. Break a candle down into short candles and you can see how a lower wick forms.
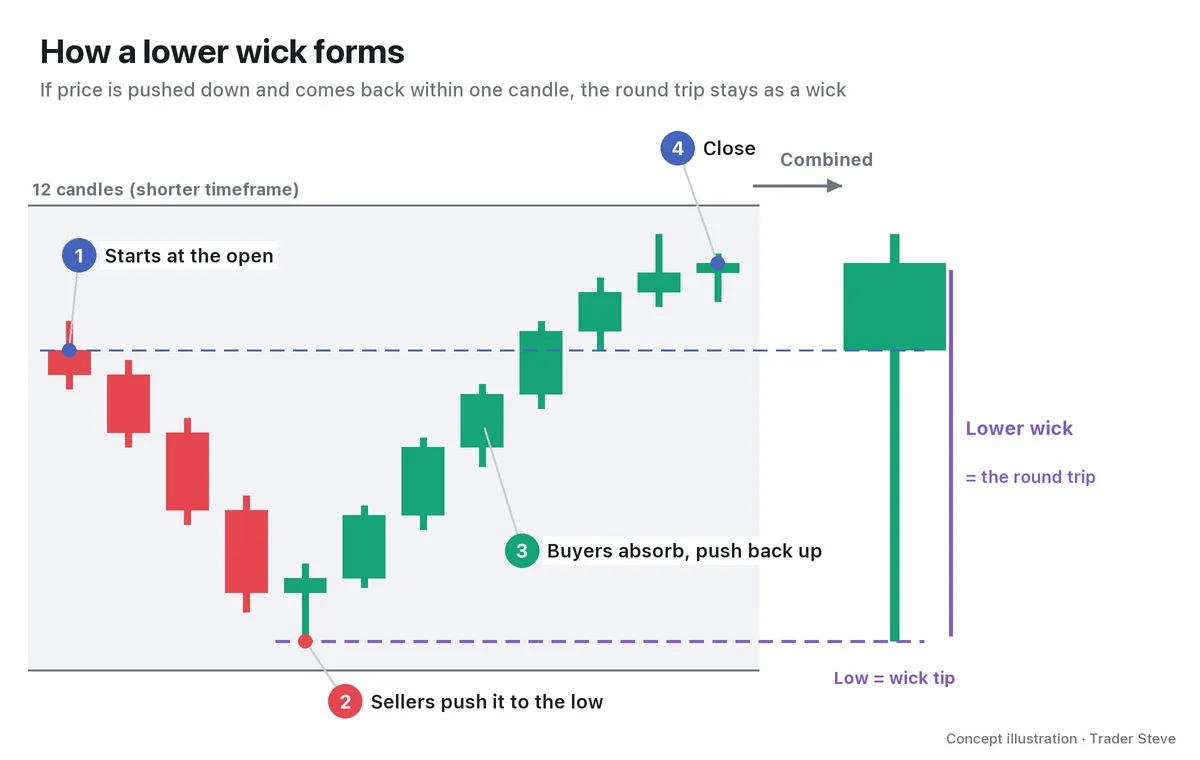
Merge the 12 candles into one and the story in between disappears; all that's left is the result: "pushed down hard, then came back above the open." The distance traveled down and back is the lower wick — in this image, 71% of the range.
I read the tip of a wick as where liquidation volume and stop-loss orders (liquidity) were sitting. In other words, it's the trace of price dropping to that level, filling the orders resting there, and coming back. On a live stream, when someone asked whether price could move without leaving a lower wick, I answered like this:
"A long lower wick is only evidence that there was that much liquidation volume stacked up below." — Trader Steve, live stream, Oct 13, 2026 (translated from Korean) · ▶ Watch the stream highlights (Korean audio)
The key words are "only evidence." A wick is a record that there was a lot of volume at that level, not a promise that price will bounce from there. Trusting wicks too much is a mistake I'll cover separately in Part 5.
Note: a candle is a record of trades. You can read a wick as "where orders were sitting" because real trades took place at those prices. Draw candles for a stock index, which isn't built from trades, and the story changes.
"When you draw it as candles, it looks like supply piled up where these wicks formed. But there's nothing there. An index doesn't have that." — Trader Steve, live stream, Oct 13, 2026 (translated from Korean) · ▶ Watch the stream highlights (Korean audio)
4. Why Large-Range Candles Form: One Side Spent Money to Push
A candle with a long body and short wicks is called a large-range candle (a large bullish candle or a large bearish candle). It forms only when one side buys or sells aggressively enough to absorb every order on the other side and drag price with it.
"The big players are buying? They make these large bullish candles that drag price up — they're spending money to push it." — Trader Steve, live stream, Oct 2, 2026 (translated from Korean)
Conversely, a close as a large bearish candle means sellers dominated that period. I once said this while explaining why I closed out a position I was holding (SOXL). Here, the Relative Strength Index (RSI) is an indicator that shows the strength of up and down moves on a 0–100 scale, and the 50 line is its midline.
"On the weekly chart, the candle closed decisively below the RSI 50 line. As a large bearish candle. (…) There are more people selling than buying." — Trader Steve, live stream, Oct 22, 2026 (translated from Korean) · ▶ Watch the stream highlights (Korean audio)
Now let's read bodies and wicks on real Bitcoin daily candles.
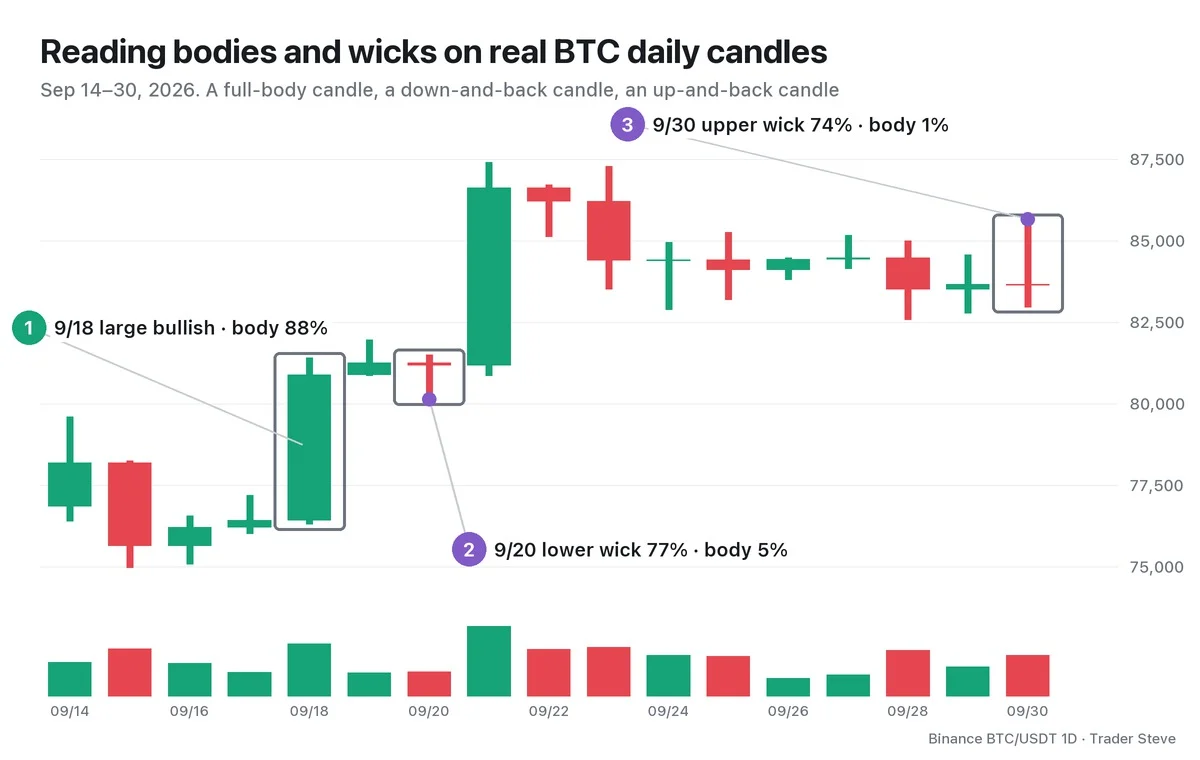
- ① Sep 18, large bullish candle: it rose 5.8% in one day, from an open of 76,417.0 to a close of 80,883.9. The body ratio is 88%, and the day's range was 2.4x the average range of the previous 20 days. Buyers pushed all day long.
- ② Sep 20: the body is only 5% of the range, but the lower wick is 77% (about $1,052). Price was pushed down hard and came back near the open.
- ③ Sep 30: body 1%, upper wick 74% (about $1,986). Price tried higher but couldn't hold there and returned to where it started.
Candles with almost no body, like ② and ③, are called doji, and depending on the direction of the wick they're split into dragonfly and gravestone types. Part 2 covers the names and the classification criteria.
5. Combine Candles to Get a Higher-Timeframe Candle: Six 4-Hour Candles = One Daily Candle
The rule for building a higher-timeframe candle out of several lower-timeframe candles is simple: the open is the first candle's open, the high is the highest high, the low is the lowest low, and the close is the last candle's close.
A Binance daily candle opens at 09:00 KST, so combining the six 4-hour candles starting at 09:00 gives you that day's single daily candle.
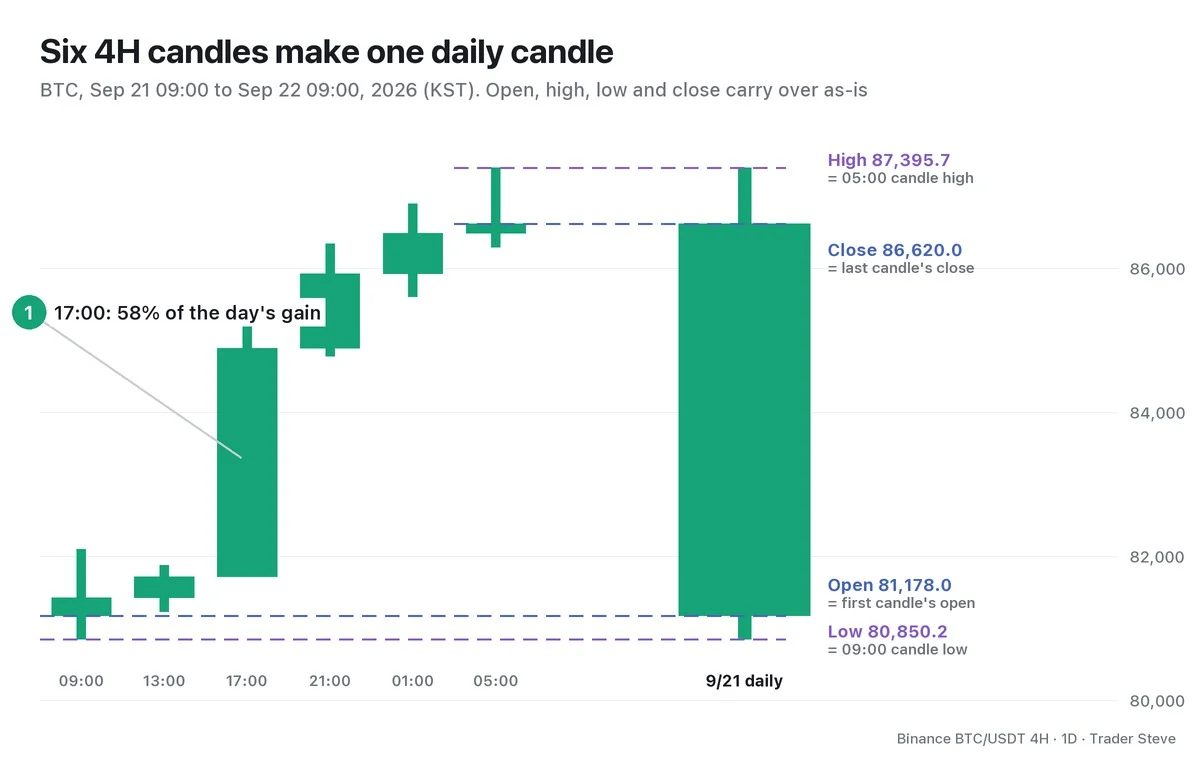
The Sep 21 daily candle had an open of 81,178.0, a high of 87,395.7, a low of 80,850.2 and a close of 86,620.0. The low came on the first candle (09:00) and the high on the last one (05:00 the next day), and one 4-hour candle — the 17:00 candle (81,720.0 → 84,887.2) — made 58% of the day's 6.7% gain. On the daily chart alone it looks like a day of steady gains, but break it apart and you can see the one stretch where the move came all at once.
The same image shows what a candle close means. At 17:00, when the first two candles had closed, the "daily candle in progress" had a high of 82,100.0 and a close of 81,720.0 — a small candle up only 0.7%. By the close, that candle had become a large bullish candle with a body ratio of 83%. That's why you shouldn't judge a higher-timeframe candle that hasn't closed.
Key Takeaways
- A candle compresses a period's open, high, low and close (OHLC) into a single bar.
- The body is the side that won by the end of the period; a wick is where price went and got pushed back.
- You can read a wick's tip as where liquidation and stop-loss volume was sitting, but it's not a promise of a bounce.
- A large-range candle is where one side pushed price while absorbing every opposing order.
- Lower-timeframe candles combine into a higher-timeframe candle, and a candle's shape can change at any time before it closes.
In Part 2, we'll cover the names of candlestick patterns such as the doji, hammer, engulfing and morning star, and the numerical criteria for identifying them. Reading candles together with volume continues in the Basics Volume topic, and stacking several timeframes in the Basics Multi-Timeframe Analysis topic.
Lining up candles across several timeframes by hand every time takes a fair amount of work. If you want analysis organized for each market, see the Omnisight Report below.
This lesson adapts the text, figures and live-stream quotes of the Trader Steve TA series for the web, translated from the original Korean. Check the text and figure captions for the timing and interpretation of each real example, and read conceptual diagrams and real charts separately.
Corrections: support@omnisight.report