What Is Fibonacci Retracement? The 0.618 Golden Ratio and How It Works
Historical examples for learning · not current prices or trade recommendations.
Contents
If you watch chart commentary, you'll keep hearing lines like "price pulled back to the 0.618 line" or "it bounced off the 0.705 line." All of that is about Fibonacci retracement. This lesson uses charts to show what Fibonacci retracement measures, where numbers like 0.618 come from, and why a number sequence with no real basis still works on real charts.
All dates and times are Korea Standard Time (KST, UTC+9). A daily candle is dated by its 09:00 KST open, a weekly candle by its Monday 09:00 KST open, and intraday times are the open time of the candle on the timeframe shown. The 59,131 low is the 04:00 1-hour candle on Jun 6 (the 01:00 4-hour candle), inside the Jun 5 daily candle.
1. The One-Line Definition: A 0-to-1 Ruler Laid Over One Swing
Fibonacci retracement is a tool that lays a 0-to-1 ruler over a single move (a swing) and reads, as a ratio, how much of that move the pullback has given back.
In an upswing, the swing low is 1 and the swing high is 0. When price comes down from the high and touches the 0.382 line, it has given back 38.2% of the rise; when it touches the 0.618 line, it has given back 61.8%.
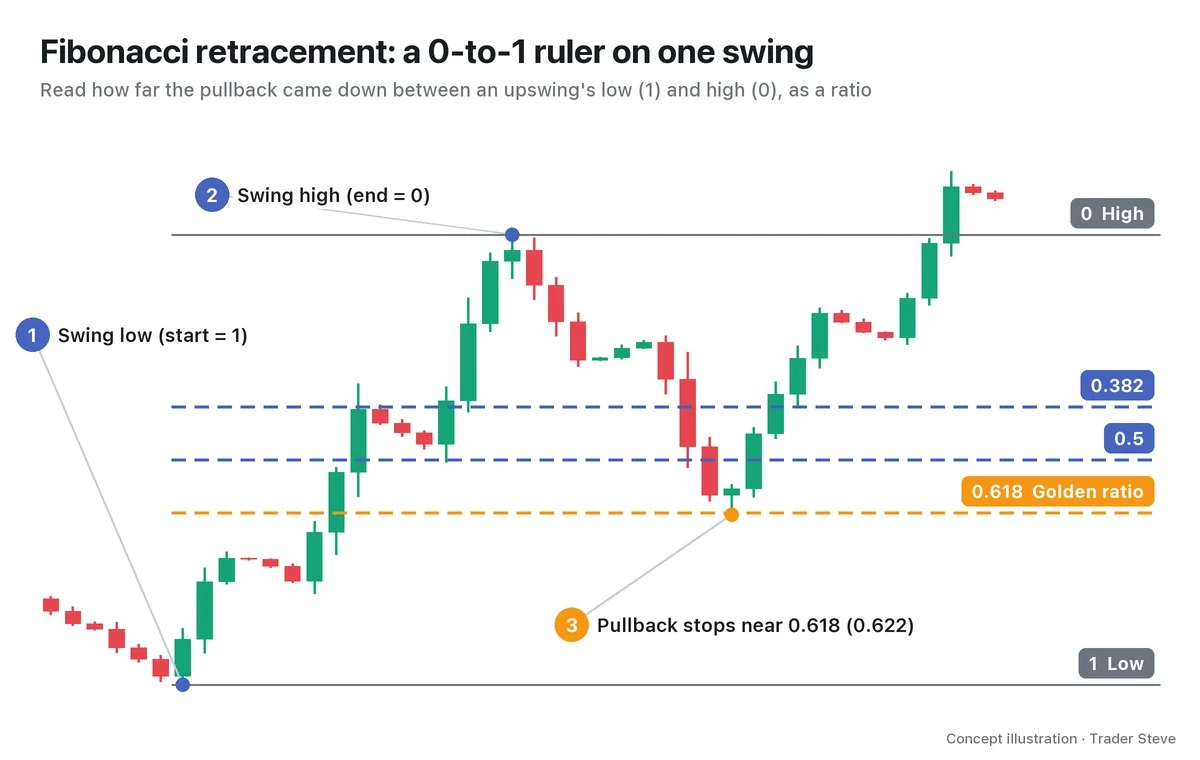
The bigger the number, the deeper the retracement: 0.382 is a shallow pullback, 0.618 a deep one. In a downswing it flips — the high is 1 and the low is 0 — and the same ratios measure how far the bounce has climbed. Part 2 covers the drawing direction and how to pick the anchor points in detail.
2. Where the Ratios Come From: Numbers From the Sequence, and Numbers Added Later
The Fibonacci sequence builds each number by adding the two before it: 1, 1, 2, 3, 5, 8, 13, 21, 34, 55, 89, 144 … The further along you go, the closer the ratio between neighboring numbers settles on a fixed value.
- 89 ÷ 144 ≈ 0.618, and 144 ÷ 89 ≈ 1.618. This value is called the golden ratio (φ).
- 55 ÷ 144 ≈ 0.382. That is also 0.618 multiplied by itself once more (0.618²).
Not every number traders put on a chart actually comes from the sequence, though. Here is the breakdown.
| Ratio | Where it comes from | Type |
|---|---|---|
| 0.382 | 55/144, 0.618² | Fibonacci |
| 0.5 | Half retracement: Dow Theory's 50% retracement, equilibrium | Not Fibonacci |
| 0.618 | 89/144, the golden ratio 1/φ | Fibonacci |
| 0.705 | Midpoint of the optimal trade entry (OTE) zone, 0.62–0.79 | Added by traders |
| 0.79 | √0.618 ≈ 0.786, rounded to 0.79 in ICT | Derived |
| 1.272 | √1.618 | Derived (extension) |
| 1.618 | 144/89, the golden ratio φ | Fibonacci (extension) |
0.5 and 0.705 have nothing to do with the sequence, but they are used alongside it because many traders actually watch for reactions there. The ratio table in Part 2 goes through what each ratio means on a chart.
3. Retracement vs. Extension: Inside 1 and Beyond 1
The same tool gives you two readings.
- Retracement: between 0 and 1. It shows how far price has been pushed back within the swing.
- Fibonacci extension: beyond 1. Once the retracement is over, it shows candidate targets for how far price could travel past the swing.
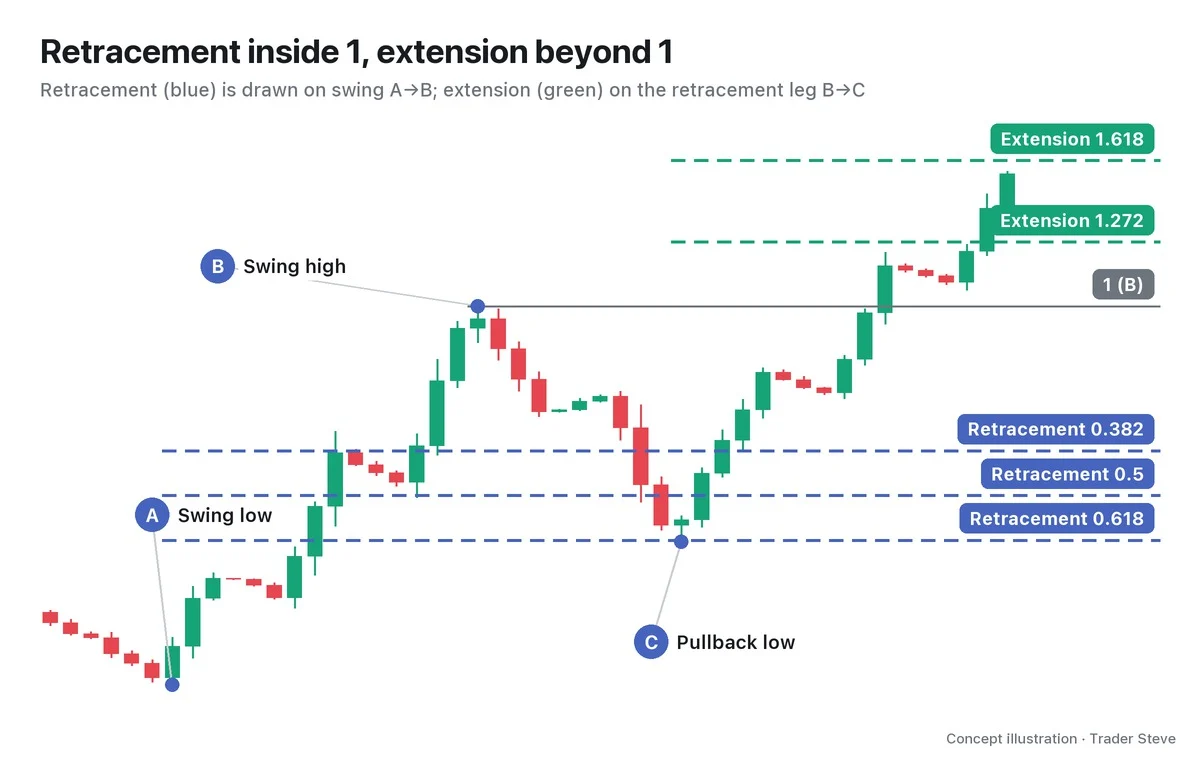
As the picture shows, the standard way to draw an extension is to put the same tool on the last retracement leg (high B → pullback low C) and read the numbers beyond 1. On the live stream, I call this a "retracement extension." Part 3 covers how to split targets using extensions.
4. Why It Works: No Hard Basis, but a Psychological Benchmark
To be honest, there is no physical reason price has to stop at a Fibonacci ratio. Here is how I put it on the live stream:
"Fibonacci analysis honestly has no real basis. It's just built on a number sequence, right? But it's a psychological benchmark. That's why it works. … People can hold on when they're down about half. It feels like it'll still go up. But if around 70% of what they were holding gets wiped out, they can't take it." — Trader Steve, live stream, Sep 13, 2026 (translated from Korean) · ▶ Watch this moment (Short, Korean audio)
It's easy to see from the side of someone who bought the low. Near 0.5, where about half the profit is gone, they hold on, thinking "it'll go back up." But once price is pushed to around 0.705 and 70% of the profit has vanished, they dump their size to protect whatever is left.
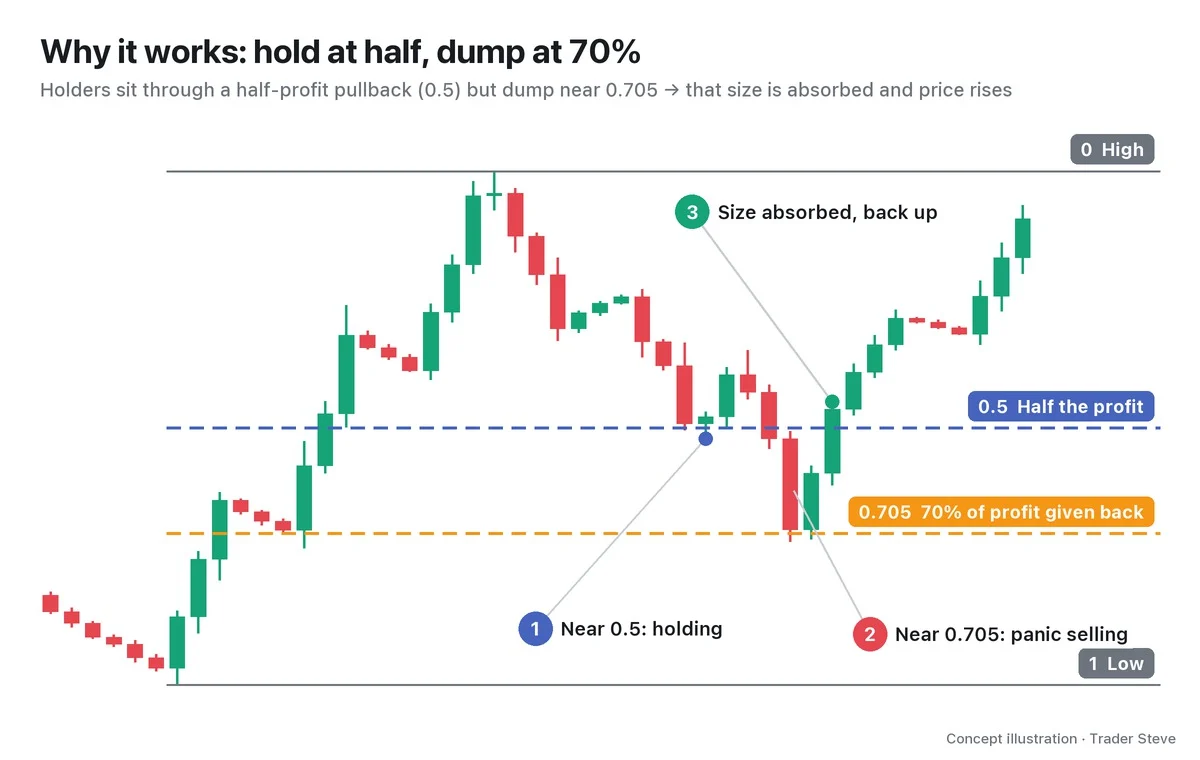
"Once it drops to around the 0.705 line, pretty much everyone gives up. You thought it was your profit, and when it gets pushed back this far, you go, 'I've got to save at least this little bit that's left,' and you dump your size and get out." — Trader Steve, live stream, Sep 13, 2026 (translated from Korean) · ▶ Watch this moment (Short, Korean audio)
There are three reasons it works.
- Psychology: how much profit people hand back before they give up lines up with the ratios.
- Self-fulfilling prophecy: when many people watch the same line and place orders there, orders really do pile up at that line.
- Dow Theory: underneath it all is the idea that a trend is a repeating swing — up, pull back, up again. Fibonacci is simply a ruler for measuring how deep that pullback goes.
"ICT is all built on Dow Theory, parallel channels are of course built on Dow Theory too, and Fibonacci retracement also runs on Dow Theory." — Trader Steve, live stream, Aug 27, 2026 (translated from Korean) · ▶ Watch the stream highlights (Korean audio)
5. Real BTC: A Pullback That Stopped at 0.618 — and What Came Next
Let's look at a real Bitcoin (BTC) daily chart.
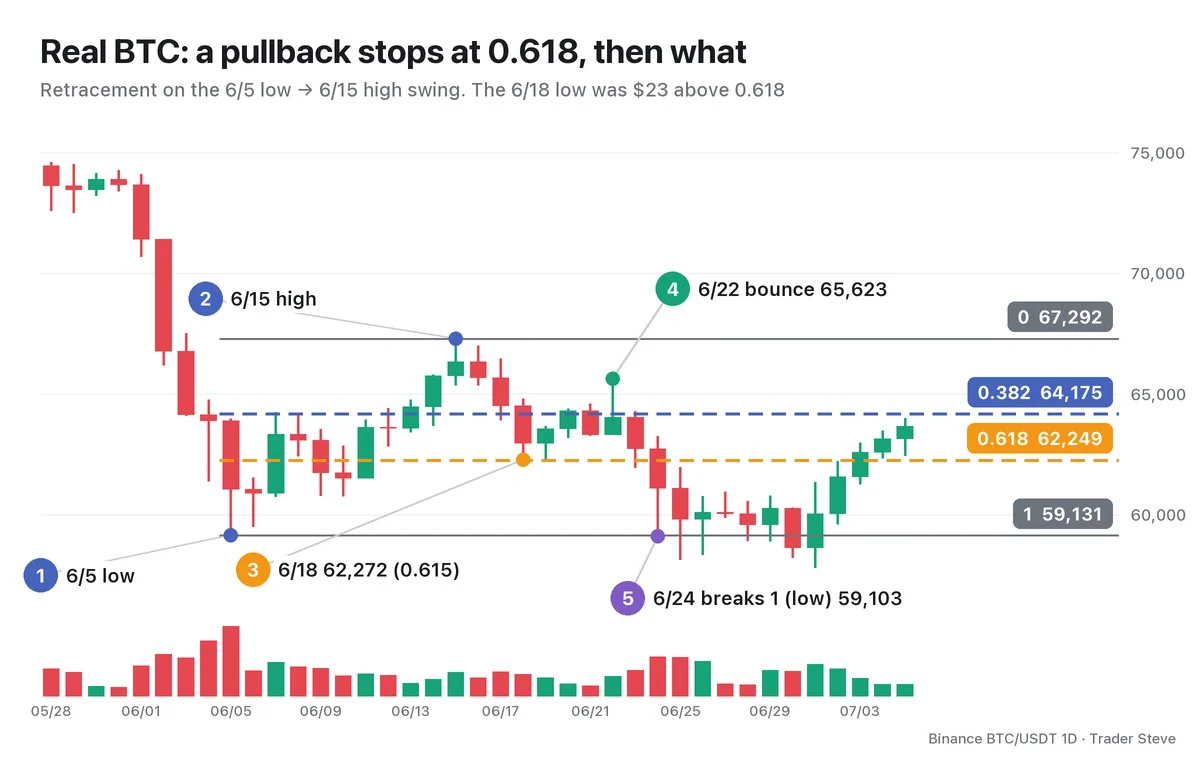
- Draw a retracement on the swing that ran from ① the Jun 5 low of 59,131 to ② the Jun 15 high of 67,292, and 0.382 is 64,175 and 0.618 is 62,249.
- ③ The Jun 18 low was 62,272, stopping $23 above 0.618 — a ratio of 0.615.
- ④ From there, price bounced to 65,623 on Jun 22. Up to this point, it's a textbook 0.618 bounce.
- ⑤ But the bounce failed to clear the 67,292 high, and the Jun 24 low of 59,103 broke 1 (the swing low). On Jul 1, price fell as far as 57,800.
This case shows the right attitude toward Fibonacci. 0.618 is a place where a reaction may come, not a place where price is bound to bounce. Even when a reaction comes, there is no guarantee the trend continues, and once 1 breaks, the Fibonacci drawn on that swing no longer means anything. That's why you don't enter on Fibonacci alone: decide where your stop-loss goes first (Part 3), and check whether other evidence lines up (Part 5).
To learn how to pick the swing highs and lows used as anchors, see Basics Swings and Trend (related lesson); for entering in the 0.62–0.79 zone, continue with OTE (see ICT Optimal Trade Entry, ict/ote).
Key Takeaways
- Fibonacci retracement sets the start of a swing at 1 and its end at 0, and is a ruler that measures the depth of a pullback as a ratio.
- 0.382, 0.618 and 1.618 come from the sequence; 0.5 is Dow Theory's half retracement; 0.705 and 0.79 are values traders added.
- Inside 1 is retracement; beyond 1 (1.272, 1.618) is extension.
- It works not because of the math but because of psychology and the fact that many people watch the same lines.
- A level is only a place to watch for a reaction, not a confirmed bounce signal.
In Part 2, we'll cover how to actually draw Fibonacci, whether to anchor on wicks or bodies, and a table of what each ratio means.
Drawing and checking all of this by hand for every market takes a fair amount of time. If you want analysis that pulls many lines of evidence together in one place, take a look at the report below.
This lesson adapts the text, figures and live-stream quotes of the Trader Steve TA series for the web, translated from the original Korean. Check the text and figure captions for the timing and interpretation of each real example, and read conceptual diagrams and real charts separately.
Corrections: support@omnisight.report