What Is Multi-Timeframe Analysis? Top-Down Analysis and Why It Works
Historical examples for learning · not current prices or trade recommendations.
Contents
Sometimes the same Bitcoin (BTC) chart looks ready to collapse on the 1-hour, while the daily looks like nothing is happening at all. Both are showing the same move at a different scale. This lesson uses charts to explain what a timeframe is, why candles of different sizes tell different stories at the same moment, and why you need to start with the larger candles and work down (top-down analysis).
All dates and times are Korea Standard Time (KST, UTC+9). A daily candle is dated by its 09:00 KST open, a weekly candle by its Monday 09:00 KST open, and intraday times are the open time of the candle on the timeframe shown. The 80,394 low is the 02:00 1-hour candle on Oct 9 (the 01:00 4-hour candle), inside the Oct 8 daily candle; the 59,131 low is the 04:00 1-hour candle on Jun 6 (the 01:00 4-hour candle), inside the Jun 5 daily candle; the 74,968 low is the 03:00 1-hour candle on Sep 16 (the 01:00 4-hour candle), inside the Sep 15 daily candle.
1. What a Timeframe Is: The Time One Candle Holds
A timeframe (TF) is the amount of time a single candle covers. A 1-minute candle compresses the open, high, low and close of 1 minute into one candle; a 4-hour candle does the same for 4 hours, a daily candle for one day and a weekly candle for one week.
A larger candle is several smaller candles combined. One daily candle = six 4-hour candles = 24 1-hour candles.
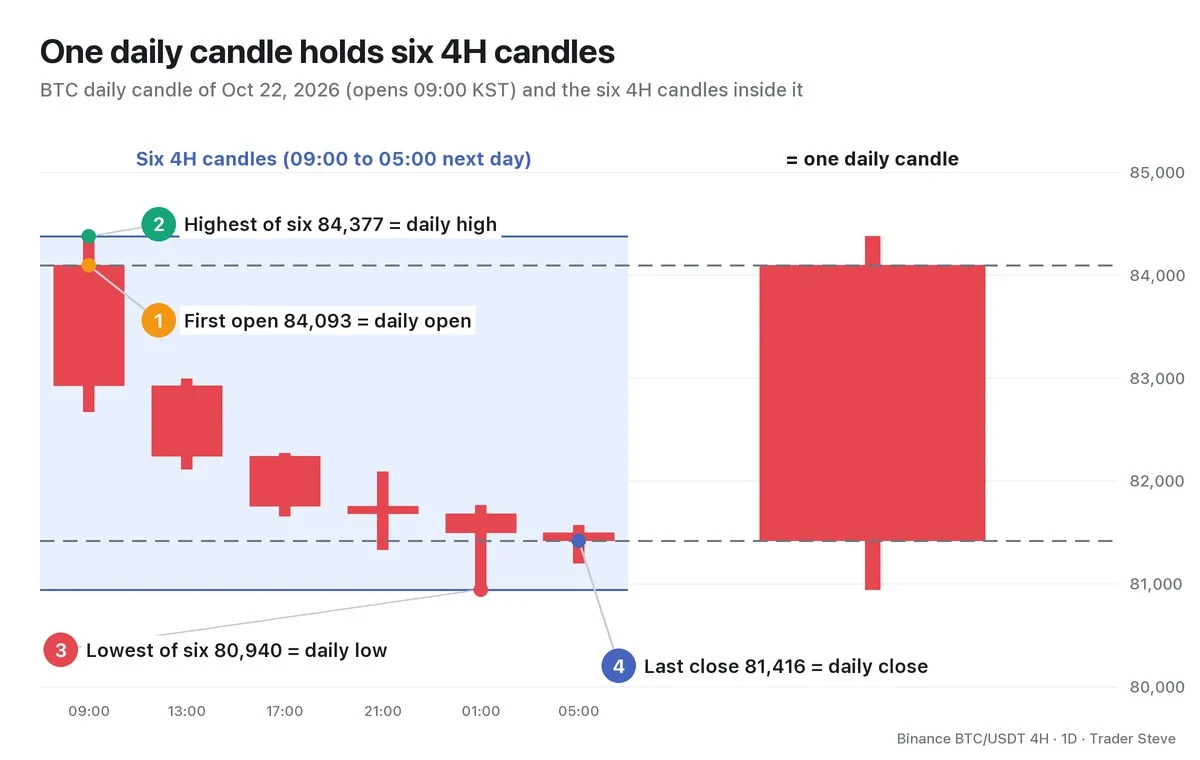
On Oct 22, 2026, the Bitcoin daily candle opened at 84,093, hit a high of 84,377 and a low of 80,940, and closed at 81,416: a bearish candle down about 3.2% on the day. Spread that day out into six 4-hour candles and you can see that the high came in the first 4-hour candle (the 09:00 candle) and the low came in the 01:00 candle the next day. The daily candle only tells you "it sold off all day"; the 4-hour chart shows when it sold off and where it stopped.
It also helps to know when each candle opens. On Binance, the daily candle opens at 09:00 KST (00:00 UTC), 4-hour candles open at 01:00, 05:00, 09:00, 13:00, 17:00 and 21:00, and the weekly candle opens on Monday at 09:00.
2. Same Moment, Different Stories
Change the candle size and the chart at the very same moment says something completely different. On a live stream, flipping between the 1-minute, 5-minute and 15-minute charts, I once put it like this:
"Just switch to the 5-minute and it feels like it's going to drop, right? Switch to the 15-minute and it looks like it'll keep going… Depending on which minute chart I'm looking at, my view keeps flipping back and forth, like turning over my hand." — Trader Steve, live stream, Aug 26, 2026 (translated from Korean) · ▶ Watch this moment (Short, Korean audio)
That is why you need multi-timeframe analysis (MTF): looking at the same market on 2–3 timeframes and giving each one a role. Instead of listening to whichever candle happens to agree with you, you decide in advance — "this timeframe for direction, that one for the entry."
Two terms first:
- Higher timeframe (HTF): a larger candle than the one you're looking at
- Lower timeframe (LTF): a smaller candle than the one you're looking at
Both are relative. For a 15-minute trader the 4-hour chart is a higher timeframe, but for a weekly trader it's a lower one.
3. Why They Look Different: Fractals
Each timeframe tells a different story because charts are fractal: the same shapes repeat at different sizes.
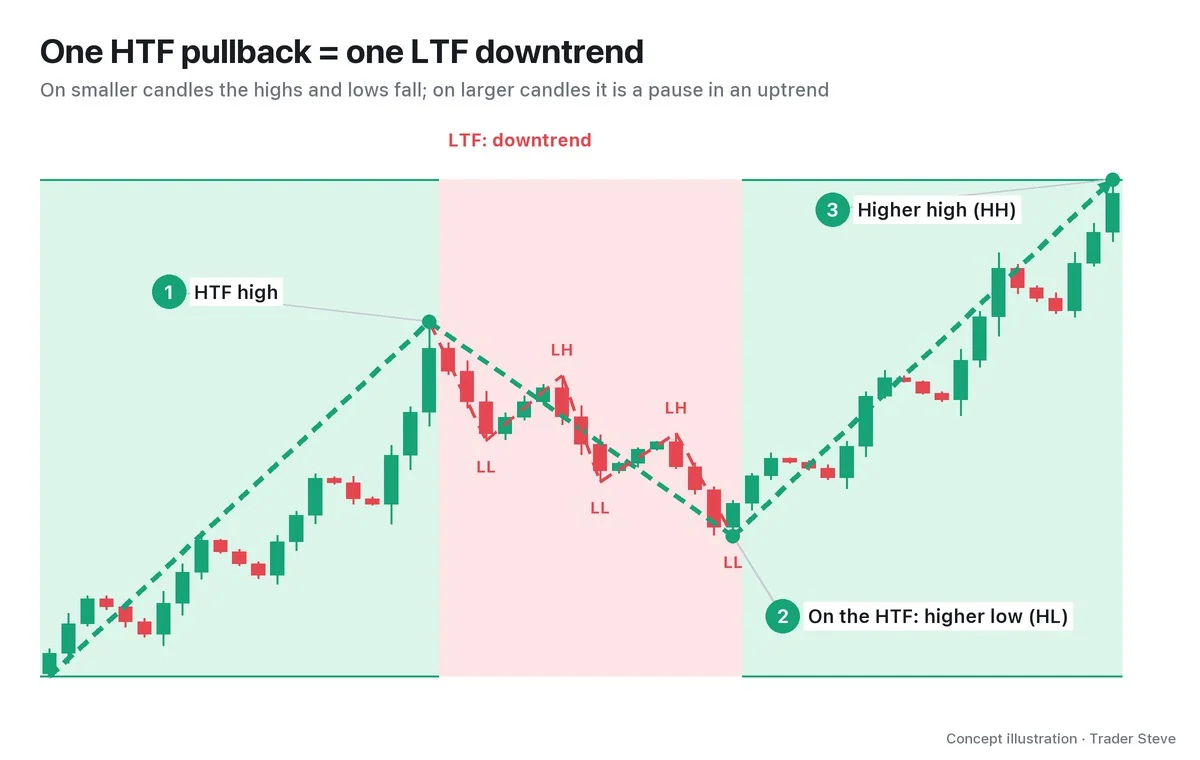
Look at the red stretch after high ① on the smaller candles and you see a textbook downtrend: a lower high (LH) and a lower low (LL). On the larger candles, though, that whole stretch compresses into a single ② higher low (HL), followed by a ③ higher high (HH). On the larger candles, the uptrend was never broken.
In short, one pullback on the higher timeframe = one downtrend on the lower timeframe. So a downtrend on a lower timeframe does not, by itself, mean the bigger trend has changed.
"Swing highs and swing lows are different depending on the timeframe. The further down you go into the short-term candles, the more the high and low lines all differ. You have to pick out every single one of them and look." — Trader Steve, live stream, Oct 12, 2026 (translated from Korean) · ▶ Watch the stream highlights (Korean audio)
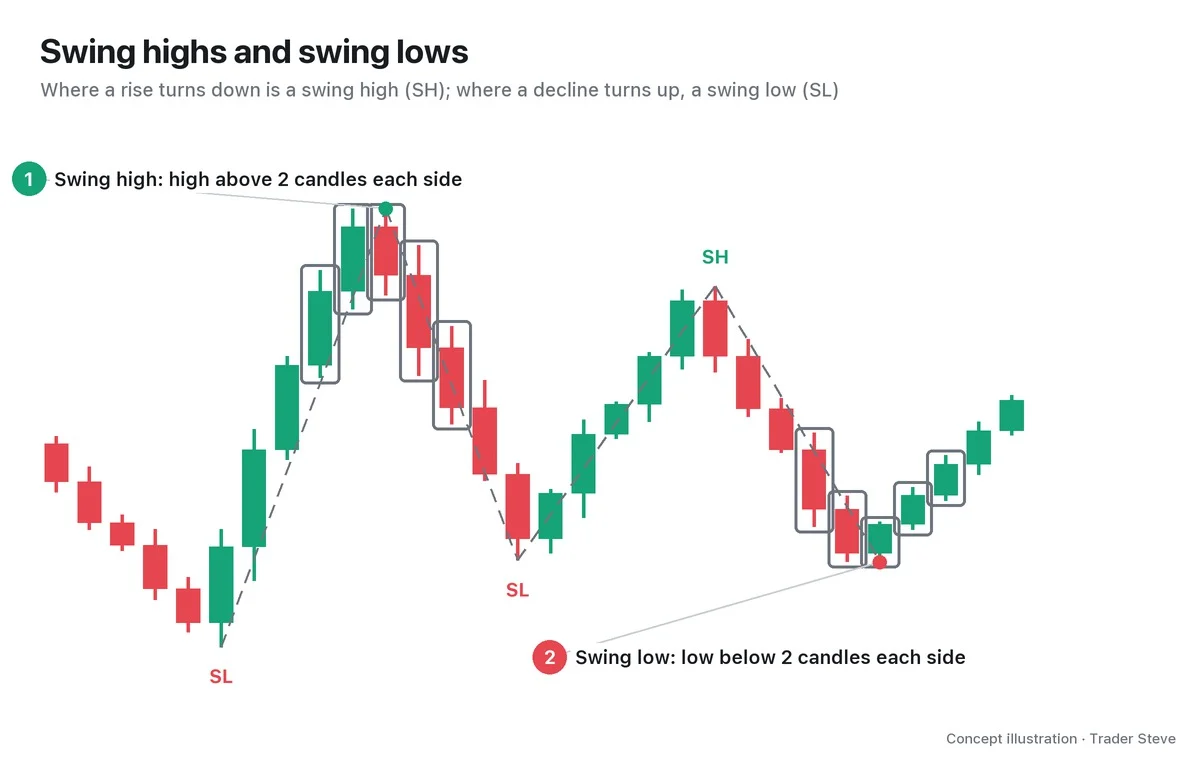
That's why whenever you talk about a high or a low, you should always note which timeframe it's on. The rules for defining highs and lows themselves are covered in detail in the Basics Swings and Trend topic (related lesson).
4. Real BTC in Mid-October: The Weekly vs. the 4-Hour
Let's look at the same period on a real Bitcoin chart on two timeframes. First, the weekly.
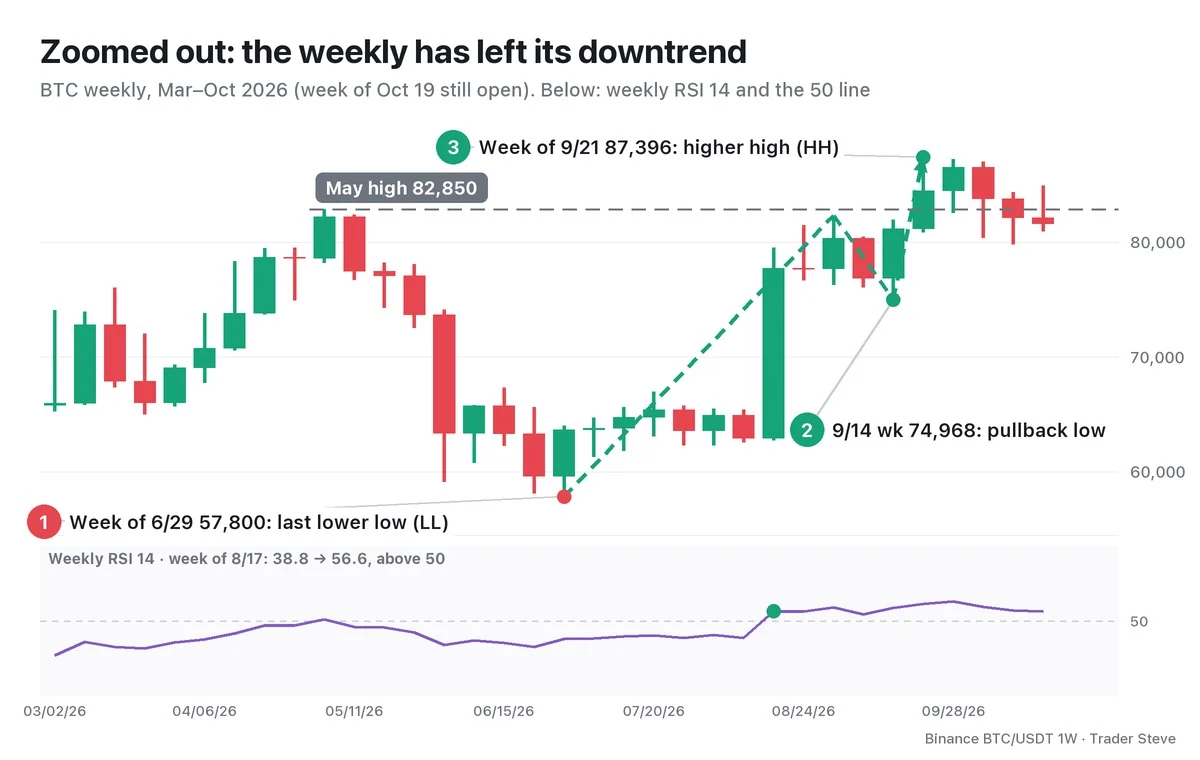
On the weekly, the week of Jun 29 made one more lower low at 57,800 (①, below the 59,131 low in the week of Jun 1). Then the week of Sep 21 printed a high of 87,396, clearing the last LH at 82,850 for the first HH (③). The downtrend structure has ended, but the HL after that HH is still being confirmed. The 74,968 low in the week of Sep 14 (②) is a pullback low, not a confirmed swing at this structure size (four weeks on each side). The weekly Relative Strength Index (RSI) 14 also crossed above 50 in the week of Aug 17, rising from 38.8 to 56.6, and has stayed above 50 through the week of Oct 19 (still open) at 56.5. What the RSI 50 line means is covered in the Basics Oscillators topic (related lesson).
The 4-hour chart over the same period looks different.
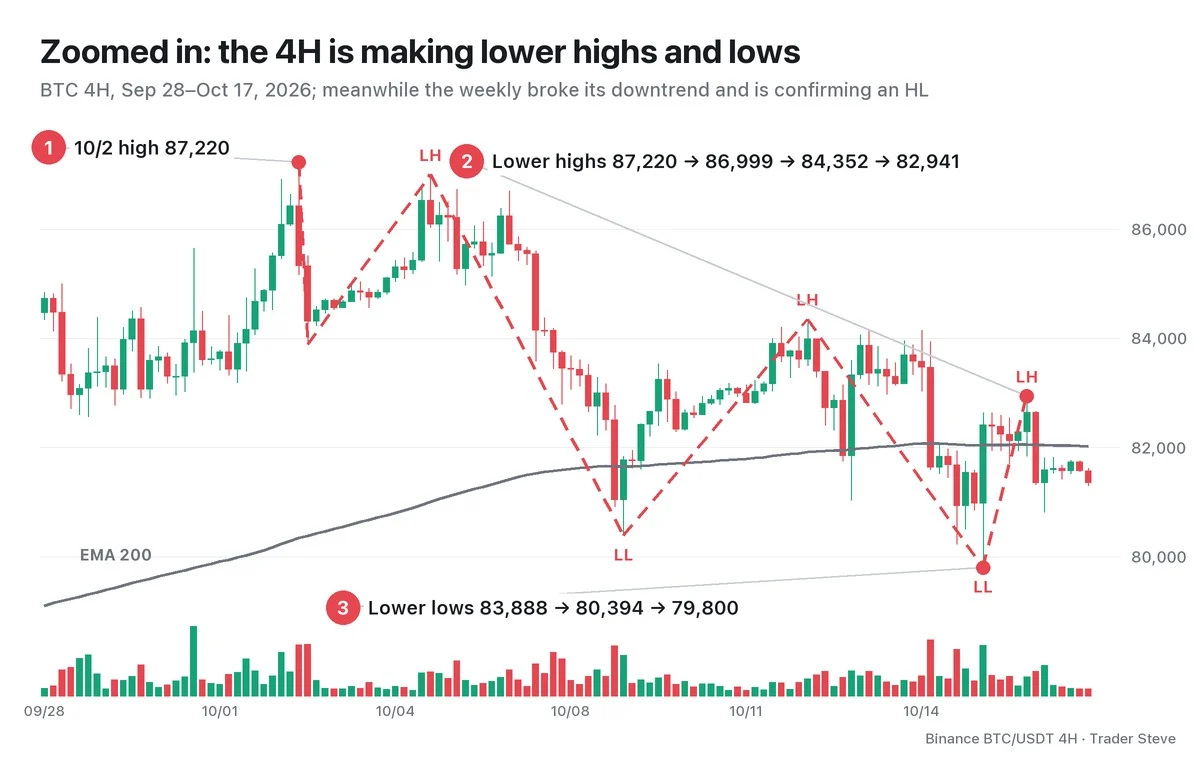
On the 4-hour chart, after the Oct 2 high of 87,220, the highs fell 86,999 → 84,352 → 82,941, and the lows between them fell 83,888 → 80,394 → 79,800. From the Oct 2 high to the Oct 15 low, that is a drop of about 8.5%. The 4-hour 200-period exponential moving average (EMA 200) flattened out near 82,050 around Oct 16, and between Oct 2 and Oct 17 the close crossed back and forth over it 7 times. On the 4-hour chart alone, this is a clear downtrend.
Right in this period, on the Oct 16 live stream, I said this:
"A structure that keeps raising its highs and lows instead of lowering them is a bullish structure. It's only a matter of timeframe perspective — look short-term and it looks like a bear market. But zoom out and it's a bull market. On the weekly, a structure is forming that finally raises both the lows and the highs for the first time … We can't say yet that a bullish structure has formed. All that's been confirmed is that it broke out of the bearish structure to the upside." — Trader Steve, live stream, Oct 16, 2026 (translated from Korean) · ▶ Watch the stream highlights (Korean audio)
Put the two charts together and the entire 4-hour downtrend sits inside the weekly pullback after the high in the week of Sep 21. The 4-hour low of 79,800 is above the last weekly LL of 57,800, but that alone does not confirm a new HL. And this only describes how the two timeframes' structures differed in this period; it does not decide what happens next. The higher-timeframe structure can change too.
5. Hence Top-Down: Direction on the Larger Candles, Timing on the Smaller Ones
So which timeframe should you listen to first? The basic answer is to work from the larger candles down to the smaller ones, which is called top-down analysis.
- Higher timeframe: Is price making higher highs and lows, or lower ones? The big direction and the key price levels
- Intermediate timeframe: Within that direction, which zone is price in right now?
- Lower timeframe: Where to get in, and where to get out if you're wrong (the stop-loss)
The reverse — starting from a signal on the smaller candles and checking it against the larger ones — is called bottom-up analysis. The trouble is that the smaller the candles, the more signals and the more noise, so it is easy to lose your bearings. If you set the direction on the larger candles first, then when you see a downtrend on the smaller candles you can stop and think, "this might just be a pullback on the higher timeframe."
In a phrase that comes up often on the live stream, the higher timeframe is strategy and the lower timeframe is tactics. How to use this split to actually plan entries, stops and targets is covered in detail in Part 3.
Key Takeaways
- A timeframe is the time one candle covers, and one larger candle is several smaller candles combined (one daily candle = six 4-hour candles).
- At the same moment, different candle sizes can show different trends.
- Charts are fractal, so one pullback on the higher timeframe can be one downtrend on the lower timeframe.
- In mid-October 2026, while the BTC weekly had left its downtrend structure and was confirming an HL, the 4-hour chart was making both lower highs and lower lows.
- That's why you split the roles in top-down order: direction on the larger candles, timing on the smaller ones.
In Part 2, we'll cover how to choose 2–3 timeframes that fit your trading style, along with a top-down checklist.
If flipping through several timeframes by hand for every market gets tedious, take a look at the Omnisight Report, which pulls analysis across multiple timeframes into one place.
This lesson adapts the text, figures and live-stream quotes of the Trader Steve TA series for the web, translated from the original Korean. Check the text and figure captions for the timing and interpretation of each real example, and read conceptual diagrams and real charts separately.
Corrections: support@omnisight.report