What Are RSI, MACD and the Stochastic Oscillator? How They Work
Historical examples for learning · not current prices or trade recommendations.
Contents
The Relative Strength Index (RSI), Moving Average Convergence Divergence (MACD) and the stochastic oscillator sit in the panel under almost every chart. The names are familiar, but many traders know little more than "above 70 means overheated." This lesson uses charts to show what each of the three indicators actually measures, and why, when I read RSI, I look at the 50 line before 70 and 30.
All dates and times are Korea Standard Time (KST, UTC+9). A daily candle is dated by its 09:00 KST open, a weekly candle by its Monday 09:00 KST open, and intraday times are the open time of the candle on the timeframe shown.
1. What an Oscillator Is: An Indicator That Measures Strength and Speed, Not Price
An oscillator is an indicator whose value, calculated from price, swings within a fixed range or back and forth around a reference line. Because it shows how strong and how fast a move is, it is also called a momentum indicator.
If a candlestick chart shows "what price is right now," an oscillator puts a number on "how hard that price is moving."
They come in two basic shapes.
- Bounded: moves between 0 and 100. RSI, stochastic
- Centered on 0: moves above and below 0, with no fixed upper or lower limit. MACD
One point to keep in mind: all three indicators are calculated from price. They are not magic lines that tell you something before price does; they summarize a move that has already happened, from a different angle.
2. RSI: Buying Strength vs. Selling Strength, Centered on 50
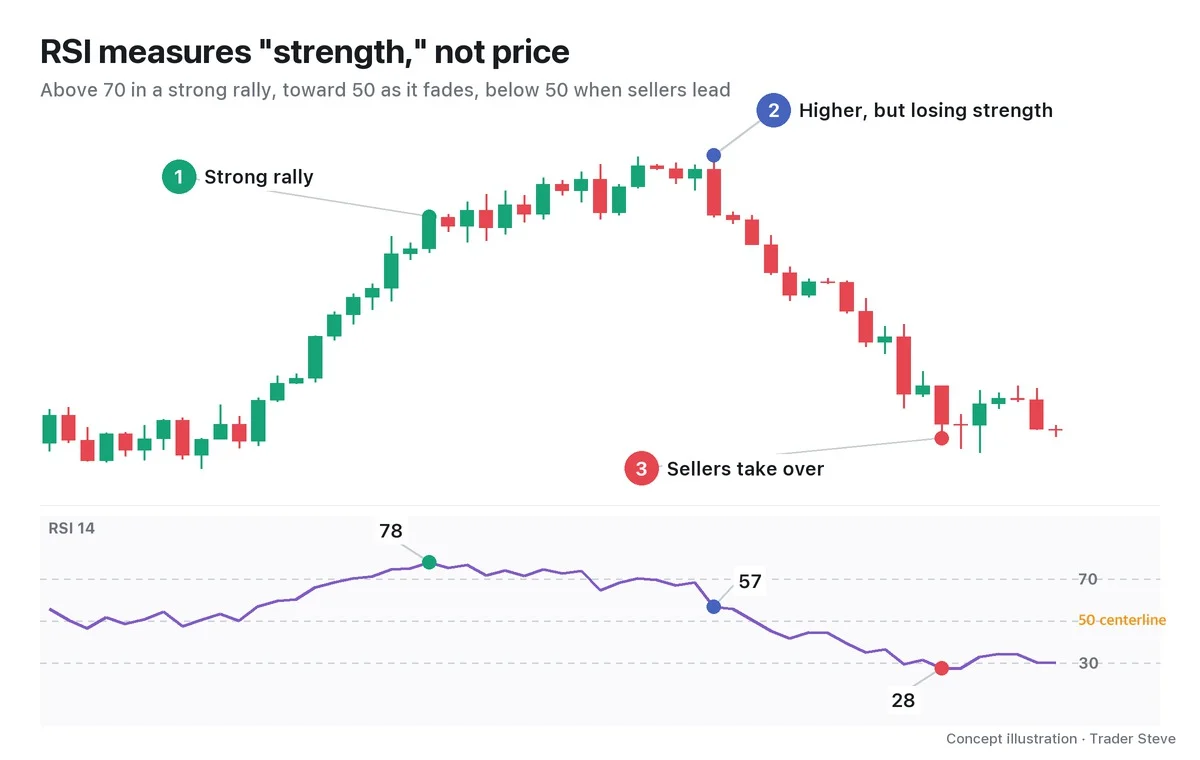
The Relative Strength Index (RSI) was created by J. Welles Wilder in 1978. The default setting is 14 candles: it compares the average size of the up moves with the average size of the down moves over the last 14 candles and expresses the result on a 0–100 scale. When the up moves and down moves are the same size, RSI is exactly 50 (Part 2 covers the calculation).
On the live stream, this is how I explain RSI.
"Put simply, RSI is an indicator that compares whether there are more guys buying or more guys selling. That's why its centerline is the 50 line. Above the 50 line means buyers are more than half; below it means sellers are more than half. This is one of the most important indicators for understanding trend." — Trader Steve, live stream, Oct 23, 2026 (translated from Korean) · ▶ Watch the stream highlights (Korean audio)
Strictly speaking, RSI compares the size of up moves and down moves, not the number of people. But bigger up moves mean the buying side pushed price up harder, so reading it as "buying strength vs. selling strength" points the same way. That is why the 50 line is the centerline where the two sides are balanced 1:1, and whether RSI is above or below it tells you which side currently has the upper hand.
Look closely at ② in the chart as well. Price made a higher high, yet RSI came down. Price is still rising, but the strength behind the rise has faded. When price and an indicator point in different directions like this, it is called divergence, which is covered separately in Divergence Basics (related lesson).
3. MACD: The Gap Between a Short-Term and a Long-Term Moving Average
Moving Average Convergence Divergence (MACD) was created by Gerald Appel in the late 1970s. The core idea fits on one line.
MACD line = 12-candle exponential moving average (EMA) - 26-candle EMA
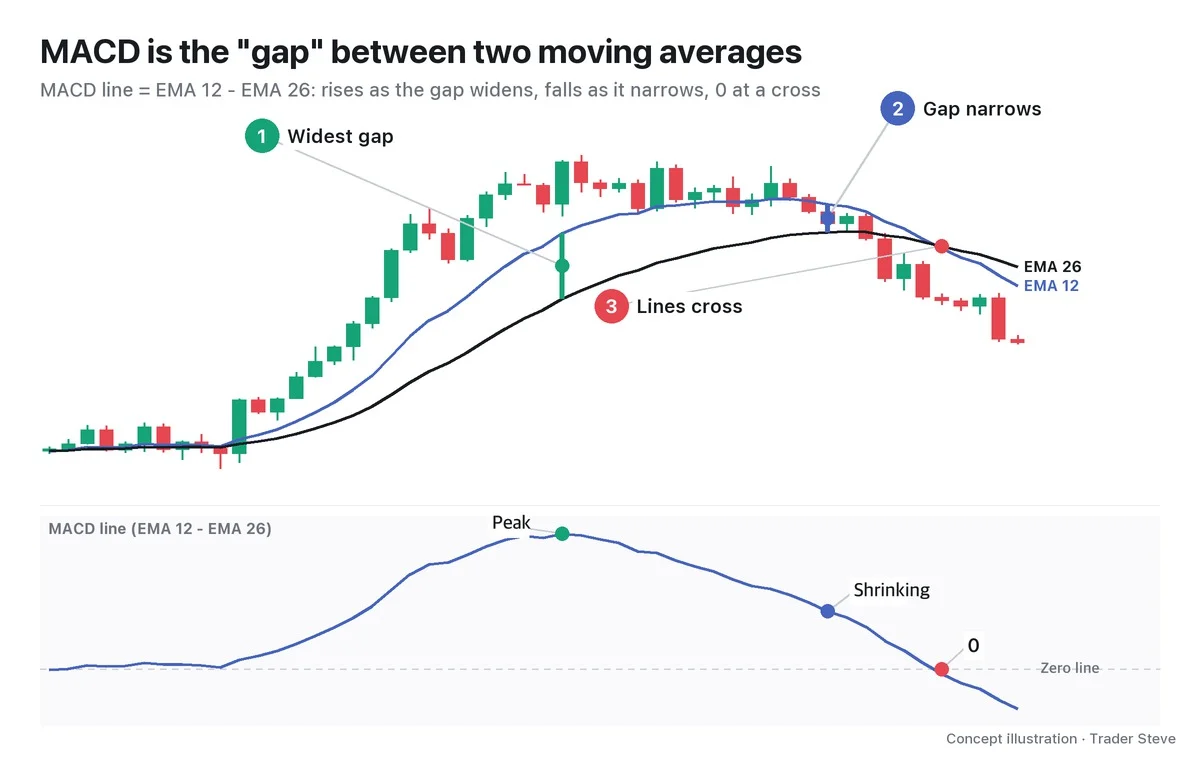
The short-term average (EMA 12) follows recent price quickly; the long-term average (EMA 26) follows it slowly. In a strong rally, the short-term average runs far ahead of the long-term one and the gap widens (①). When the rally stalls, the long-term average catches up and the gap narrows (②). At the moment the two lines cross, the MACD line passes through 0, the Zero line (③).
"What's MACD? It means the gap between the short- and long-term moving averages is gradually shrinking. … It means the amplitude is shrinking." — Trader Steve, live stream, Oct 23, 2026 (translated from Korean) · ▶ Watch the stream highlights (Korean audio)
I said this while explaining "the selling pressure is weakening" on a chart that had been falling. MACD heading back toward 0 does not mean the direction has changed; above all, it means the pressure that was pushing price one way is weakening. The signal line and histogram that come with MACD are covered in Part 2, starting with how they are built.
4. Stochastic: Where the Close Sits Within the Recent Range
The stochastic oscillator was developed by George Lane in the 1950s. The question it asks is simple: "Between the highest high and lowest low of the last 14 candles, how high, in percent, is the current close?"
%K = (close - 14-candle low) ÷ (14-candle high - 14-candle low) × 100
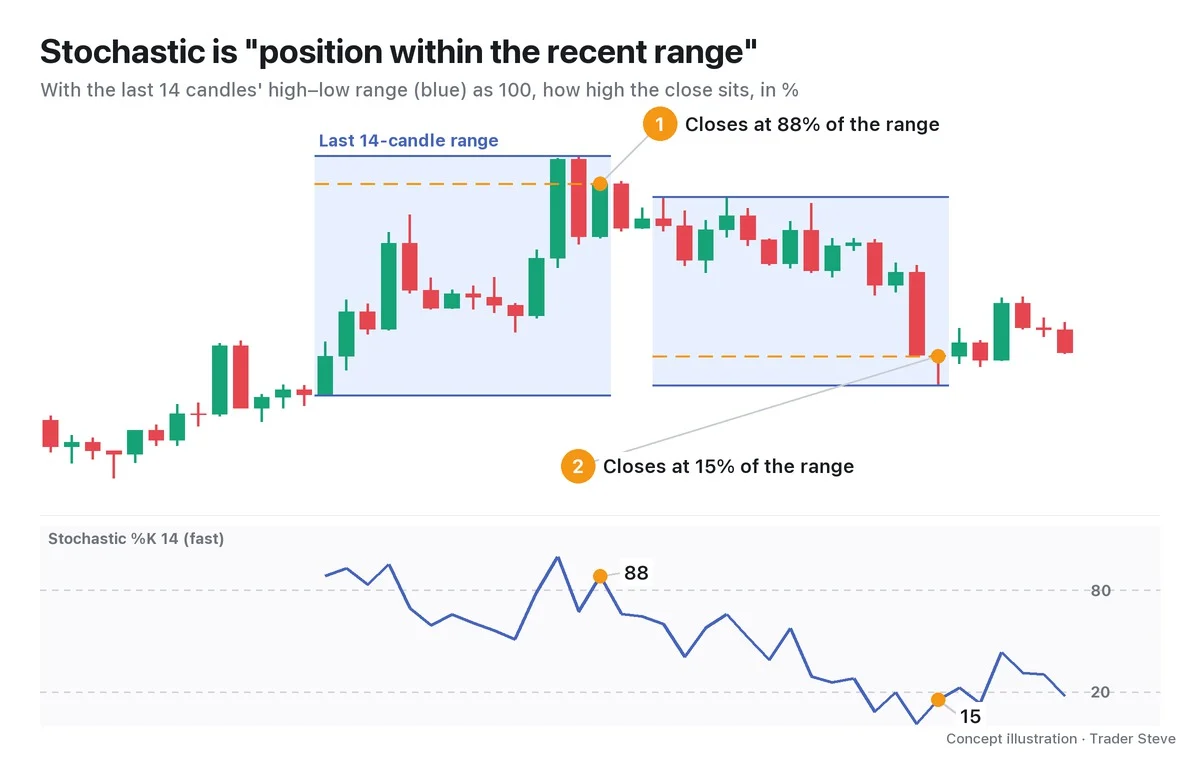
When the close lands near the top of the range, %K is close to 100; near the bottom, it is close to 0. Above 80 is usually marked as overbought and below 20 as oversold.
To show the principle, the chart plots the raw calculated value (fast %K). Real charting tools more often use the slow stochastic (14·3·3), which smooths this value once more with a 3-candle average. Part 2 explains the difference.
5. The Three Indicators Side by Side
| RSI | MACD | Stochastic | |
|---|---|---|---|
| What it measures | Ratio of up moves to down moves | Gap between the short- and long-term EMAs | Position of the close within the recent range |
| Range | 0–100 | Centered on 0, no limit | 0–100 |
| Reference lines | 50 (70·30) | 0 (zero line) | 20·80 |
| Good for | Which side has the upper hand | Trend acceleration and deceleration, crossovers | Short swings within a range |
| Weakness | Stays pinned to one side for a long time in strong trends | Lags, because it is built on moving averages | Reacts fast, so signals are frequent |
Of the three, I use the RSI 50 line the most. Whether weekly RSI is above or below 50 splits the big market regime, and the daily and 4-hour charts give the timing. Part 3 (the trading method) and Part 4 (real cases) cover this approach in detail.
6. RSI on a Real Bitcoin Chart
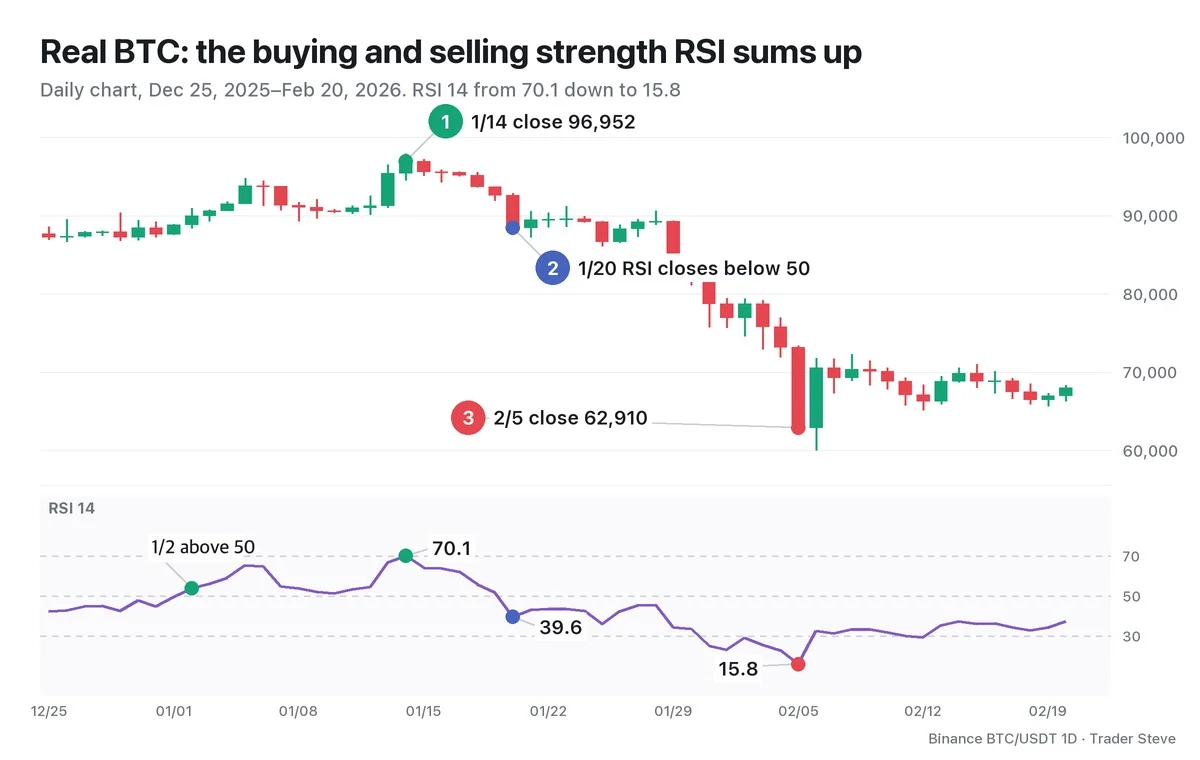
Let's read this stretch using RSI alone (this is a hindsight reading of a past chart).
- Jan 2: RSI closed above the 50 line at 53.9. Buying strength starts to lead selling strength.
- Jan 14: close 96,952, RSI 70.1. This was the day RSI peaked in this period.
- Jan 20: RSI closed below the 50 line at 39.6 (close 88,428). Now selling strength has the upper hand.
- Feb 5: close 62,910, RSI 15.8. That is 35.1% below the Jan 14 close, 22 days later.
With RSI alongside price, you can see when the balance of strength flipped around 50. But an extreme reading like RSI 15.8 does not mean the bottom is in. Part 5 covers how to read overbought and oversold.
Key Takeaways
- An oscillator is an indicator that measures the strength and speed of a move, not price, and all of them are calculated from price.
- RSI compares up moves and down moves over 14 candles. 50 is the centerline where both sides are equally strong.
- The MACD line is the gap between EMA 12 and EMA 26. It grows as the gap widens, shrinks as it narrows, and is 0 when they cross.
- Stochastic shows how high, in percent, the close sits within the range of the last 14 candles.
In Part 2, we'll calculate RSI by hand and cover how to read the settings and components of MACD and the stochastic oscillator.
If pulling up these indicators for every market, every time, gets tedious, the Omnisight Report puts RSI, MACD, divergence and structure together for you in one place.
This lesson adapts the text, figures and live-stream quotes of the Trader Steve TA series for the web, translated from the original Korean. Check the text and figure captions for the timing and interpretation of each real example, and read conceptual diagrams and real charts separately.
Corrections: support@omnisight.report