What Are Support and Resistance Levels? Meaning and How They Work
Historical examples for learning · not current prices or trade recommendations.
Contents
Spend enough time with charts and you'll notice price keeps stopping at the same places. On the way down it keeps finding a floor at about the same price; on the way up it keeps hitting a ceiling at about the same price. These places are called support and resistance. This lesson uses charts to explain what support and resistance are, why price stops at the same place again and again, and what the support/resistance flip (S/R flip) is — the role reversal in which broken resistance turns into support.
All dates and times are Korea Standard Time (KST, UTC+9). A daily candle is dated by its 09:00 KST open, a weekly candle by its Monday 09:00 KST open, and intraday times are the open time of the candle on the timeframe shown. The 74,968 low is the 03:00 1-hour candle on Sep 16 (the 01:00 4-hour candle), inside the Sep 15 daily candle.
1. The One-Line Definition: Floor and Ceiling
- Support (S): a price zone where falling price runs into buying and stops or bounces. It is the chart's floor.
- Resistance (R): a price zone where rising price runs into selling and stops or gets pushed back. It is the chart's ceiling.
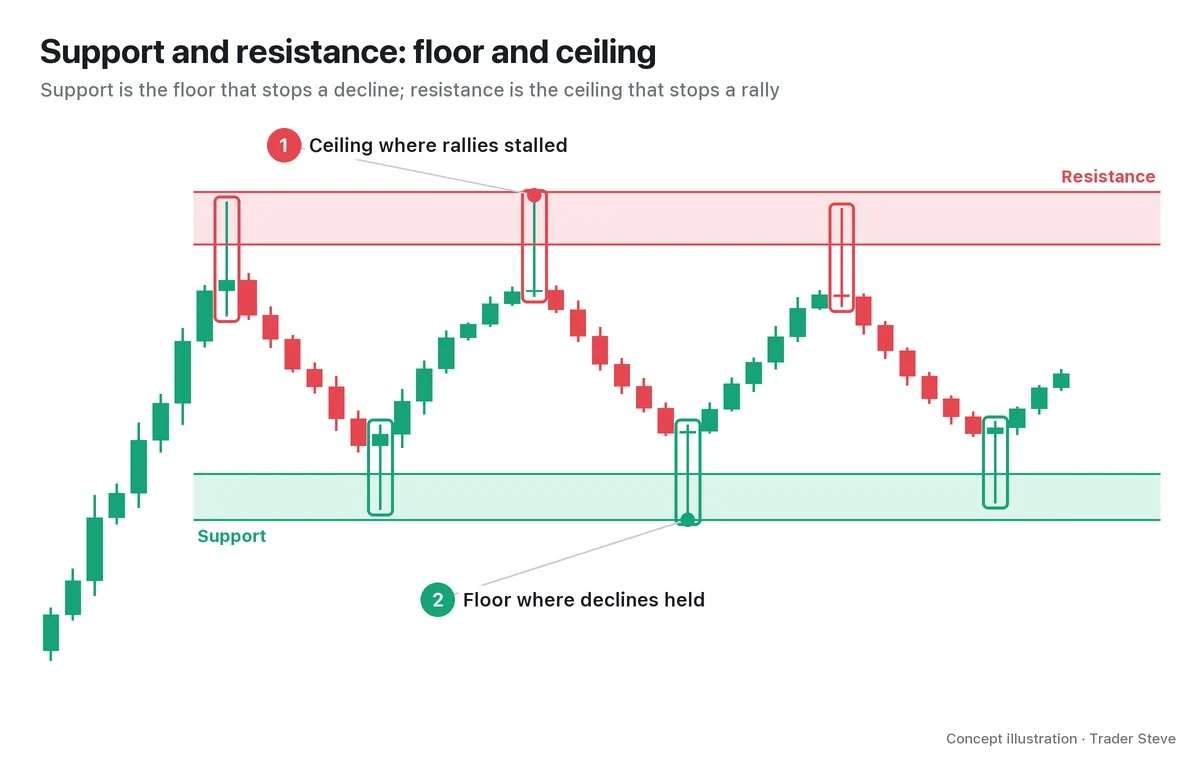
A stretch where price moves sideways, back and forth between support and resistance, is called a range. Look at the outlined candles in the chart: their wick tips don't touch exactly the same price. They turn a little above or a little below. That's why support and resistance are better treated not as a single line but as a price zone (S/R zone). Part 2 covers exactly where to draw a zone from and to.
2. Why Price Stops at the Same Place
A line on a chart has no power of its own. Price stops there because people's orders and memories are stacked at that price. There are three main reasons.
① Resting orders. A price that has bounced once is a natural place for limit buy orders from people thinking "if it comes back, I'll buy." Resistance works the same way: orders pile up from people thinking "if it gets there, I'll sell."
② The average entry of whoever held the line. If this is where a decline was first caught and pushed back up, the average entry price of the side that bought then sits nearby. When price returns to that spot, that side has a reason to defend it.
"These spots at the wick tips along the low line … they're where buying caught the downtrend and lifted it back up, right? … Big players' average entry, or a lot of buy orders, may be sitting here, so even if price pushes down this far, it may turn and head back up from here." — Trader Steve, live stream, Aug 27, 2026 (translated from Korean) · ▶ Watch this moment (Short, Korean audio)
③ Everyone watches the same line. An obvious high or low is visible to anyone looking at that chart. Because many people buy, sell and set stop-losses using the same price as their reference, orders really do cluster there.
"I'm not the only one watching this line, right? Everyone in the world trading Hynix is watching this line. … The moment this breaks, psychologically, there's a high chance everyone dumps together." — Trader Steve, live stream, Oct 7, 2026 (translated from Korean) · ▶ Watch the stream highlights (Korean audio)
That was said about the daily chart of SK Hynix (a Korean memory-chip maker), but the principle is the same for crypto or stocks. The reason a line holds and the reason it collapses when it breaks come from the same place: everyone is watching it.
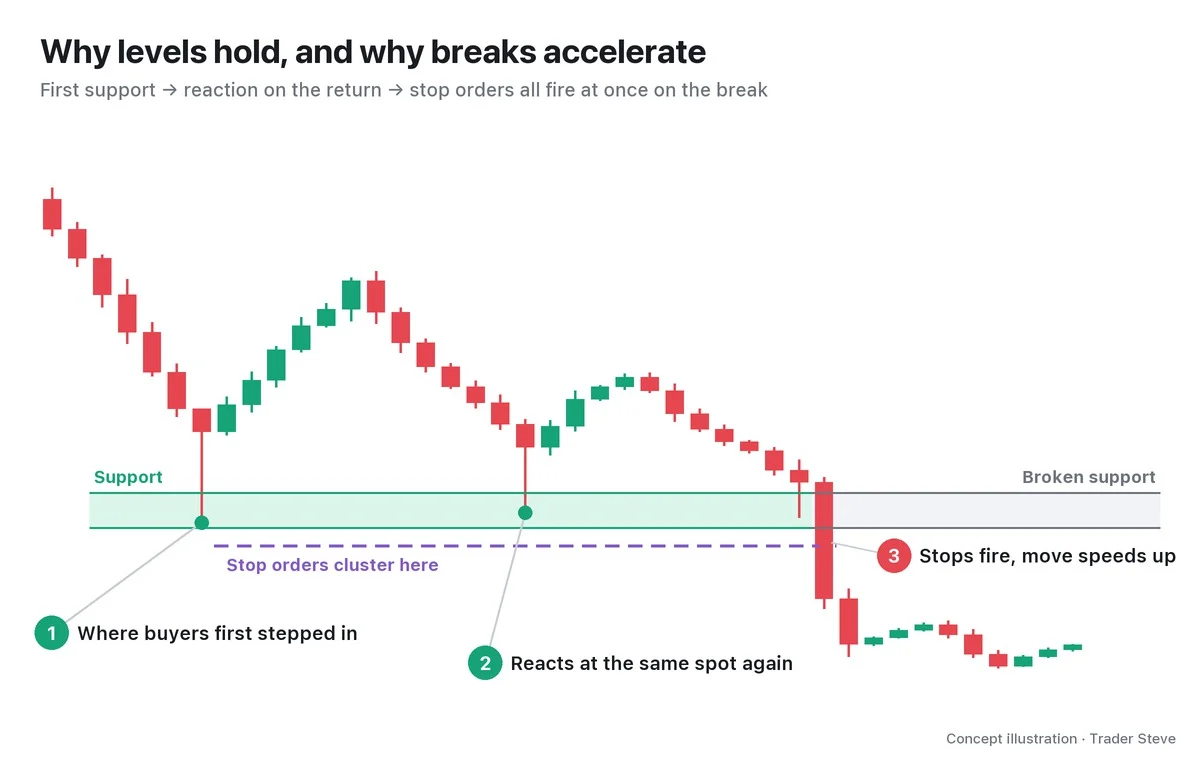
3. Why Breaks Move Fast: Stop Orders
Most people who buy at support place their stop-loss just below the support zone. That's the purple dotted line in the chart. While support holds, those orders wait quietly, but once price breaks below the zone, they all turn into market sell orders at once.
On top of that come new sellers who reason, "support broke, so it's going down." The buying that was holding the line disappears and only sell orders pile in, so — as in ③ in the chart — the breakdown candle tends to be longer than any candle before it. A price zone packed with stop orders is itself liquidity; moves that deliberately poke just past it to grab those orders are covered separately in ICT Liquidity Sweeps (related lesson).
In short, support and resistance act as a brake while they hold and an accelerator the moment they break. The same orders play opposite roles depending on which side of price they sit.
4. The S/R Flip: Broken Resistance Becomes Support
This is the single most important property of support and resistance. Broken resistance becomes support, and broken support becomes resistance. This role reversal is called the support/resistance flip (S/R flip).
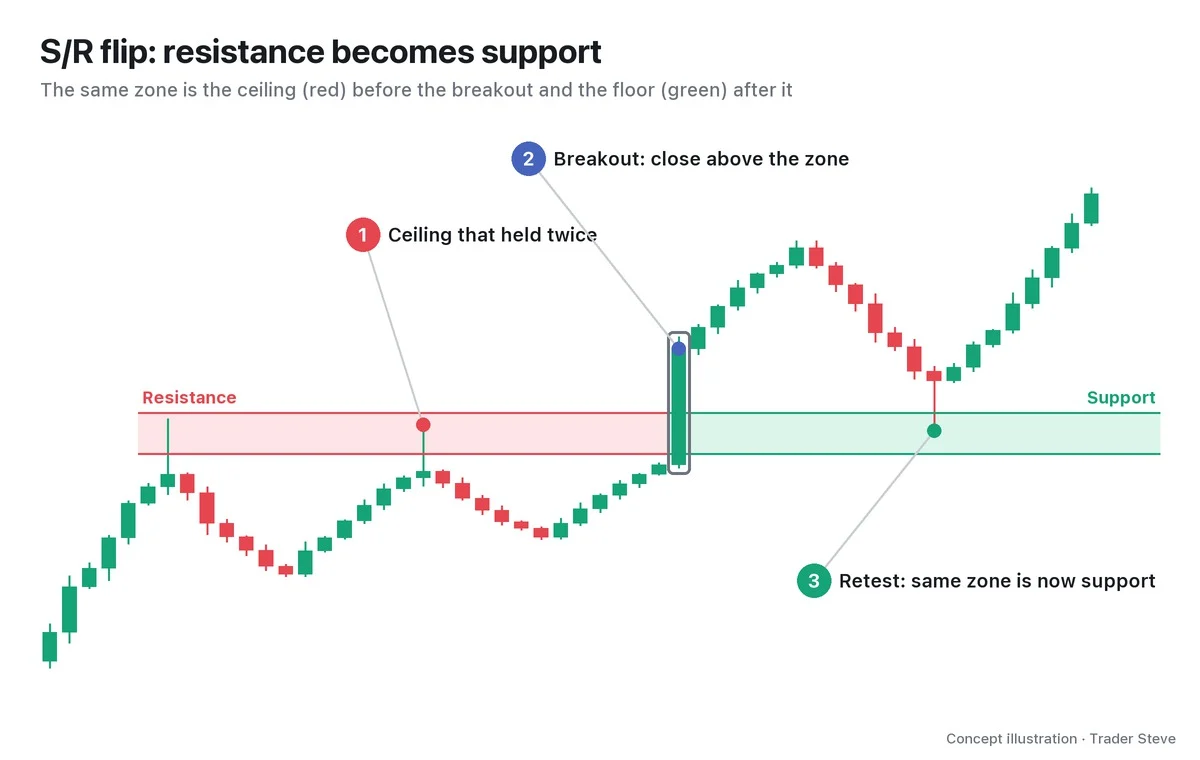
"An S/R flip is nothing fancy. It's a flip of support and resistance — a spot where a reversal happened. These are lines that used to be resistance but turn into support once they're broken — you could call them support/resistance lines." — Trader Steve, live stream, Oct 1, 2026 (translated from Korean) · ▶ Watch the stream highlights (Korean audio)
Why do the roles reverse? The order flow you just looked at explains it.
- Those who sold at the ceiling: anyone who sold at resistance is underwater after the breakout. When price comes back to that spot, they buy to close out at breakeven.
- Those who missed the breakout: anyone who saw the large bullish candle but didn't buy waits, thinking "if it comes back there, I'll buy."
- Those who bought the breakout: the average entry of the buying that drove the breakout sits near that zone.
All three groups place buy orders in the same price zone, so the former ceiling starts acting as a floor. In reverse, broken support becomes the place where people trapped below it sell to get out at breakeven, so it turns into resistance. The move back into the zone after a breakout, confirming its new opposite role, is called a retest. Part 2 covers which breakouts you can trust (the closing-basis rule), and Part 3 covers how to turn a retest into an entry plan.
5. Real Bitcoin: The Same Floor and Ceiling for a Month
Do ranges this clean show up on real charts? Let's look at the Bitcoin 4-hour chart from Aug 22 to Sep 21, 2026.
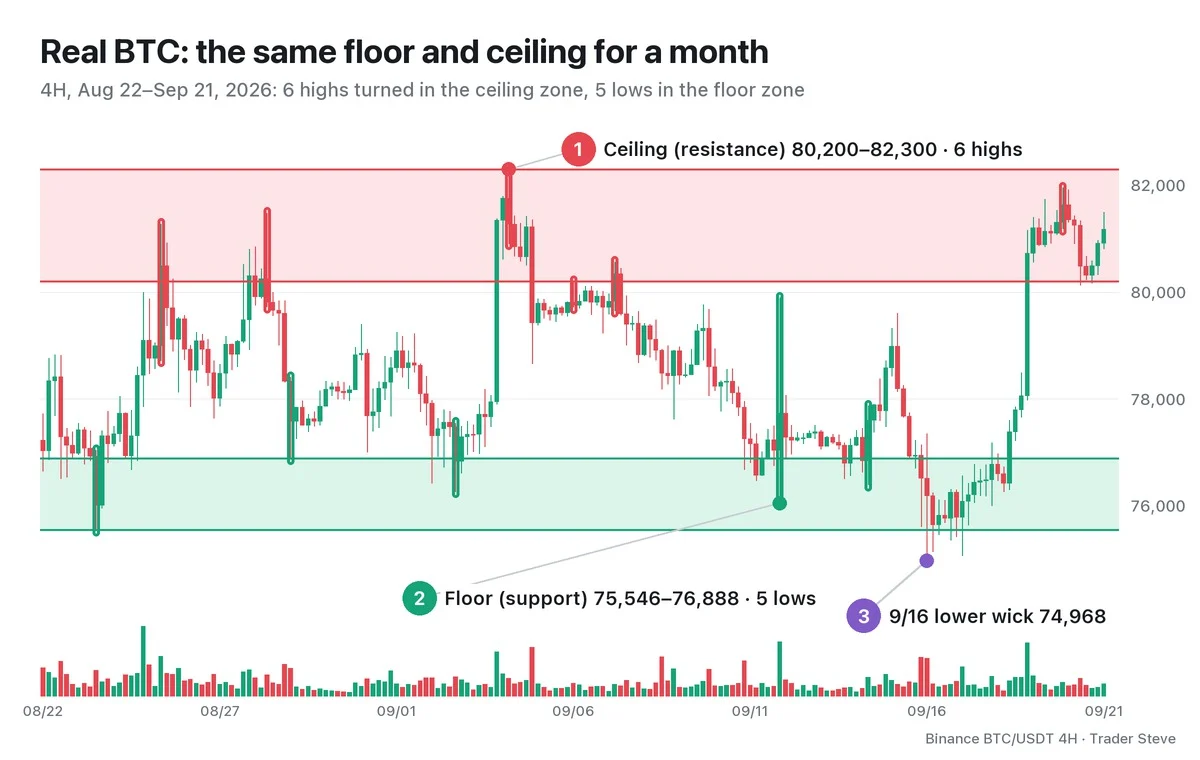
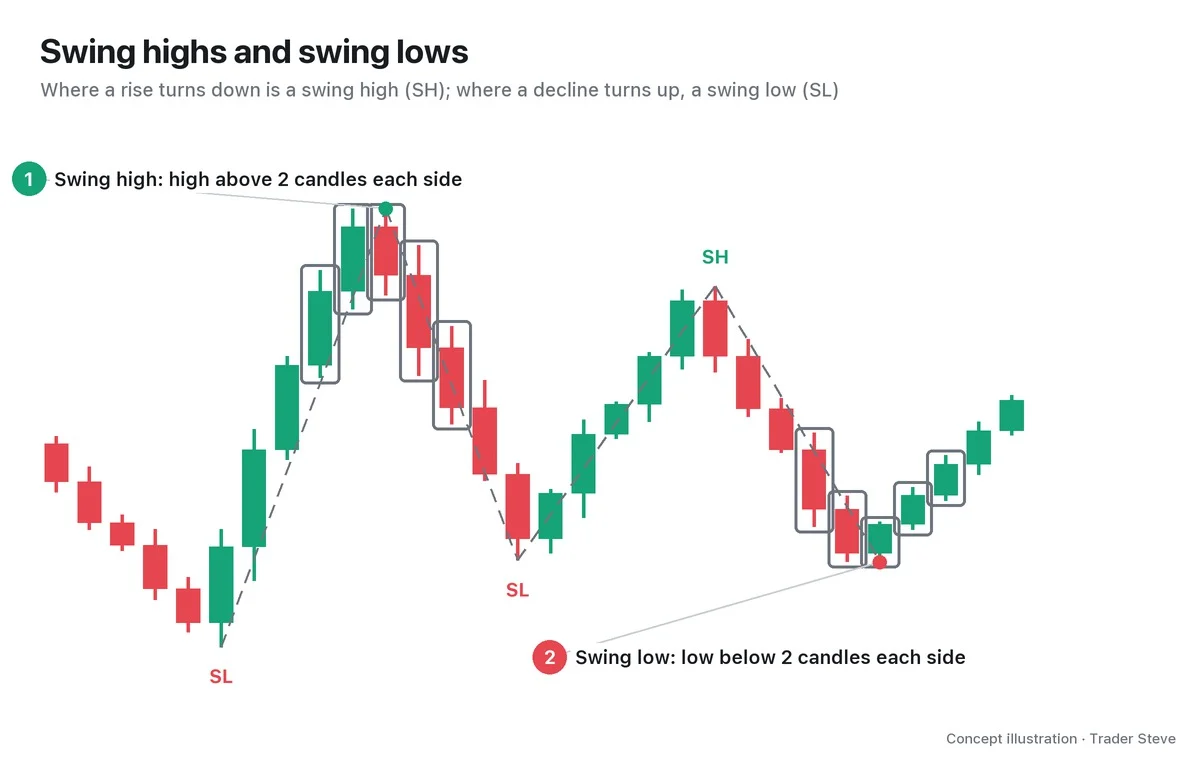
A swing high (or low) here is a candle that is higher (or lower) than the 6 candles on each side (how to find swings is covered in Basics Swings and Trend, basics/swing-trend).
- ① Ceiling (resistance) 80,200–82,300: all 6 swing highs above 80,000 turned down inside this zone (8/25, 8/28, 9/4, 9/6, 9/7, 9/19).
- ② Floor (support) 75,546–76,888: of the 6 swing lows below 77,000, 5 clustered in this zone — every one except a single wick on Sep 16 (8/23, 8/29, 9/2, 9/11, 9/14).
- ③ The 01:00 candle on Sep 16 wicked down to 74,968, poking about 0.8% below the floor zone, but that candle closed at 76,186, back inside the zone.
The number that matters most is the close. Over this month, the highest 4-hour close was 81,755 (9/4 01:00) and the lowest was 75,644 (9/16 05:00). Wicks poked out of the zones, but not a single close landed outside the two zones. From the top edge of the floor zone to the bottom edge of the ceiling zone is about 4.3%, so price spent the whole month moving up and down inside that range.
This ceiling zone broke to the upside on Sep 21. Whether the zone actually turned into support afterward is followed up in Case A of Part 4.
Key Takeaways
- Support is the floor and resistance is the ceiling. Treat them as price zones, not single lines.
- Price stops at the same place because of resting orders, the average entry of whoever held the line, and the fact that everyone watches the same line.
- Stop orders cluster just below support, so the move speeds up the moment it breaks.
- Broken resistance becomes support, and broken support becomes resistance (the S/R flip). The return to that zone to confirm it is the retest.
- Check whether the close, more than the wick, held the zone. Even so, support and resistance are places to watch for a reaction, not confirmed signals.
In Part 2, we'll cover the steps for drawing support and resistance as zones rather than lines, the criteria for picking strong zones, and what makes a breakout trustworthy.
Redrawing support and resistance zones by hand for many markets and many timeframes takes more time than you'd think. The Omnisight Report lays out these key price zones for each market.
This lesson adapts the text, figures and live-stream quotes of the Trader Steve TA series for the web, translated from the original Korean. Check the text and figure captions for the timing and interpretation of each real example, and read conceptual diagrams and real charts separately.
Corrections: support@omnisight.report