What Are Swing Highs and Swing Lows? How to Define a Trend
Historical examples for learning · not current prices or trade recommendations.
Contents
"Are we in an uptrend or a downtrend right now?" It's the first question you run into when you start studying charts. The answer is simpler than you might think. Find the points where price turned — the swing highs and swing lows — and check whether they are stepping up or stepping down. This lesson uses charts to show what swing highs and lows are, and the definition of a trend: "higher highs and higher lows mean up; lower highs and lower lows mean down."
All dates and times are Korea Standard Time (KST, UTC+9). A daily candle is dated by its 09:00 KST open, a weekly candle by its Monday 09:00 KST open, and intraday times are the open time of the candle on the timeframe shown.
1. Swing Highs and Lows: Where Price Turned
Charts move in waves, up and down. When a rise turns down at some point, that peak is a swing high (SH); when a decline turns up, that trough is a swing low (SL).
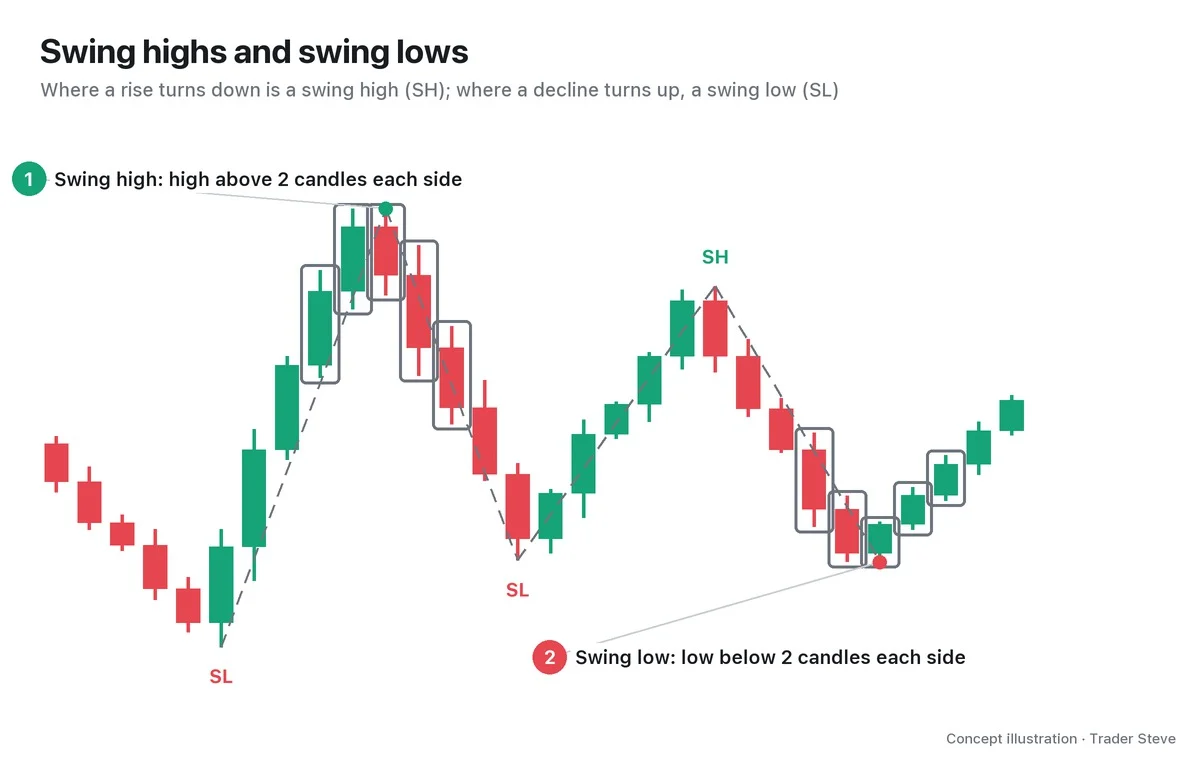
If you pick "the turning points" by eye, different people will mark different spots. That's why you usually set a rule:
- Swing high: the candle's high is above the highs of the n candles to its left and the n candles to its right
- Swing low: the candle's low is below the lows of the n candles to its left and the n candles to its right
The chart uses n=2, comparing each candle with the 2 candles on each side. This rule is also called a fractal. The larger you make n, the more the small turns drop out and only the big ones remain. Two issues — that a swing is only confirmed once all the candles on its right have formed, and that the verdict changes depending on what n you choose — are covered in detail in Part 2.
Connect these points in order and a busy chart simplifies into a single zigzag line. Reading a trend means reading the shape of that zigzag.
2. Defining a Trend: Higher Highs and Higher Lows (HH, HL)
Compare each swing high with the previous swing high, and each swing low with the previous swing low. Comparing like with like is the key.
| Label | Name | Meaning |
|---|---|---|
| HH | Higher high | a high above the previous swing high |
| HL | Higher low | a low above the previous swing low |
| LH | Lower high | a high below the previous swing high |
| LL | Lower low | a low below the previous swing low |
An uptrend is a sequence in which HHs and HLs alternate. Traders usually sum it up as "making higher highs and higher lows."
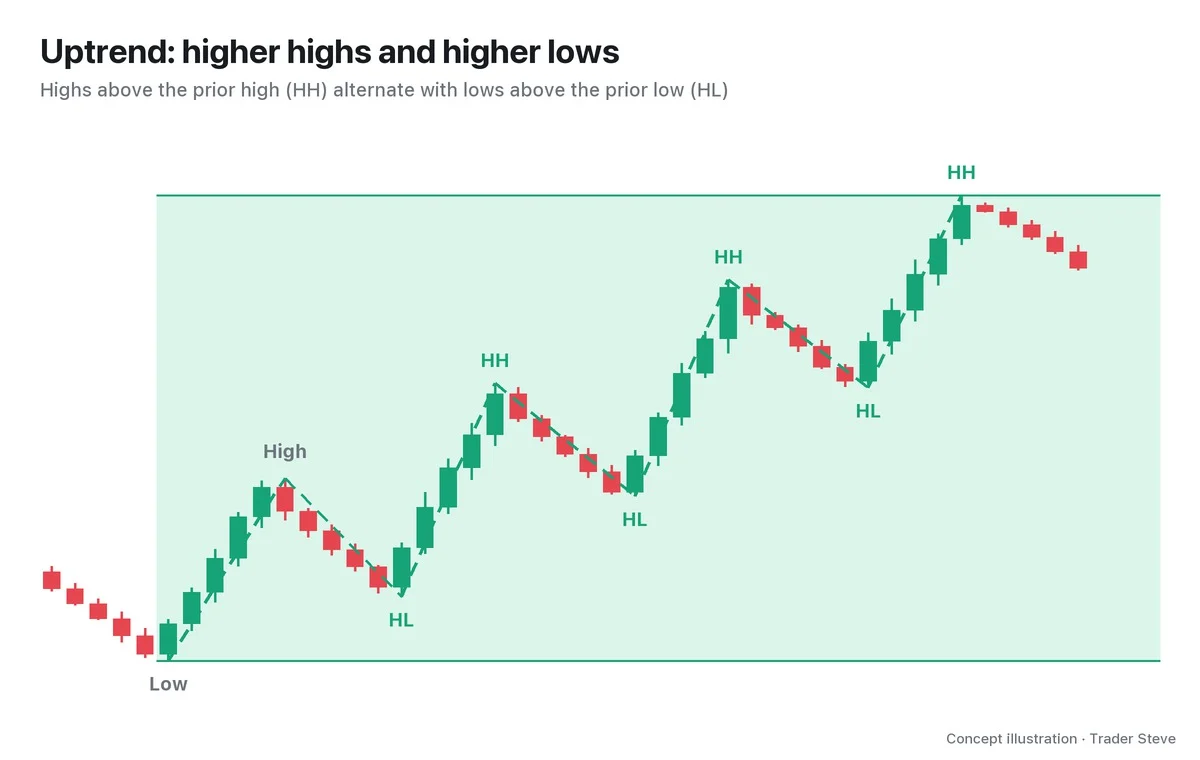
As the chart shows, price doesn't rise in one go. It rises (HH), then pauses and pulls back (HL) — but the pullback stops above the previous low. That means buyers step back in before price slips all the way to the earlier low. As long as this staircase continues, you treat the market as an uptrend.
"To put it plainly, what's the definition of a bull market? A bull market starts when the swing highs and swing lows keep getting higher." — Trader Steve, live stream, Aug 20, 2026 (translated from Korean) · ▶ Watch this moment (Short, Korean audio)
In the same moment, I added that it is still an open question whether each of the small moves happening right now should count as a swing. In other words, deciding what size of turn counts as a swing is where judging a trend begins.
3. Downtrend: Lower Highs and Lower Lows (LH, LL)
A downtrend is the exact mirror image. Each high is below the previous high (LH), and each low is below the previous low (LL).
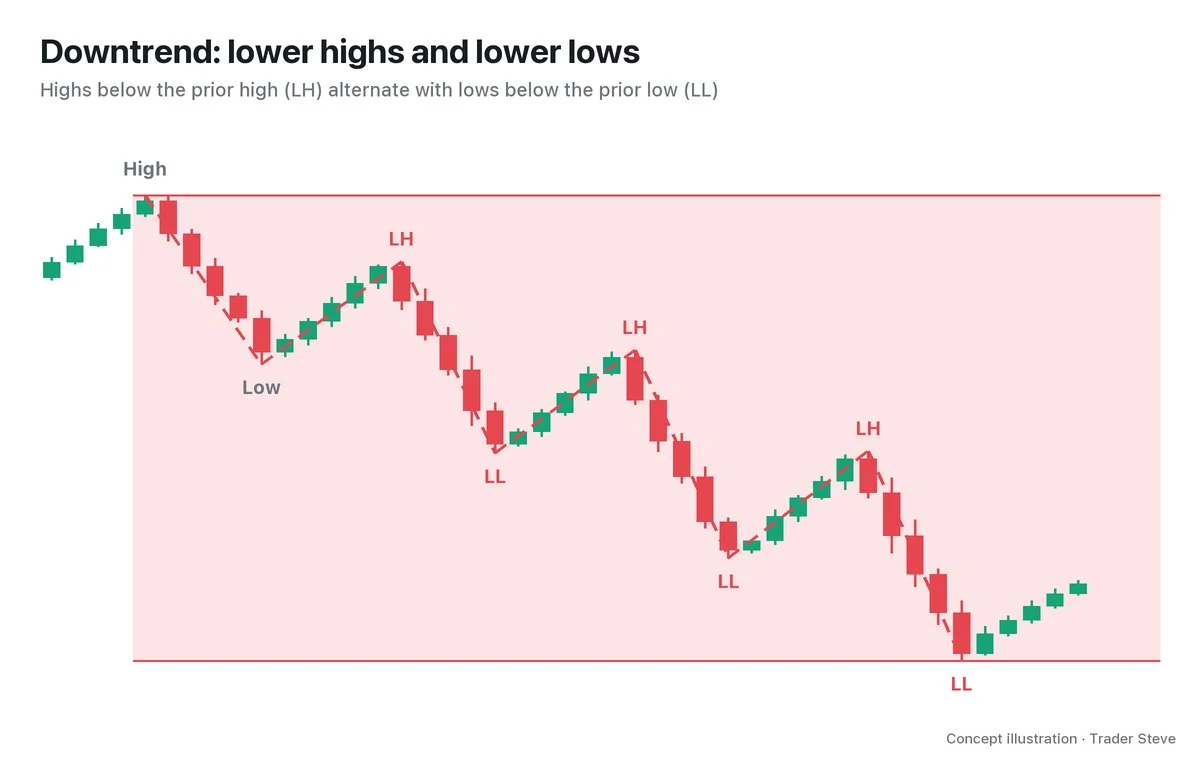
Bounces do happen, but they fail to recover the previous high, and when price falls again it breaks below the previous low. Sellers are offering size at lower and lower prices on each bounce. A bounce inside a downtrend can sometimes look big, but if it doesn't make a higher high, the structure is still down.
4. Neither Up Nor Down: A Range
What happens when highs and lows keep repeating at the same level? The labels get mixed: HH, LH, HL, LL. That state is a range (a sideways market).
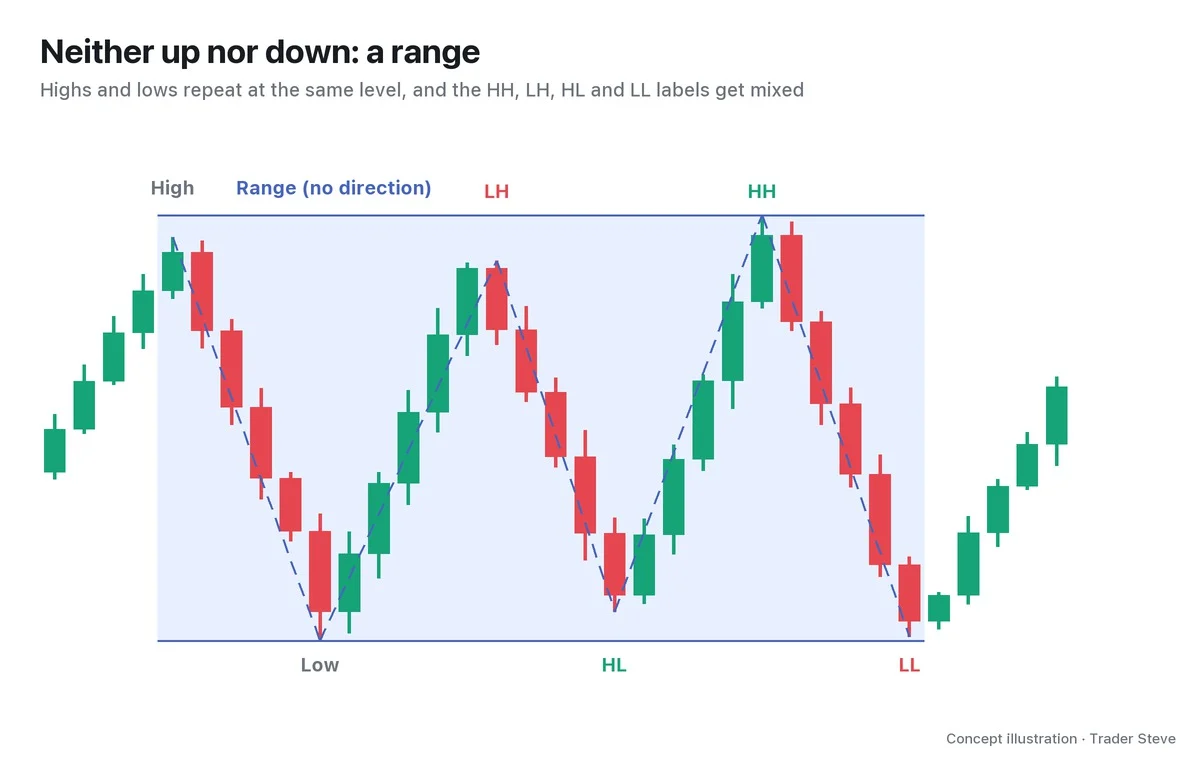
There's a common mistake here: seeing a single HH or a single LL at the right edge of the chart and deciding "the rally has started" or "the decline has started." Inside a range, price often pokes slightly past the top or bottom. Call it an uptrend only when HHs and HLs continue together, and a downtrend only when LHs and LLs continue together; otherwise, it's safer not to pick a direction.
5. Real ETH Daily Chart: A Staircase of Higher Highs and Higher Lows
Let's check whether the same shape appears on a real chart, using the Ethereum (ETH) daily chart. Swings were found with 7 candles on each side (a week before and after).
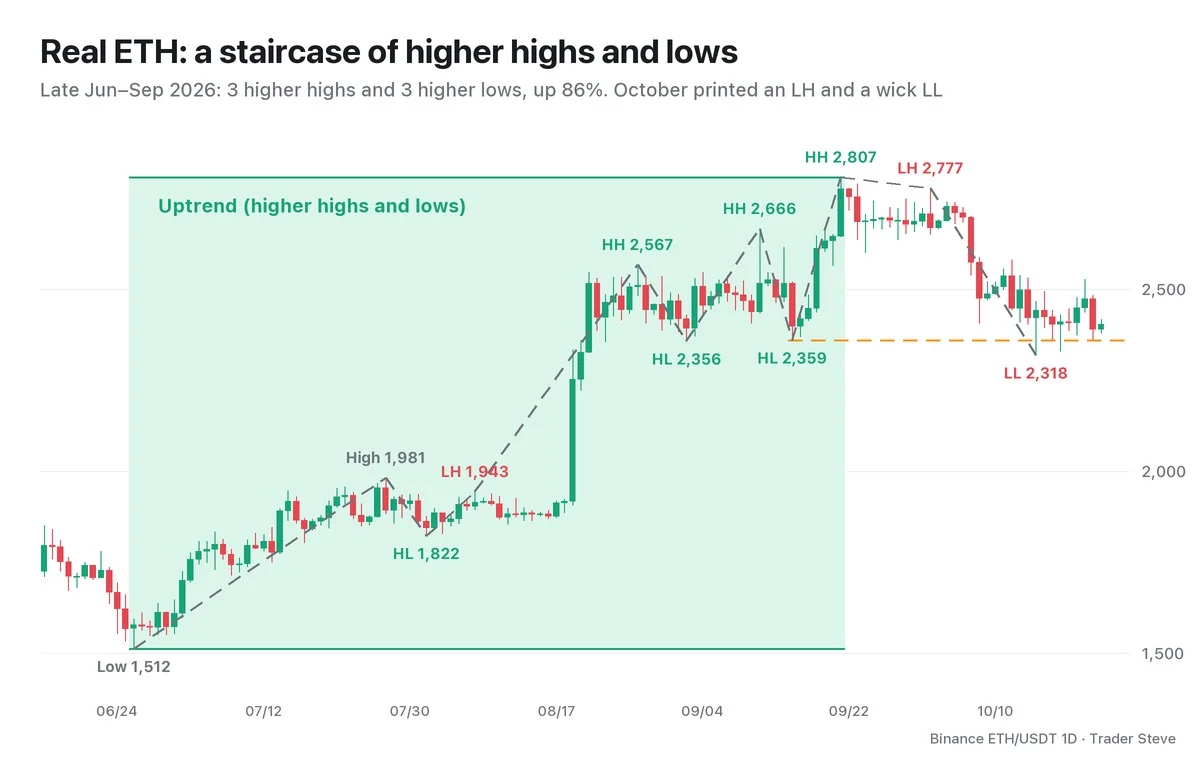
- From the Jun 26 low of 1,512 to the Jul 27 high of 1,981
- Aug 1 low 1,822 (HL) → Aug 27 high 2,567 (HH)
- Sep 2 low 2,356 (HL) → Sep 11 high 2,666 (HH)
- Sep 15 low 2,359 (HL) → Sep 21 high 2,807 (HH)
The Aug 7 high of 1,943 in between was a small LH, below the previous high, but it did not break the HL of 1,822 just before it, and the next high jumped to 2,567. The Sep 2 and Sep 15 lows were about $2.5 apart, almost the same level.
In October the shape changed. The Oct 2 high of 2,777 was an LH, below the Sep 21 high, and the Oct 15 low of 2,318 dropped below the Sep 15 low (orange dashed line), an LL. That day, however, the candle closed at 2,442, above the dashed line, and through Oct 23 not a single candle closed below it (lowest close 2,389). How to tell a break by the wick from a break by the close, and whether the first LH or the break of the last HL counts as the trend change, are the subject of Part 2.
6. Why It Underpins Every Method: Dow Theory
The definition "higher highs and lows mean up, lower highs and lows mean down" comes from Dow Theory. It grew out of articles Charles Dow wrote more than 100 years ago, and the idea that "a trend continues until a reversal is confirmed" comes from it too.
"Everything was built on Dow Theory, which came out 200 years ago. If you're in a trend of higher highs and higher lows, it's a bull market; if you're in a trend of lower highs and lower lows, it's a bear market. That's all there is to it." — Trader Steve, live stream, Oct 7, 2026 (translated from Korean) · ▶ Watch the stream highlights (Korean audio)
"200 years" is exactly what was said on the live stream; take it to mean "a very old foundation" rather than an actual date. In the same stream, I added that Wyckoff, harmonic patterns, Elliott Wave and ICT are all built on top of it. In fact, ICT's market structure, Wyckoff's accumulation and distribution, and Elliott's wave numbering all start from where you mark the swing highs and lows. ICT-style structure reading built on this definition continues in the ICT Market Structure topic (related lesson).
Key Takeaways
- Swing highs (SH) and swing lows (SL) are where price turned. You pick them by whether a candle is higher or lower than the n candles on each side.
- Compare highs with highs and lows with lows, then label them HH, HL, LH or LL.
- HH + HL = uptrend; LH + LL = downtrend. The definition comes from Dow Theory.
- When the labels mix, it's a range. Don't pick a direction from a single HH or a single LL.
- Whether a trend has ended is judged by the whole structure, not by one swing (Part 2).
In Part 2, we'll cover the rules for finding swings precisely and telling HH from HL, and the criteria for deciding that a trend has ended.
Marking swing structure by hand on every timeframe for several markets takes more time than you'd expect. The Omnisight Report lays out this structure analysis for each market.
This lesson adapts the text, figures and live-stream quotes of the Trader Steve TA series for the web, translated from the original Korean. Check the text and figure captions for the timing and interpretation of each real example, and read conceptual diagrams and real charts separately.
Corrections: support@omnisight.report