What Is a Trendline? Trendlines, Channels and Why the Lines Work
Historical examples for learning · not current prices or trade recommendations.
Contents
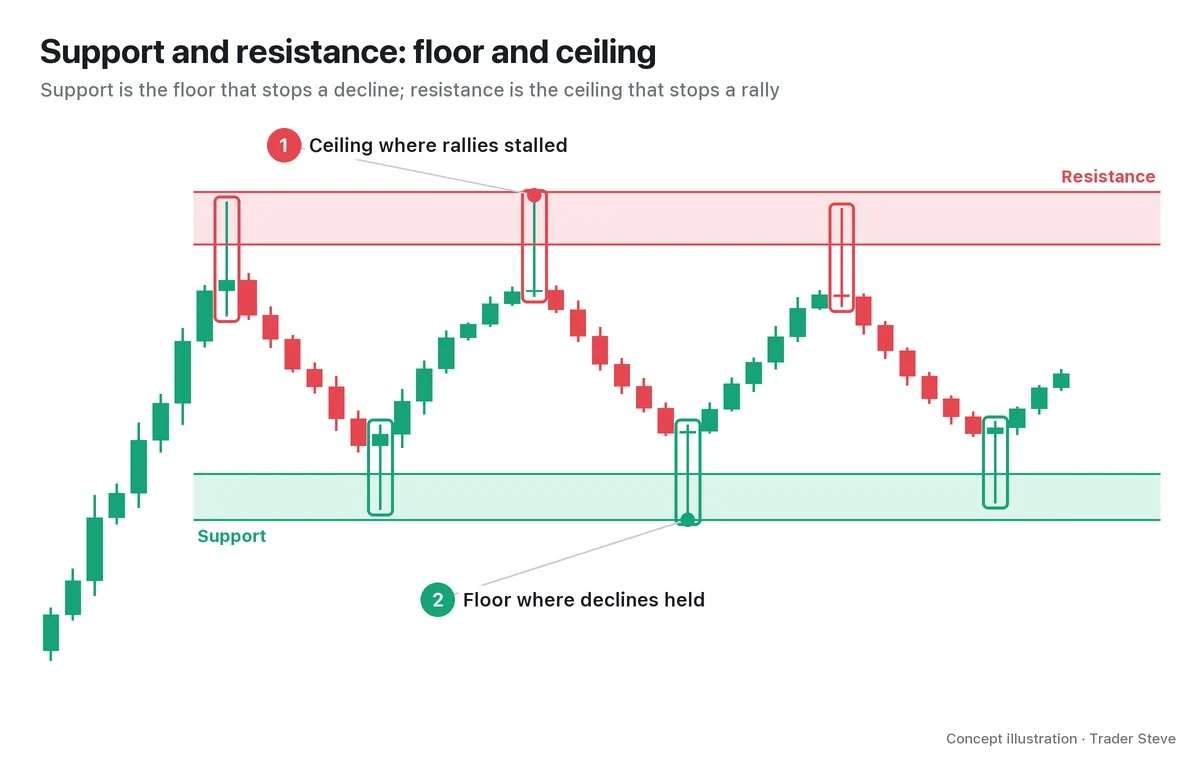
In the support and resistance series, I drew horizontal lines where price had stopped several times. In a trending market, though, the places where price stops rise or fall along with the trend. Tilt that horizontal line to match the slope of the trend and you get a trendline. This lesson uses diagrams and a real Bitcoin (BTC) chart to show what trendlines and channels are and why they actually work on a chart.
All dates and times are Korea Standard Time (KST, UTC+9). A daily candle is dated by its 09:00 KST open, a weekly candle by its Monday 09:00 KST open, and intraday times are the open time of the candle on the timeframe shown.
1. The One-Line Definition: Horizontal Support and Resistance, Tilted
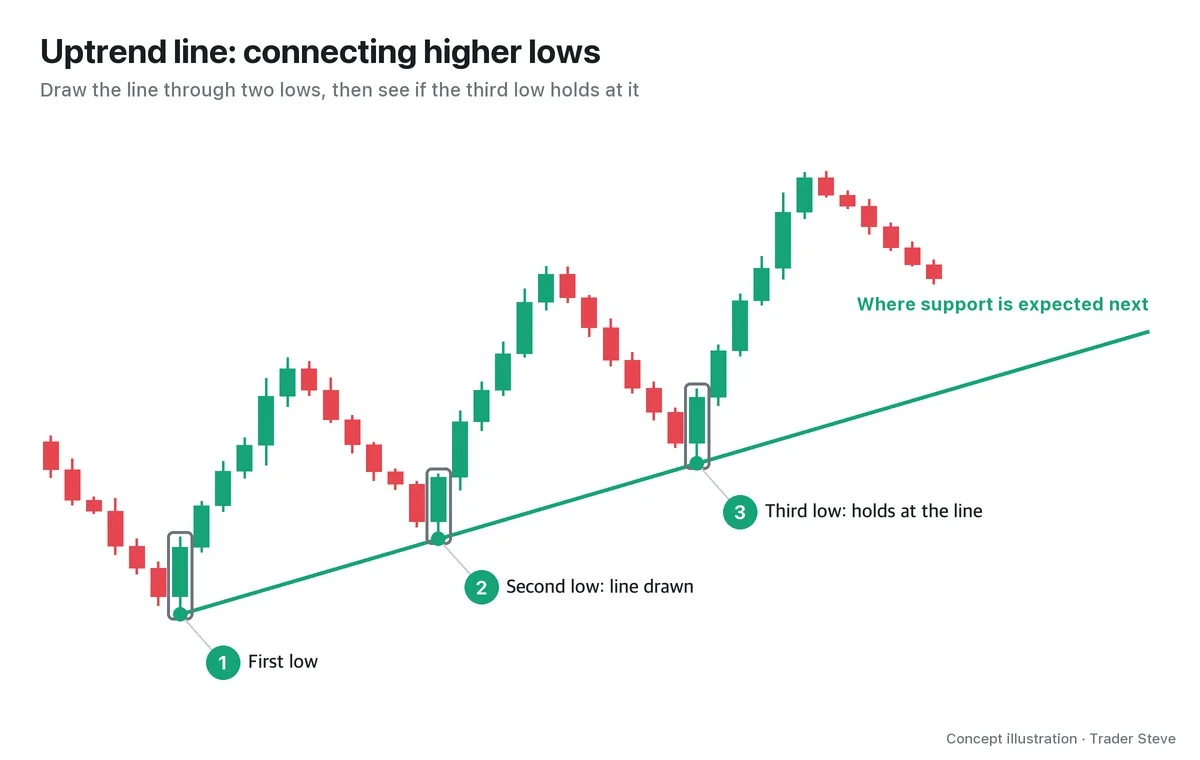
A trendline (TL) is a straight line connecting two or more confirmed swing lows, or two or more confirmed swing highs.
Two ground rules matter here.
- Two points are a hypothesis; the third touch is the confirmation. With only two points, you can draw any straight line you like. Only when a third swing stops near that line can you say the market is paying attention to it.
- A touch means "near the line." In this series, a swing high or low counts as a touch when it comes within 0.4–0.6% of the line. It is common for a wick to poke slightly through the line or stop just short of it.
Korean traders often call these diagonal support and resistance lines bitgak (roughly, "slanted line"). The name differs, but the meaning is the same: support and resistance on a slope. The rules for picking swing highs and lows are covered in the Basics Swings and Trend series (related lesson), and the horizontal version of the line in the Basics Support and Resistance series (related lesson).
2. Uptrend Lines and Downtrend Lines
There are two kinds of trendline, depending on which points you connect.
| Type | Points connected | Role | If it breaks |
|---|---|---|---|
| Uptrend line | rising swing lows | support from below | a sign that the pattern of higher lows is weakening |
| Downtrend line | falling swing highs | resistance from above | a sign that the pattern of lower highs is weakening |
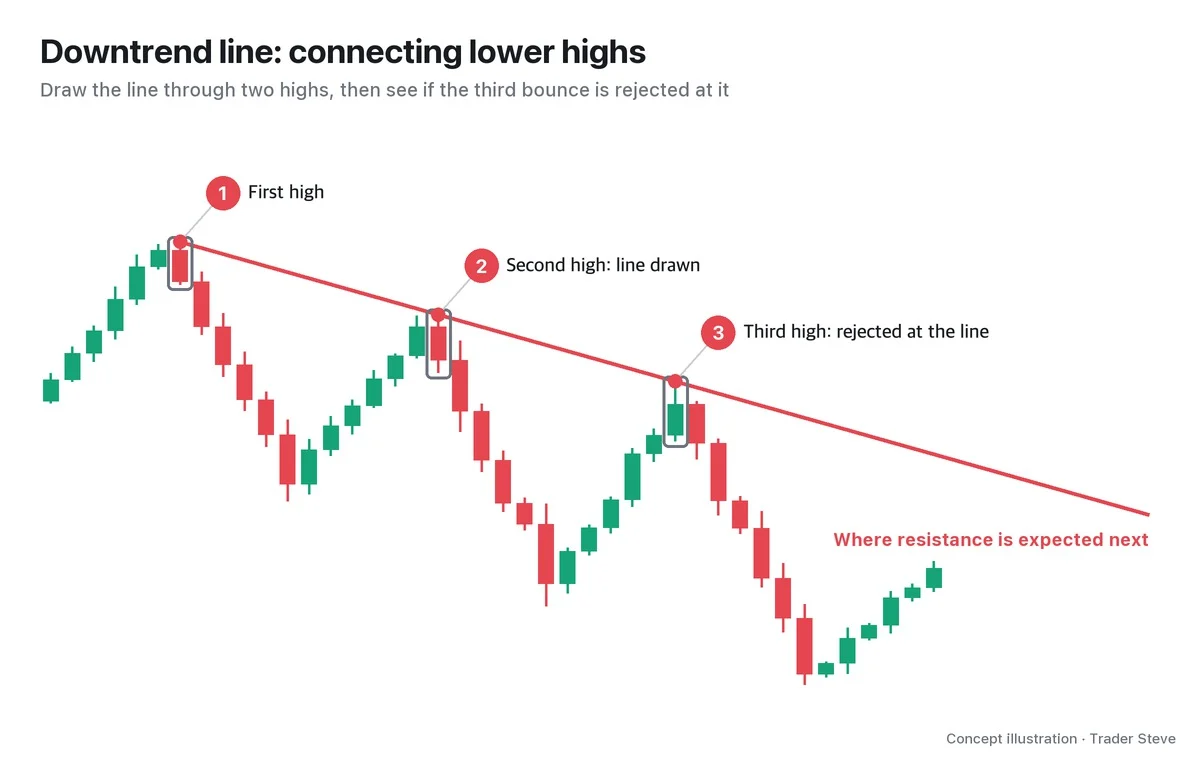
The biggest difference between a trendline and a horizontal line is that the line's price changes as time passes. That's why you extend the line into the empty space on the right, marking in advance roughly where support or resistance should be.
3. Channels: Trendline + Parallel Line
Once you've drawn a trendline, draw a parallel line through the point that went farthest the other way between the two anchor points, and you have a price channel. In an ascending channel, the trendline connecting the lows is the floor, and the parallel line through the highest high between them is the ceiling.
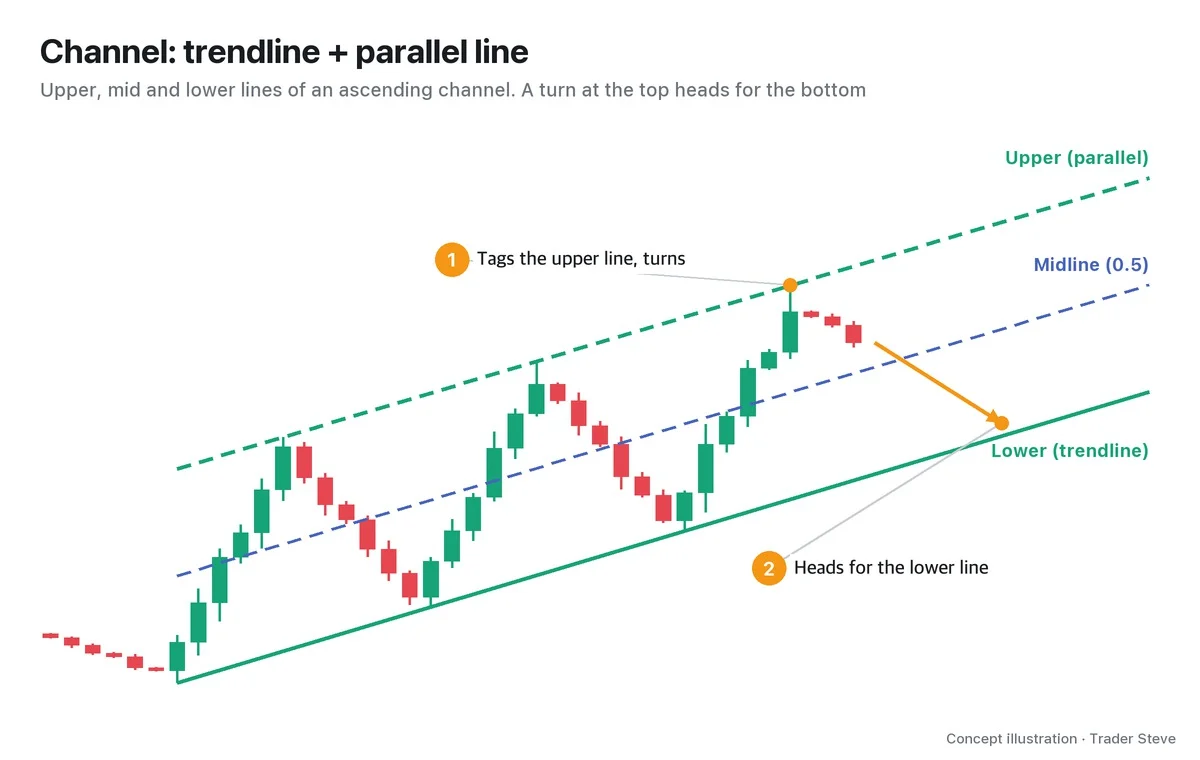
- Lower line: in an ascending channel, this is the trendline itself.
- Upper line: the parallel line through the opposite extreme.
- Midline (0.5): exactly halfway between the two lines. It often acts as a resting point for price inside the channel.
Channels are grouped by slope into three kinds. A channel tilted up is an ascending channel, one tilted down is a descending channel, and one with a slope of 0 is a horizontal channel — what is usually called a range.
Once a channel is drawn, you can see where price sits inside the corridor.
"Technically speaking, when you've built a channel, if price tags the top of the channel and turns, it's heading for the bottom of the channel." — Trader Steve, live stream, Aug 26, 2026 (translated from Korean) · ▶ Watch the stream highlights (Korean audio)
In the same breath, I added that this is a picture seen "purely structurally" and that there is no single right answer. A channel is not a tool for calling direction; it is a tool for setting reference points — upper, mid and lower lines — in advance. Part 2 covers dividing the channel into quarters with 0.25 and 0.75 lines as well.
4. Why the Lines Work
There are three ways to explain why a trendline actually stops price instead of just being a drawing.
- Many people are looking at the same line. A line connecting two conspicuous highs or lows comes out about the same no matter who draws it. Buy orders, sell orders and stop orders gather near that line, and price reacts where orders gather.
- The slope is the speed of the trend. The slope of an uptrend line shows how much the lows are rising each day. Gentle lines last a long time; an overly steep line has trouble keeping up that pace for long.
- A line is not one exact price but a zone around it. Some traders connect wicks and others connect bodies, so the reaction comes from a band slightly above and below the line.
That said, the lines are not easy to see at first.
"Whether it's trendlines or support and resistance lines, these lines start jumping out at you. … But you won't see them after looking for a day or two. For me, too, it's from watching for years, ten-plus hours a day, that they've come to catch my eye so naturally — you can't discount that experience." — Trader Steve, live stream, Oct 7, 2026 (translated from Korean) · ▶ Watch the stream highlights (Korean audio)
That's why this series draws lines with one rule only: "two confirmed swing points + a third touch."
5. Real BTC: A Nine-Month Downtrend Line
Let's check it on a real Bitcoin daily chart.
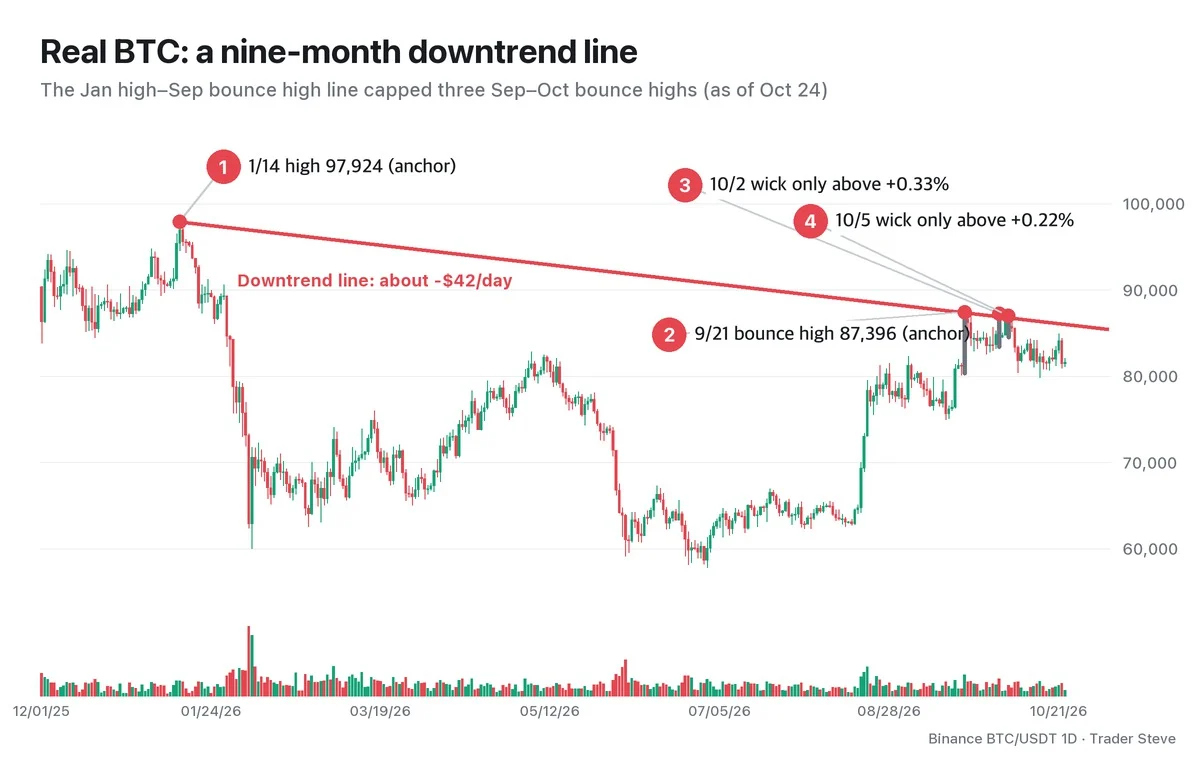
- ① Anchor 1: the Jan 14, 2026 high of $97,924 — the highest price in the chart window.
- ② Anchor 2: the Sep 21 bounce high of $87,396 — a high 10.8% below the January high.
The two points are 250 days apart, and the line falls about $42 a day. Every daily high between the two points stayed below this line. Up to here, it is a hypothesis built from two points.
What came next is the interesting part.
- ③ Oct 2: the high of $87,220 poked 0.33% above the line ($86,932), but the candle closed below the line.
- ④ Oct 5: the high of $86,999 poked 0.22% above the line ($86,806), and again the close was below the line.
From Sep 21 through Oct 24, not a single daily candle closed above the line. Even the closest close, on Oct 4, was 0.37% below the line. In other words, all three bounce highs in September and October (9/21, 10/2, 10/5) stopped near this line. As of the last daily candle (Oct 23), the line sits at $86,048.
Wicks went through twice, yet the line still counts as resistance because the verdict is made on the close. This is only the record through Oct 24; it does not mean the line will keep holding.
6. Lines Do Break
Every trendline breaks eventually. In this series, a close 0.4% or more beyond the line counts as a breakout (or a breakdown). When only the wick goes through, as in the BTC example above, the verdict is put on hold.
A false breakout — a close outside the line that soon comes back inside — is also common, so I also check the retest: whether price comes back to the broken line and the line now plays the opposite role. Part 3 covers using that spot for entries and stops, Part 4 covers real breakout-and-retest cases, and Part 5 covers how to filter out false breakouts.
Key Takeaways
- A trendline is a line connecting two or more confirmed swing lows (uptrend) or two or more swing highs (downtrend) — in other words, support and resistance on a slope.
- Two points are a hypothesis; the line is confirmed at the third touch. A touch counts when it comes within 0.4–0.6% of the line.
- Channel = trendline + a parallel line through the opposite extreme. Read where price sits using the upper line, midline (0.5) and lower line.
- Lines work because many people watch the same line and place orders around it. The slope is the speed of the trend.
- Judge breakouts and breakdowns on the close. When only the wick goes through, hold off.
Redrawing and rechecking these lines every day, for every market and every timeframe, takes a lot of work. The Omnisight Report organizes this process for each market.
In Part 2, we'll cover choosing anchor points, the conditions for a valid line, and the step-by-step order for drawing a channel divided into quarters.
This lesson adapts the text, figures and live-stream quotes of the Trader Steve TA series for the web, translated from the original Korean. Check the text and figure captions for the timing and interpretation of each real example, and read conceptual diagrams and real charts separately.
Corrections: support@omnisight.report