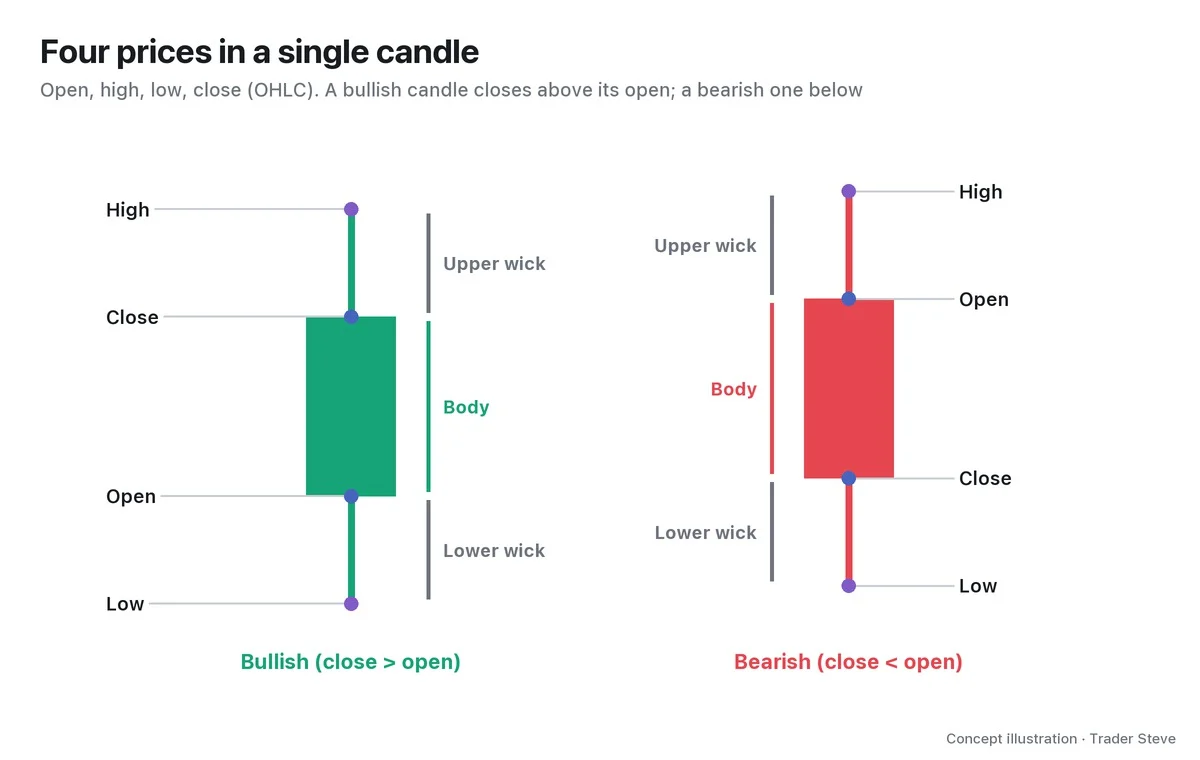
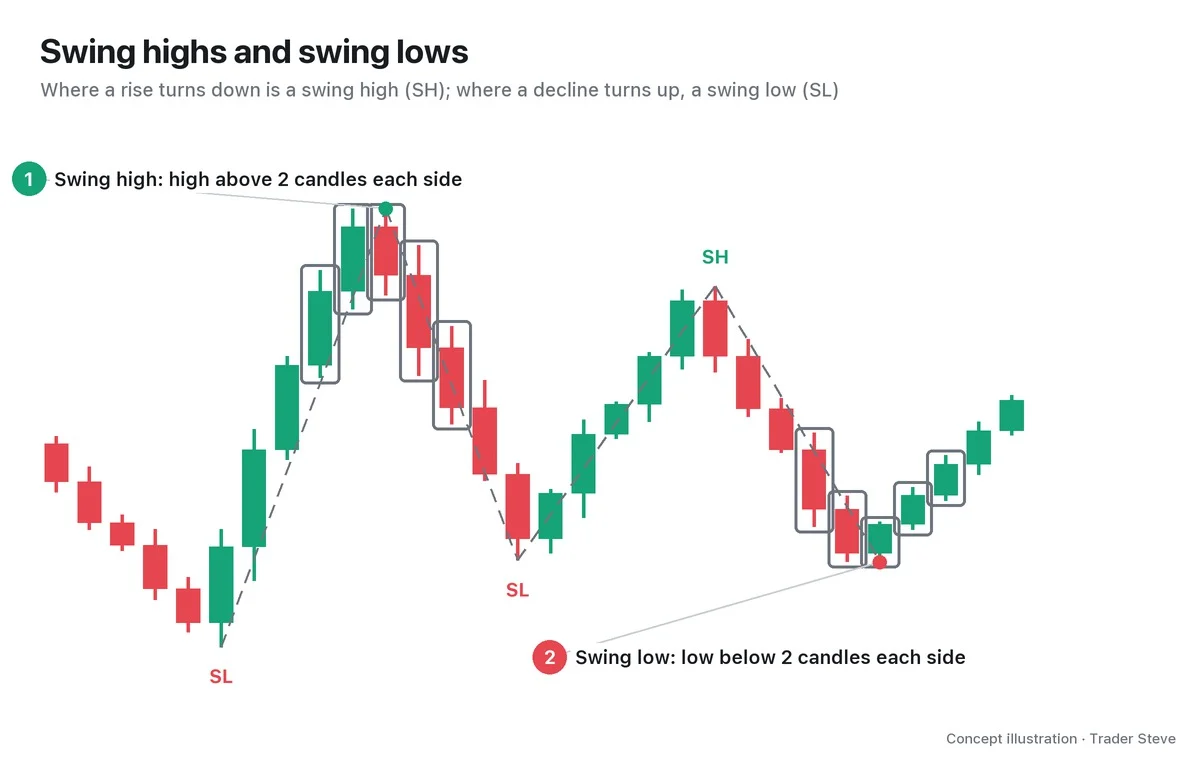
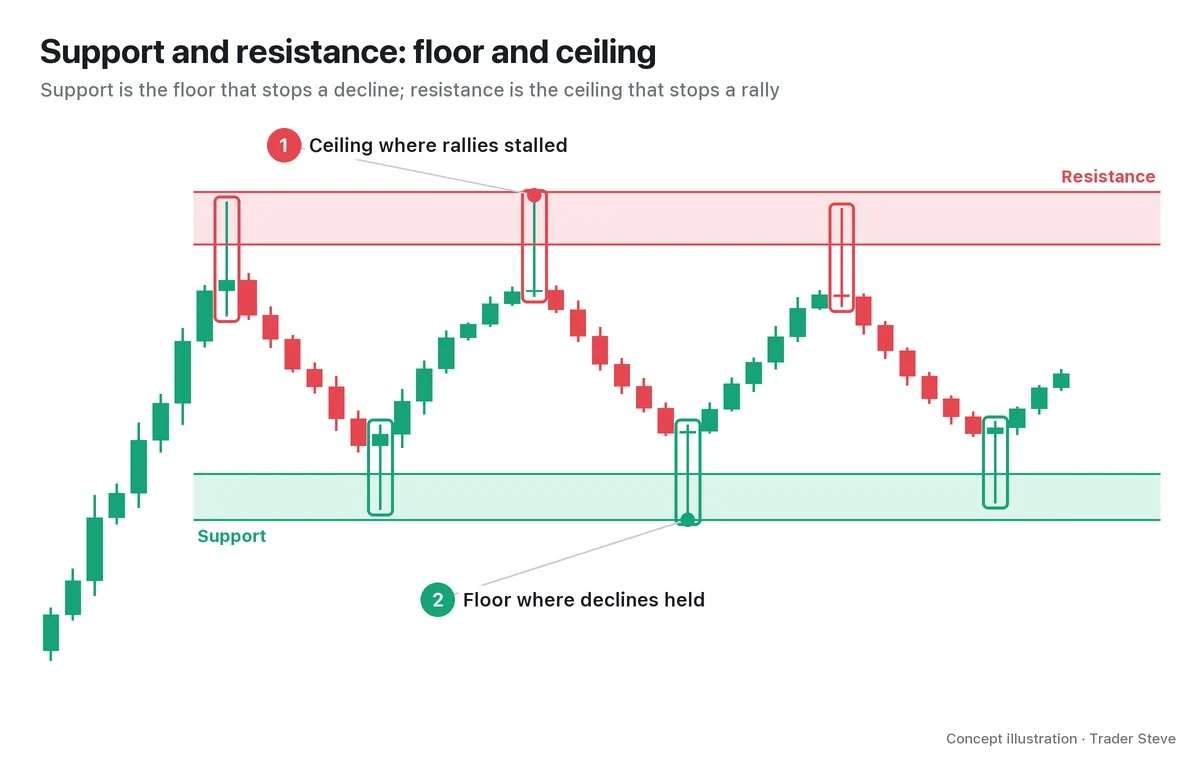
What Is Volume in Trading? What It Means and How to Read It on a Chart
Historical examples for learning · not current prices or trade recommendations.
Contents
At the bottom of almost every chart sits a row of bars. Most traders look only at the candles and skip past them, but those bars carry information the candles don't. This lesson uses diagrams and a real Bitcoin (BTC) chart to cover exactly what volume counts, how to read the height and color of each bar, and why you should read volume alongside price.
All dates and times are Korea Standard Time (KST, UTC+9). A daily candle is dated by its 09:00 KST open, a weekly candle by its Monday 09:00 KST open, and intraday times are the open time of the candle shown.
1. The One-Line Definition: The Amount Filled During One Candle
Volume is the amount actually filled during one candle (a fixed slice of time). On a 1-hour chart, it's what traded in that hour; on a daily chart, what traded that day.
On a Bitcoin chart, the unit is the number of BTC. If a Binance BTC/USDT 1-hour candle shows a volume of 500, then 500 BTC changed hands during that hour. On a stock chart, the unit is the number of shares.
Multiply volume by price and you get turnover. The same 100 BTC represents a different amount of money at $60,000 than at $80,000, so when you compare long stretches of time, check turnover as well. Part 5 comes back to this difference.
In short, the candle shows where price went; volume shows how much participation was behind that move.
2. One Unit of Volume = One Unit Bought and One Unit Sold
The most common misreading for newcomers is "volume went up because lots of people were buying." But a fill happens only when a buyer and a seller meet at the same price. If 1 BTC traded, someone bought 1 BTC and, at the same moment, someone else sold 1 BTC.
So high volume does not mean "there was a lot of buying." It means "both sides exchanged that much." No matter how many buy orders pile up, if nobody sells to them, volume doesn't rise — price just skips ahead.
"Pushing price up and buying a lot doesn't make volume explode by itself. You only get volume when a lot gets sold into that buying." — Trader Steve, live stream, Aug 25, 2026 (translated from Korean) · ▶ Watch the stream highlights (Korean audio)
That comment came while looking at the stretch where Bitcoin was moving above $80,000. If volume surged as price rose, it also means someone up there sold that much. Keep in mind that the same bar supports two readings: "buyers are strong" and "someone handed off their size."
3. How to Read the Bars Under the Candles
You only need to look at three things in a volume bar.
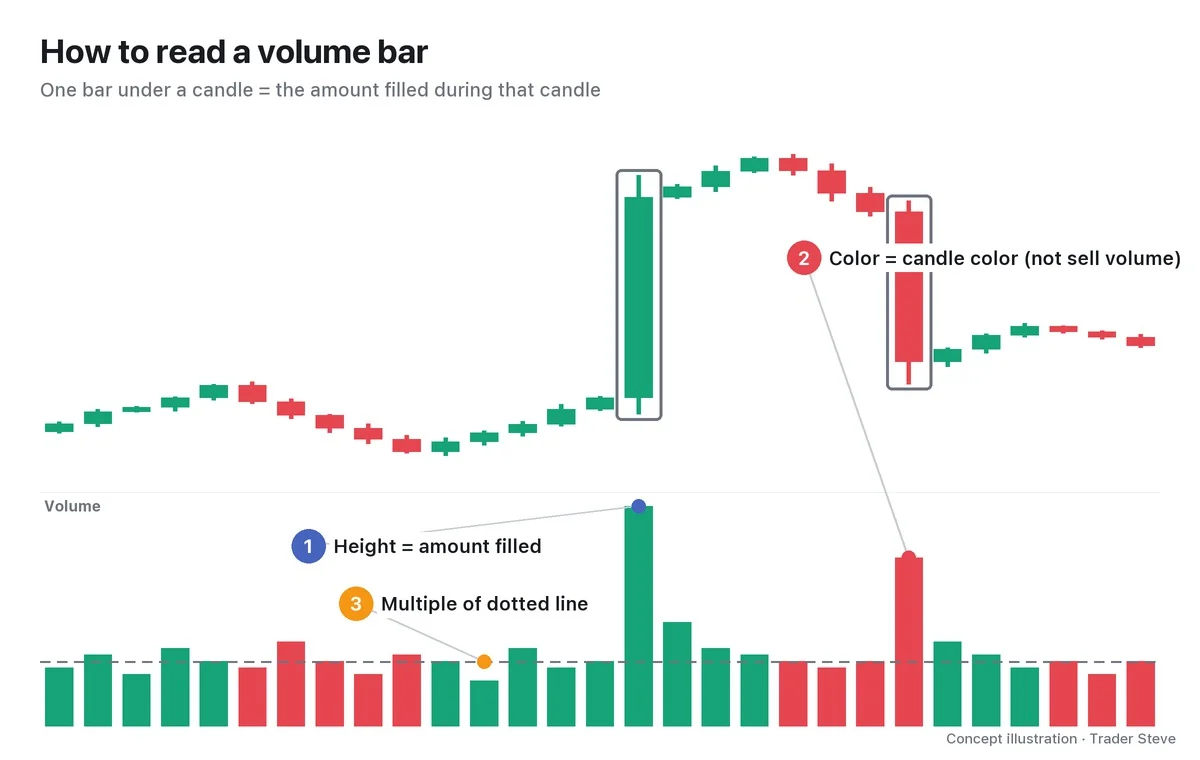
- Height: the amount filled during that candle. The taller the bar, the more traded in that candle.
- Color: most charting platforms color the bar green if the candle is bullish and red if it is bearish. In other words, a green bar is not buy volume and a red bar is not sell volume. As you just saw, every fill contains both a buy and a sell. The bar's color tells you only whether that candle closed above its open.
- Relative to usual: a single bar's number can't tell you whether it's a lot or a little. You need to compare it with the recent average (the dotted line in the diagram) and see how many times larger it is. How to set that average and calculate the multiple is covered in detail in Part 2, under relative volume (RVOL).
Reading candle bodies and wicks is covered separately in the Basics Candlesticks topic.
4. Why It Matters: The Weight of a Move
Two candles with the same shape can carry very different amounts of participation.
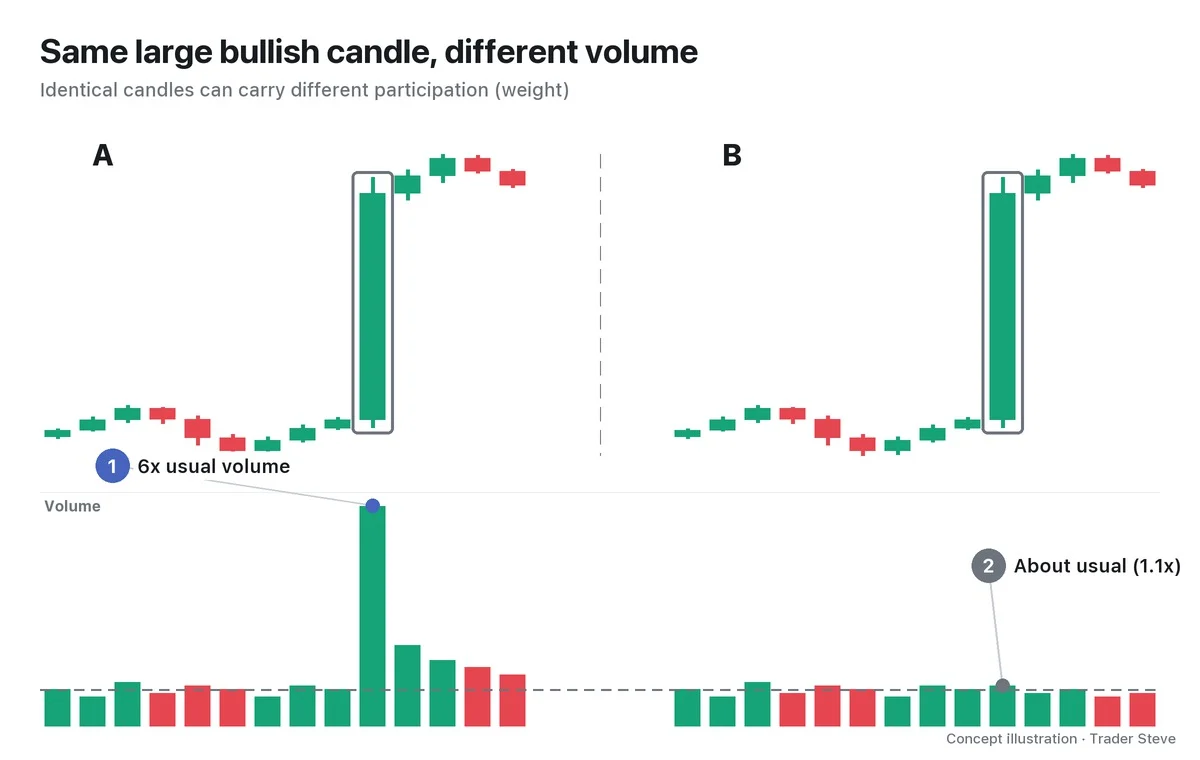
A is a move built by many people trading with each other; B is a move made on thin participation. From the candles alone, you can't tell them apart. Volume doesn't tell you direction, but it does tell you how heavy the move is. Wyckoff theory frames this as volume = effort and price change = result, and compares the two; that continues in the Wyckoff Effort vs. Result topic.
"Just seeing that red is a bearish candle and green is a bullish candle — 'wow, the trend really exploded' — that's not chart analysis. Along the way you obviously have to look at volume too. Whether volume really exploded at the swing low point or not." — Trader Steve, live stream, Aug 20, 2026 (translated from Korean) · ▶ Watch the stream highlights (Korean audio)
So when does volume get heavy? Generally it's light in quiet stretches and piles in when price moves hard in one direction.
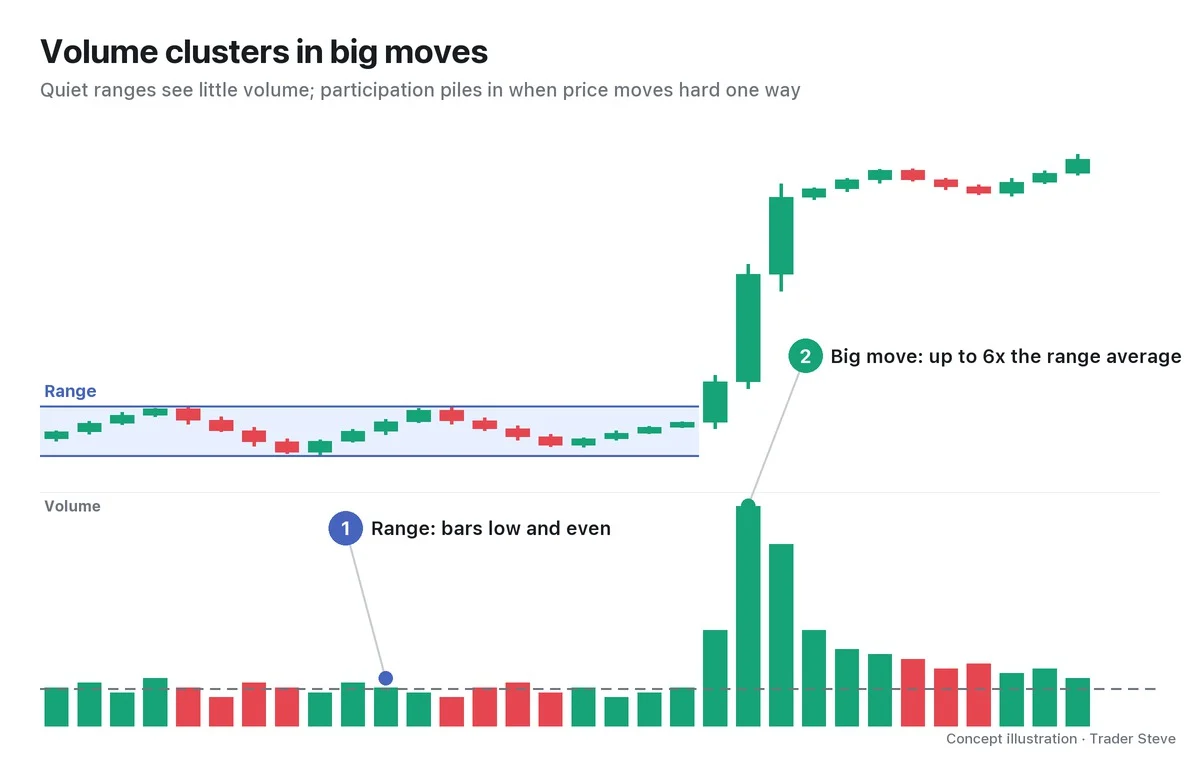
That's why a candle with a volume surge is worth marking as "a place where many people actually exchanged money at that price." But this is only a tendency. A volume surge doesn't guarantee the move will continue, and Parts 4 and 5 look at counterexamples too.
5. Real BTC: The Hour Volume Exploded
Let's check this on a real Bitcoin chart.
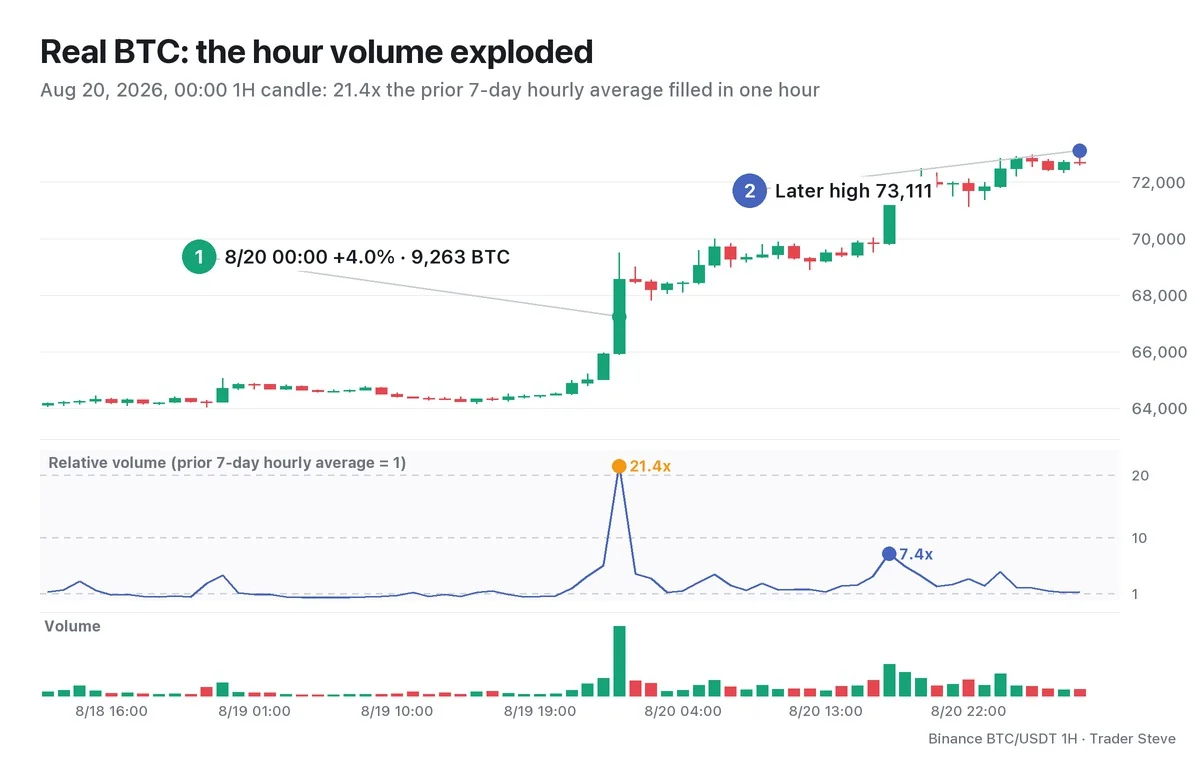
From midday on Aug 18 to the evening of Aug 19, Bitcoin moved in a narrow range, and relative volume averaged around 1.0x. Then the Aug 20 00:00 candle changed the picture.
- Open 65,923 → high 69,500 → close 68,554, +4.0% in one hour
- Volume 9,263 BTC: 21.4x the prior 7-day hourly average (432 BTC)
- In turnover, about $640 million (approximated as volume × close)
That's more than 20 hours' worth of normal trading filled in a single hour. The 23:00 candle just before it (2,366 BTC, 5.6x) and the 01:00 candle just after (2,014 BTC, 4.2x) were also above normal, but next to the 00:00 candle the difference is obvious. The 17:00 candle the same day traded heavily again at 4,174 BTC (7.4x), and by 05:00 on Aug 21, where the chart ends, price had risen to 73,111.
On the next day's live stream, I looked back at this moment like this:
"It was going up two thousand dollars a second. (…) A huge burst of trading went off — so big that the bots couldn't keep up with how fast trades were actually being filled. Right here." — Trader Steve, live stream, Aug 21, 2026 (translated from Korean) · ▶ Watch the stream highlights (Korean audio)
What I was looking at then was the Binance futures chart (high around $70,400); the chart in this lesson is Binance spot (high 69,500). Part 5 also covers how price and volume differ slightly from one market to another.
What you should read here isn't "so it went up." It's the fact that this price area drew more than 20x the usual participation. A candle like this becomes a reference point for watching how price reacts when it comes back later.
Key Takeaways
- Volume is the amount filled during one candle. On a Bitcoin chart, it's the number of BTC.
- Every fill has two sides. One unit of volume = one unit bought and one unit sold.
- The bar color is just the candle color; a green bar is not buy volume.
- How many times the usual level matters more than any single number.
- Volume tells you the weight of a move, not its direction.
In Part 2, we'll cover how to calculate an average line and relative volume (RVOL), plus four patterns for reading price and volume together.
If calculating volume against its usual level and marking every volume surge by hand for each market gets tedious, the Omnisight Report below organizes that process market by market.
This lesson adapts the text, figures and live-stream quotes of the Trader Steve TA series for the web, translated from the original Korean. Check the text and figure captions for the timing and interpretation of each real example, and read conceptual diagrams and real charts separately.
Corrections: support@omnisight.report