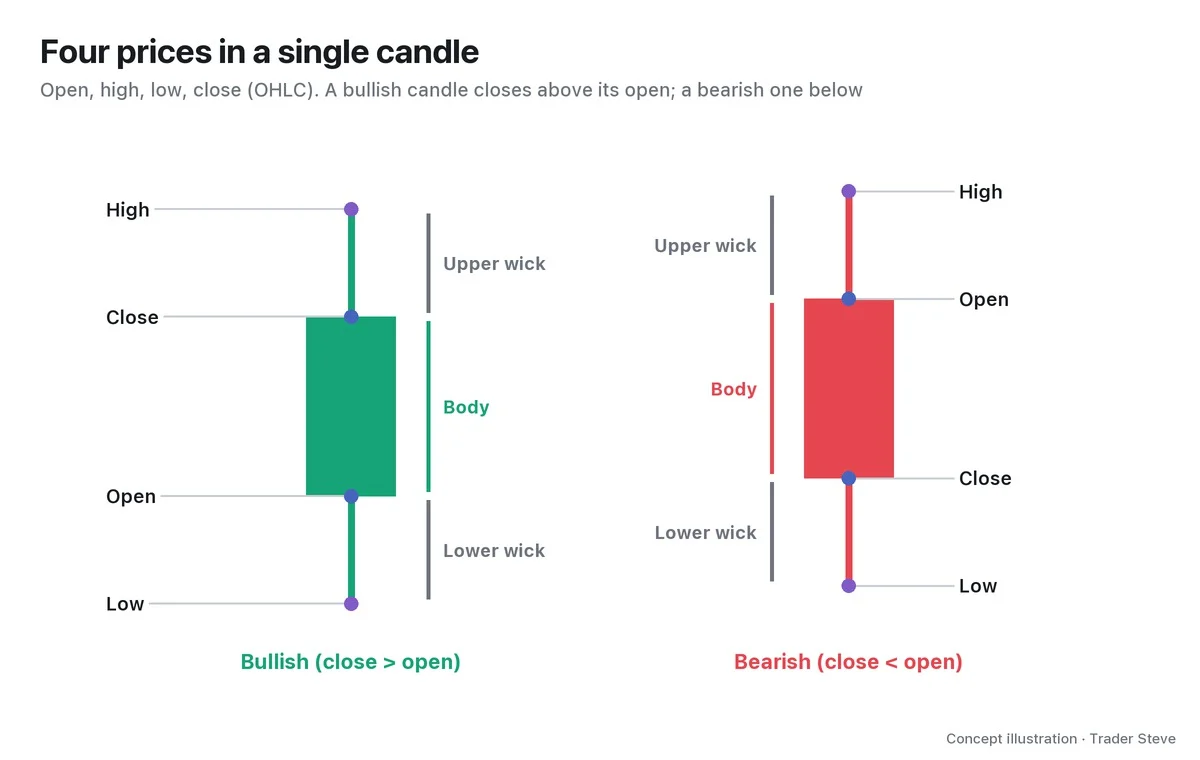
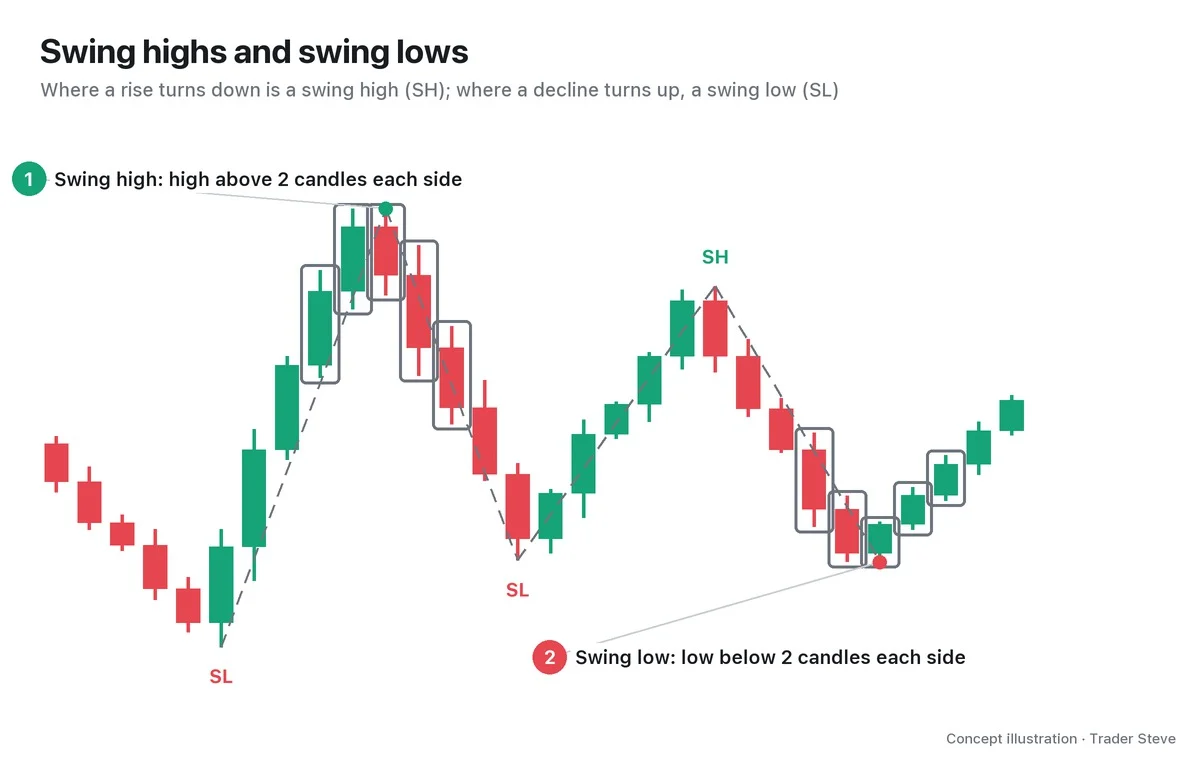
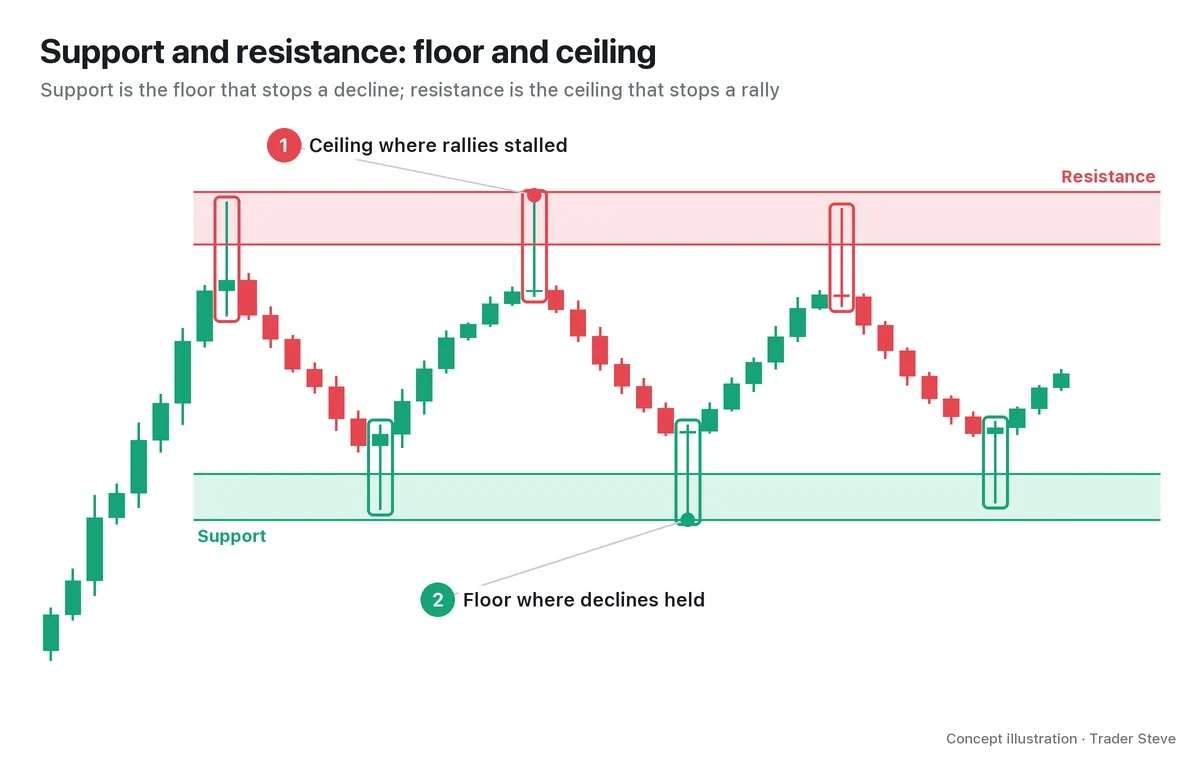
What Is a Volume Profile? Volume by Price and the Point of Control
Historical examples for learning · not current prices or trade recommendations.
Contents
The volume bars under a chart show when a lot of trading happened. When you're looking for support and resistance, the more useful question is at what price a lot of trading happened — and the tool that answers it is the volume profile (VP). This lesson uses charts to explain what a volume profile is and what five terms point to: the point of control (POC), the value area high and low (VAH/VAL), and high- and low-volume nodes (HVN/LVN).
All dates and times are Korea Standard Time (KST, UTC+9). A daily candle is dated by its 09:00 KST open, a weekly candle by its Monday 09:00 KST open, and intraday times are the open time of the candle on the timeframe shown.
1. Turn Volume on Its Side: Volume at Price
A volume profile is a horizontal bar chart that groups the volume of a chosen period by price instead of by time. It's the same idea as the "volume-by-price chart" found in Korean home trading systems (HTS, the desktop trading platforms Korean brokers provide). When I talk about "high-volume zones" on the live stream, I mean the prices where these bars stack up long.
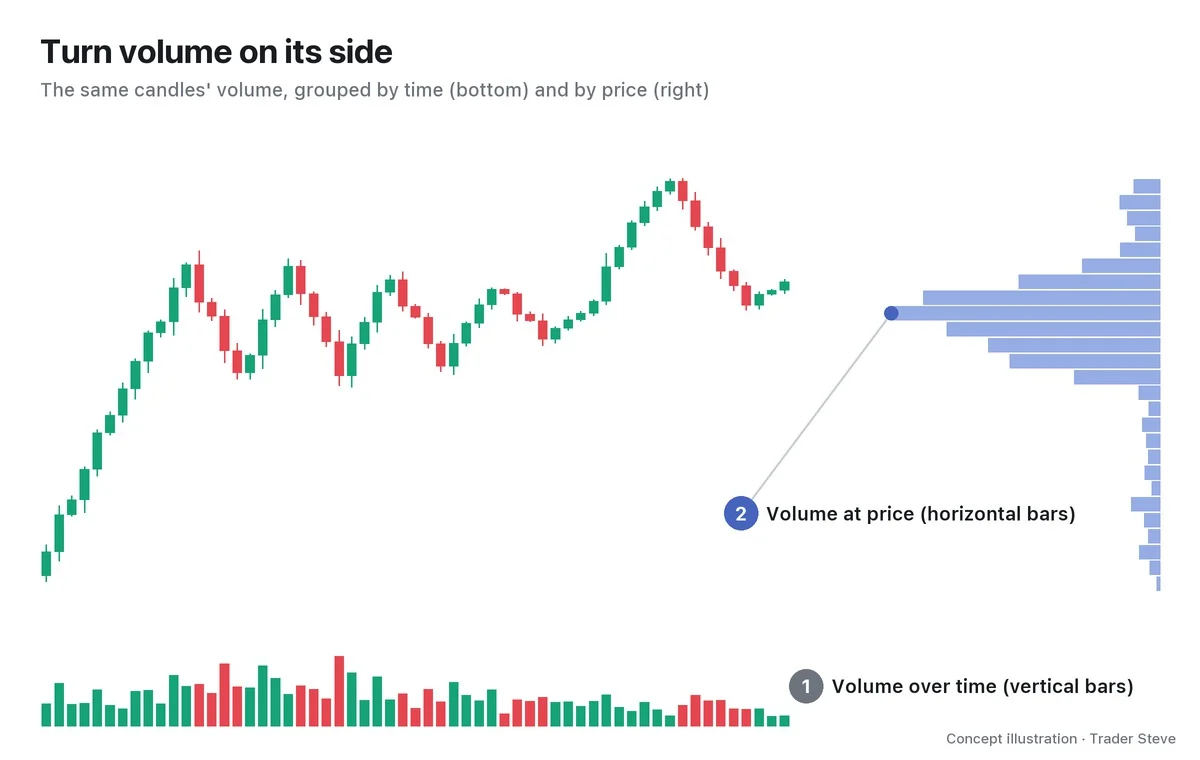
Building one is simple. Split the price axis into rows of a fixed size, then distribute each candle's volume across the rows that candle passed through. The volume that piles up in a single row is called volume at price, and drawing it as a horizontal bar for every row gives you the volume profile.
The vertical bars at the bottom are spread fairly evenly, but the horizontal bars on the right bunch up in the middle of the range where price went back and forth for a long time. The "prices where trading concentrated," invisible on the time axis, show up immediately.
"If you pull up something like a volume profile, you can see which price zone had the most trading. That's where the most trading happened — where people bought and sold a huge amount. So when price comes back down to that spot, there's a good chance people step in and buy a lot there. And if it breaks, you'll get a bungee drop (a sharp plunge)." — Trader Steve, live stream, Oct 12, 2026 (translated from Korean) · ▶ Watch the stream highlights (Korean audio)
The shape of the bars changes with the row size and the candles used for the calculation, so every image in this series states its basis, for example "1-hour volume, $250 rows."
2. POC: The Most-Traded Price
The longest row is the point of control (POC). It's the price the market bought and sold the most during that period — in other words, the price where buyers and sellers "agreed" the most.
The POC is the price row with the largest past volume in the period you selected. Volume alone can't tell you how many holders are still in or what the big players' actual average entry price is.
"You're asking why buyers step in at the center line? Because that's where the most trading happened. The POC line is the spot where trading exploded the most when you draw the profile. So the big players who pushed price up probably did the most trading there too, and there's a good chance their average entry price formed somewhere near it." — Trader Steve, live stream, Aug 20, 2026 (translated from Korean) · ▶ Watch this moment (Short, Korean audio)
"A spot close to the big players' average entry" on the live stream is an interpretation of where trading concentrated. That support or resistance may appear on a revisit is a hypothesis; it does not mean anyone has confirmed the actual holders' average entry price.
3. The Value Area (70%), VAH and VAL
The POC alone can't tell you "how wide a range the trading took place in." That's why you also look at the value area (VA). The VA is the price range around the POC that holds 70% of total volume. The 70% figure is a convention that corresponds to roughly one standard deviation in statistics.
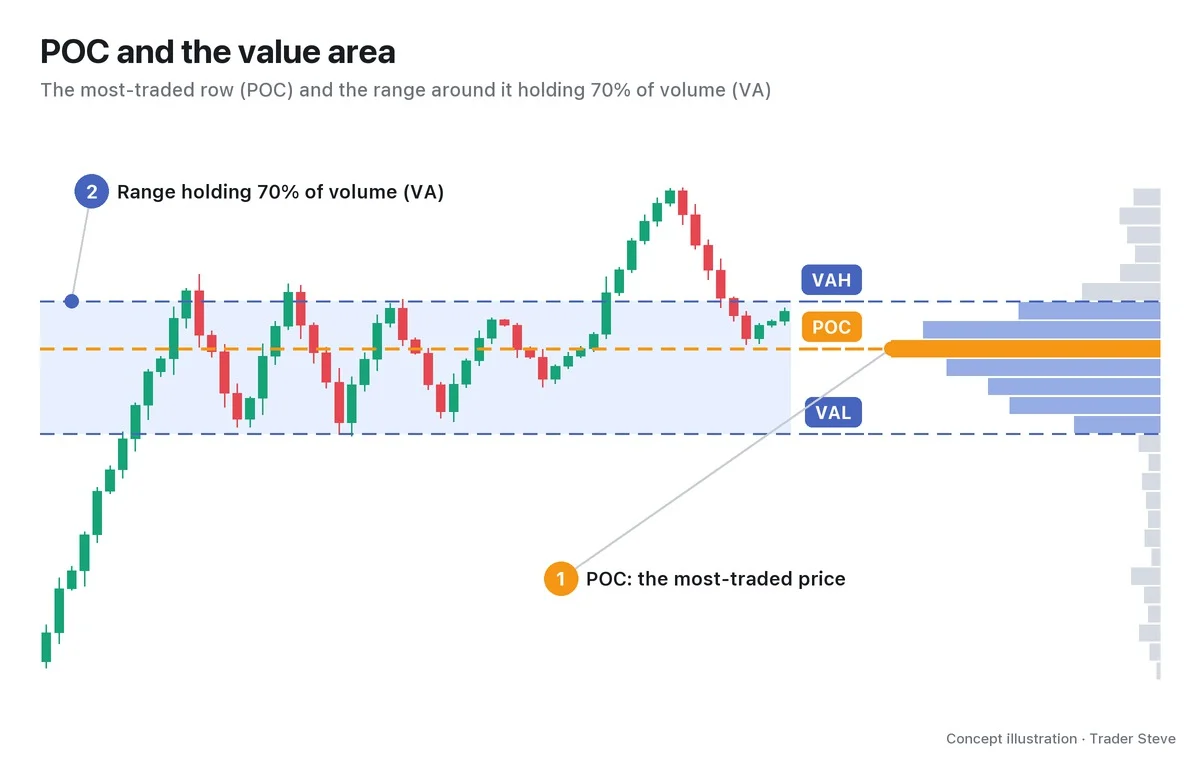
- VAH (value area high): the upper edge of the VA
- VAL (value area low): the lower edge of the VA
Inside the VA is the range the market accepted as a "fair price"; outside it are prices that were visited only briefly and didn't hold for long. Part 2 covers how the VA is calculated, and Part 3 covers how to use it when price leaves the VA and comes back in.
4. HVN and LVN: Peaks and Valleys
Stand a profile upright and you'll see peaks where the bars rise long and valleys where they sink short.
- HVN (high-volume node): a peak where trading clustered. Price stayed there a long time and a lot was bought and sold.
- LVN (low-volume node): a valley where trading was thin. Price passed through quickly and barely any volume built up.
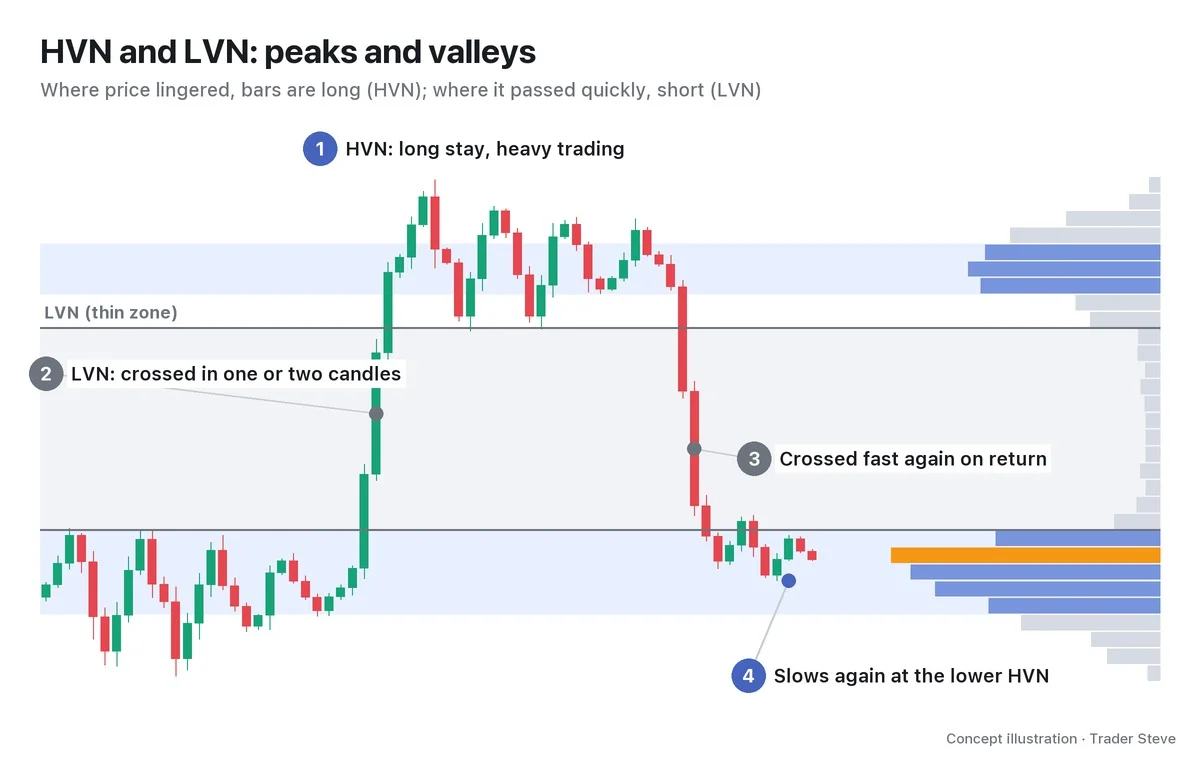
The interpretation is that at an HVN, where past trading was heavy, buyers and sellers face off again on a revisit, while at an LVN, where trading was thin, price can pass through quickly. This is not a statement about how many holders are there now, and a reaction is not guaranteed.
"There's almost no high-volume zone — just a vacuum gaping wide open below — so once price starts slipping, it isn't hard to shove it straight down. It means there isn't much size to absorb it. You need a lot of people who bought and sold in this zone and got stuck there before anyone shows up to trade alongside and absorb the selling." — Trader Steve, live stream, Oct 22, 2026 (translated from Korean) · ▶ Watch the stream highlights (Korean audio)
The "vacuum zone" I mention on the live stream is an LVN. To sum up: an HVN is where price tends to slow down and react when it returns; an LVN is where price tends to pass through quickly even when it returns. Neither is "guaranteed" — both are places where that is "more likely." HVNs break too, and once one breaks, price can race through the next LVN (Part 4).
5. Drawing It on a Real Two-Month Bitcoin Range
Now let's draw one on a real Bitcoin (BTC) chart. Over the 56 days from Jun 24 to Aug 19, 2026, Bitcoin moved between 57,800 and 66,956. Grouping that period's 1-hour volume into $250 rows gives the following.
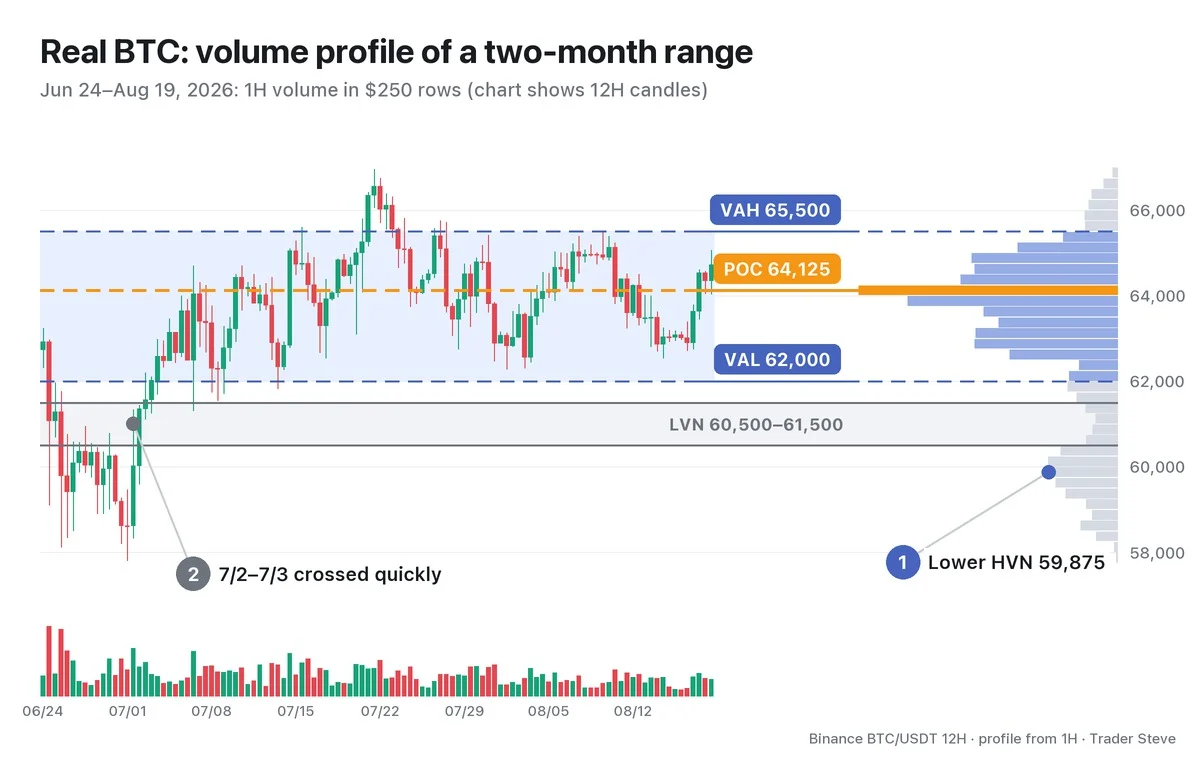
- POC 64,125: the most-traded row.
- VA 62,000–65,500: 70.1% of total volume gathered in this $3,500-wide band. On a 1-hour closing basis, price spent 1,057 of 1,344 hours (78.6%) inside it.
- Lower HVN 59,875 (①): a small peak built from Jun 25 to Jul 2, when 1-hour closes stayed below 60,500 for 156 hours. Its volume is about 27% of the POC's.
- LVN 60,500–61,500 (②): the valley between the two peaks. Even its thickest row is only 12% of the POC. Between 06:00 on Jul 2 and 13:00 on Jul 3, 1-hour closes sat inside this zone for just 14 hours, and then price went straight up into the VA. After that, through Aug 19, no 1-hour close came back down into this zone (on Jul 6, a wick to 61,307 only just touched its upper edge).
The idea that price lingers at peaks and passes through valleys quickly shows up on a real chart too. But this is only a summary of what already happened; it does not tell you which way price will go next. Use it as a map, marked in advance, of what reaction to watch for when price comes back to each level.
Key Takeaways
- A volume profile is a horizontal bar chart that groups a period's volume by price; it's the same as the volume-by-price chart in Korean trading platforms.
- The POC is the most-traded price, read as a spot close to the big players' average entry.
- The VA is the range holding 70% of volume, and its upper and lower edges are the VAH and VAL.
- At an HVN (peak), price tends to slow down when it returns; through an LVN (valley), it tends to pass quickly.
Related lessons: how to read volume itself is covered in Basics Volume (related lesson), and why high-volume zones turn into support and resistance in Basics Support and Resistance (related lesson).
In Part 2, we'll cover where to start and end a profile (session, fixed range, anchored) and how to read shapes such as the bell, P, b and double distribution.
If setting a range and marking high-volume zones for every market feels like a chore, the Omnisight Report lays out the structure for each market for you.
This lesson adapts the text, figures and live-stream quotes of the Trader Steve TA series for the web, translated from the original Korean. Check the text and figure captions for the timing and interpretation of each real example, and read conceptual diagrams and real charts separately.
Corrections: support@omnisight.report