What Is Divergence in Trading? Why Price and Indicators Move Apart
Historical examples for learning · not current prices or trade recommendations.
Contents
This lesson uses charts to show what is going on when price and an indicator move in opposite directions. Divergence is one of the words I use most on the live stream. Yet many traders hear "divergence has formed" and take it to mean "it's about to turn." This lesson covers exactly what divergence is, why it forms, and what it does — and does not — tell you.
All dates and times are Korea Standard Time (KST, UTC+9). A daily candle is dated by its 09:00 KST open, and intraday examples are timed by the open of the KST candle.
1. The One-Line Definition: Price and Strength Split Apart
Divergence means exactly what the word says: a splitting apart. On a chart, it is when price makes a new high (or a new low), but the indicator that measures the strength of that move doesn't follow. The opposite — price and the indicator moving together in the same direction — is called convergence.
The "indicator" here is usually an oscillator, also called a momentum indicator. The Relative Strength Index (RSI) and the stochastic oscillator express the strength of a move, calculated from price, on a 0–100 scale; Moving Average Convergence Divergence (MACD) has no upper or lower limit and moves around a 0 line. If any of these indicators is new to you, read Basics Oscillators Part 1 first and this lesson will be much easier to follow.
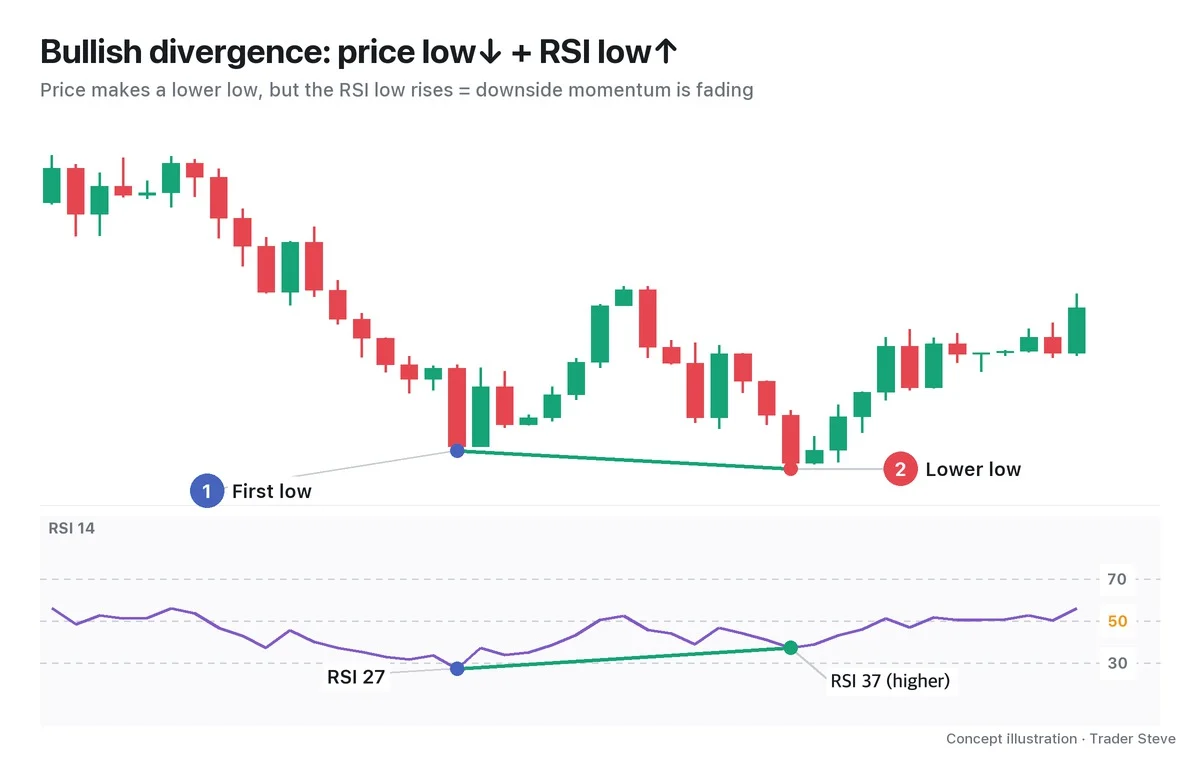
"Bullish divergence is when price is moving like this, but RSI, down below, is actually going up like this. Price is going down, but the share of people buying is growing. (…) What is divergence? What does the word mean? It means this one and this one are different. When price and the indicator that shows the actual trend of buying move differently, that's called divergence. And bearish divergence? The highs in price are going up, but the highs in RSI buying pressure are going down." — Trader Steve, live stream, Oct 14, 2026 (translated from Korean) · ▶ Watch the stream highlights (Korean audio)
2. An Oscillator Is Price's Speedometer: Why the Two Split
Price and an oscillator can split apart because they measure different things. Price shows where it is now (position); an oscillator shows how hard it is moving (speed).
Think of driving a car up a hill. The car keeps climbing until it reaches the top. But the speedometer starts falling before the car gets there. Position is still rising while speed is already dropping — that is the principle behind divergence.
Let's make it concrete with RSI. The Relative Strength Index compares the average size of the up moves with the average size of the down moves over the last 14 candles and expresses the result on a 0–100 scale. The key point is that RSI doesn't ask "is price above the previous high?" What RSI asks is "how hard has price risen over the last 14 candles?"
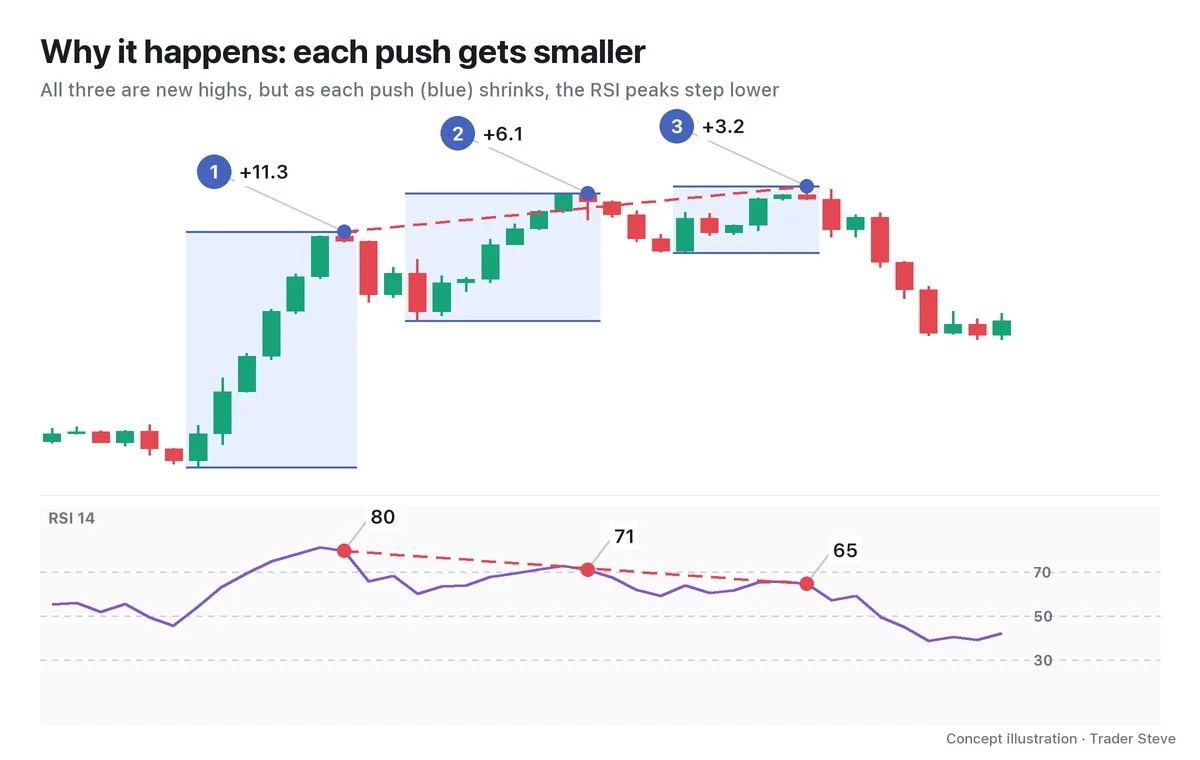
The three waves in the chart rose over similar spans of time (5–7 candles), and each one cleared the previous high. Looking at price alone, it's "new highs, again and again." But the size of each push shrank from 11.3 → 6.1 → 3.2, roughly halving every time. As the average up move gets smaller, the RSI peaks step lower too: 80 → 71 → 65. New records, but less and less momentum behind each new record — that is how bearish divergence forms. The downside works the same way: if each push to a new low is smaller, the RSI troughs actually rise.
3. Bearish Divergence and Bullish Divergence
Divergence is split into two kinds by direction.
| Type | Price | Indicator | Connect | Meaning |
|---|---|---|---|---|
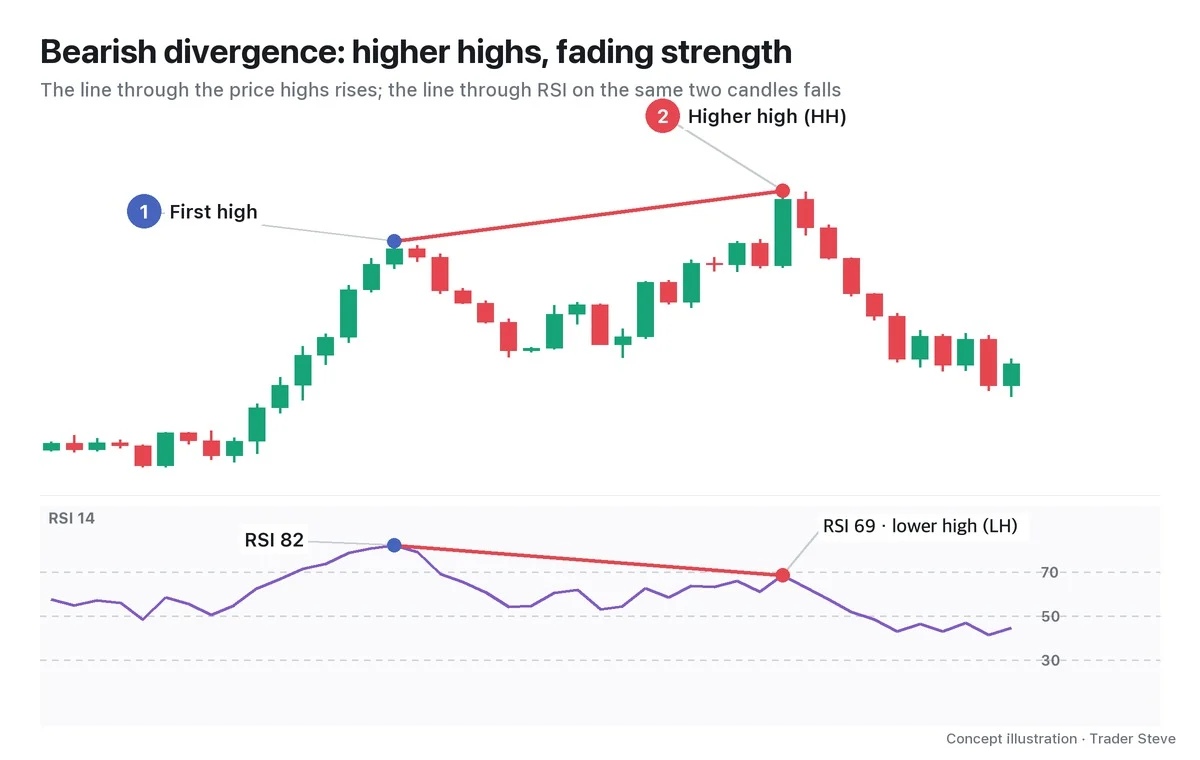
| Bearish divergence | higher high (HH) | lower high (LH) | high to high | upside momentum is fading |
| Bullish divergence | lower low (LL) | higher low (HL) | low to low | the downward pressure is fading |
On the indicator side, always use the value on the same candle as the price high or low. On price, you connect high 1 and high 2; on the indicator, you connect the values on exactly those two candles. Figure 1 above shows the bearish divergence shape.
"For example, price keeps going up. Right? But the share of people taking on buys is shrinking. That's what people call divergence forming." — Trader Steve, live stream, Sep 21, 2026 (translated from Korean) · ▶ Watch the stream highlights (Korean audio)
Bullish divergence is its mirror image.
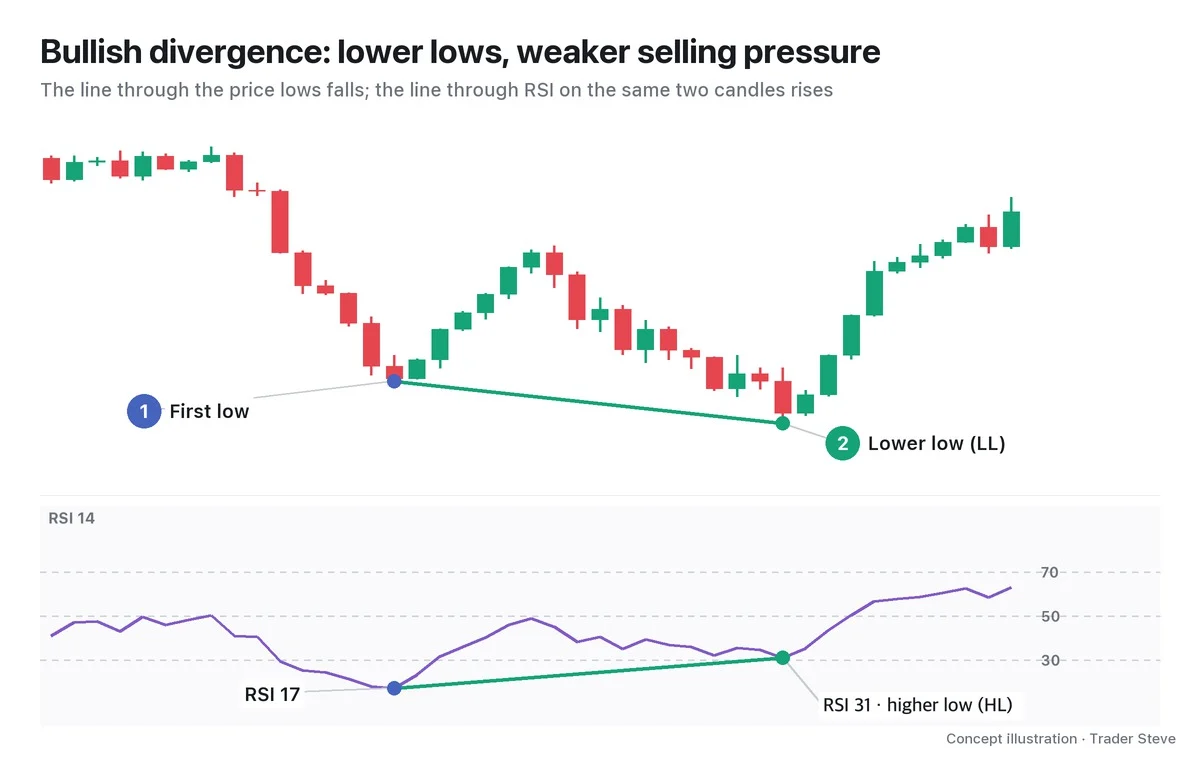
"Price went lower. The selling pressure got weaker. What's that? RSI went up and price went down. It's forming what you'd call a textbook bullish divergence structure. But not every indicator is giving the same view as this one, so I'd treat it as something to keep in mind, more or less." — Trader Steve, live stream, Aug 22, 2026 (translated from Korean) · ▶ Watch the stream highlights (Korean audio)
Beyond these, there is hidden divergence, which appears while a trend continues, and exaggerated divergence, which appears at double tops and double bottoms. Part 2 puts all 4 types on one page.
4. On a Real BTC Daily Chart
Let's check it on a real Bitcoin (BTC) chart.
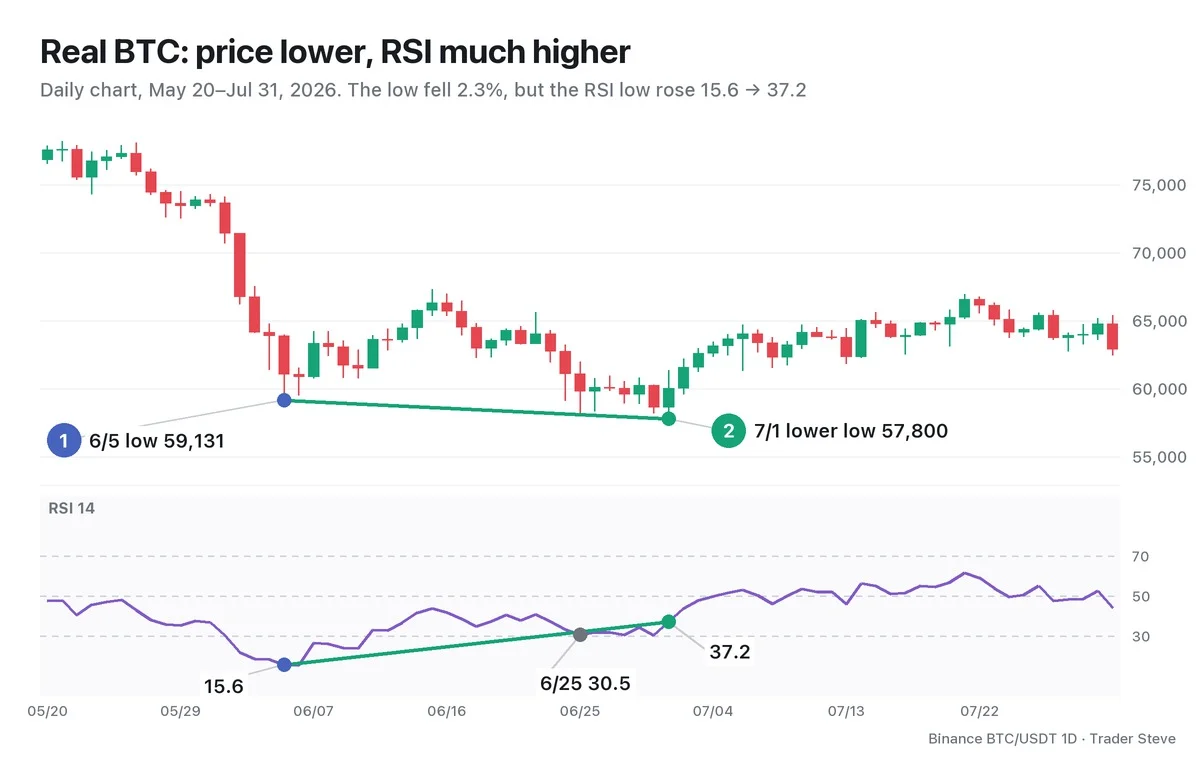
The early-June drop was violent enough to push daily RSI down to 15.6. The Jun 5 low was 59,130.91. After a bounce, price came back down on Jul 1 to a low of 57,800.19, 2.3% lower, yet RSI that day was 37.2, a full 21.6 points higher. Price made a new low, but the selling pressure that made that low was far weaker than in early June. The low in between, on Jun 25 (58,115.01), also had a higher RSI than Jun 5, at 30.5. Three lows in a row like this are covered separately in the Divergence Multiple topic (double and triple divergence).
After that, daily RSI closed above 50 on Jul 5, and price rose to a high of 66,956 on Jul 21 (+15.8% from the Jul 1 low). That is only a record of how this one case played out; it doesn't mean things always go this way when divergence appears.
5. What Divergence Tells You, and What It Doesn't
"I think divergence is pretty much the only way we can confirm, as a fact, a real turning point in a trend." — Trader Steve, live stream, Sep 2, 2026 (translated from Korean) · ▶ Watch the stream highlights (Korean audio)
I give divergence so much weight because it lets you confirm that a trend is weakening with a number from outside price itself. But you need to separate what you can confirm from what you can't know.
- What it tells you: a warning that the momentum behind the current direction is fading. In a rally, upside momentum is shrinking; in a decline, the downward pressure is shrinking.
- What it doesn't tell you: when, or where, price will turn. Price can run a long way further with that momentum gone, and it is common for price to print a few more new highs while divergence is in place.
That is why divergence is a warning light, not a confirmed reversal signal. In actual trading, after you spot divergence you wait for a structure shift, such as a break of the prior swing, and you put your stop-loss where the divergence would be invalidated (beyond the second high or low). Part 3 covers this sequence in detail. Also, the second high or low is only confirmed after a few more candles have passed and closed, so it matters not to decide "divergence has formed" from a candle that is still in progress.
By default, this series' comparison tables and statistics use the indicator value on the same candle as the confirmed price swing. Connecting the indicator's extreme within a few candles of the swing (±2 candles for RSI, ±3 for MACD) is kept separate as the 'nearby-extreme variant', and when it's used, both the price time and the indicator time are stated. Part 2 covers which points to connect in detail.
Key Takeaways
- Divergence is when price makes a new record but the indicator (strength) doesn't follow.
- An oscillator is price's speedometer. When each push up (or down) gets smaller, the indicator turns before price does.
- Bearish divergence connects high to high (price HH + indicator LH); bullish divergence connects low to low (price LL + indicator HL); the indicator uses the values on the same two candles.
- Divergence is only a warning that strength is fading; it doesn't tell you when or where price will turn.
In Part 2, we'll cover which points to connect on a chart, the 4 types of divergence, and which indicators to read them with.
If finding divergence by hand across multiple timeframes and indicators feels tedious, the Omnisight Report lays it out for each market, together with the structure.
This lesson adapts the text, figures and live-stream quotes of the Trader Steve TA series for the web, translated from the original Korean. Check the text and figure captions for the timing and interpretation of each real example, and read conceptual diagrams and real charts separately.
Corrections: support@omnisight.report