What Is CVD? Cumulative Volume Delta and How CVD Divergence Works
Historical examples for learning · not current prices or trade recommendations.
Contents
Indicators like the Relative Strength Index (RSI) and Moving Average Convergence Divergence (MACD) look at how far price moved and estimate buying and selling pressure from that. In crypto futures, though, you can count "who actually bought first and who sold first" directly from trade data. Connect those counts into a single line and you get cumulative volume delta (CVD). This lesson explains how CVD is built and what a CVD divergence tells you.
All dates and times are Korea Standard Time (KST, UTC+9). A daily candle is dated by its 09:00 KST open. Intraday examples are identified by the KST open time of the candle.
1R is the distance from entry to stop, and a reward of nR is the distance to the target divided by 1R.
1. Taker Orders Consume the Order Book
Exchange orders fall into two broad types.
- Limit order: an order you post on the order book — "I'll buy/sell at this price" — and leave waiting
- Market order: an order that fills immediately by taking the orders already resting on the book
Every fill needs two orders to meet. The side that consumes resting orders to fill immediately is the taker; the side that supplied liquidity to the book is the maker. Not only market orders count as takers: an aggressive limit order that fills instantly against the opposite side of the book is a taker, too. CVD tallies the aggressive direction of each fill rather than the order type. From here on, "market buys" and "market sells" also include aggressive limit orders that fill immediately in the same direction. Exchange fees are split along these same two lines.
"This is maker and taker — when we throw an order in at market, we're the taker, right?" — Trader Steve, live stream, Aug 27, 2026 (translated from Korean) · ▶ Watch the stream highlights (Korean audio)
Price moves when takers eat through the book. When market buys take out all the resting sell orders, price rises; when market sells take out all the resting buy orders, price falls. That's why the taker is also called the aggressor. CVD counts exactly this: the direction of aggressive orders.
2. One Candle's Delta = Taker Buys Minus Taker Sells
Within a single candle, the quantity takers bought at market minus the quantity takers sold at market is the volume delta (Δ).
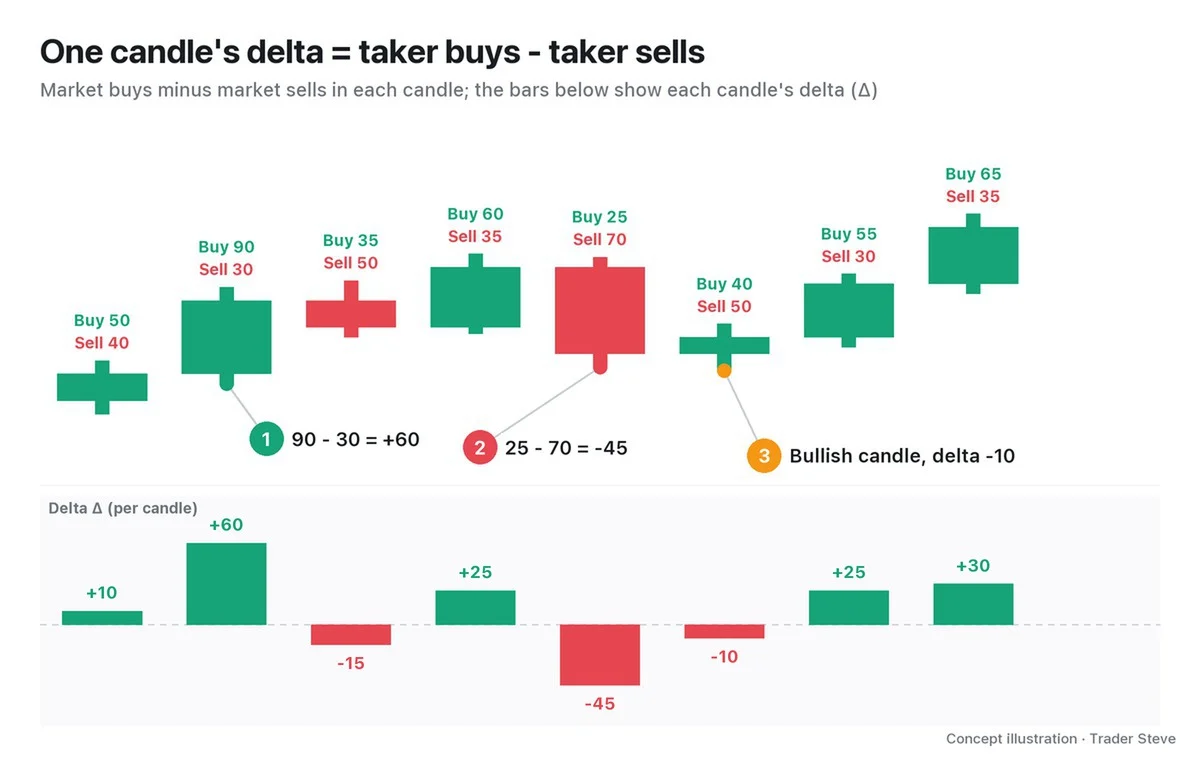
- ① The second candle has 90 in market buys and 30 in market sells, so its delta is +60. Aggressive buying dominated this candle.
- ② The fifth candle has 25 in buys and 70 in sells, so its delta is -45. Aggressive selling dragged price down.
- ③ The sixth candle is bullish, yet its delta is -10. There were more market sells, but price still rose, which you can read as someone absorbing that selling with limit buy orders. Candle color alone can't tell you this.
Binance candle data includes each candle's taker buy volume (tb). Volume (v) is the sum of taker buys and taker sells, so delta works out to Δ = 2 × taker buy volume - volume. Every real chart in this lesson was calculated with this formula.
3. Stack the Deltas and You Get CVD (One Line Away From OBV)
Add the deltas one after another, starting from the first candle, and you get CVD. The unit is a number of Bitcoin (BTC) (or of Ethereum (ETH), for Ethereum).
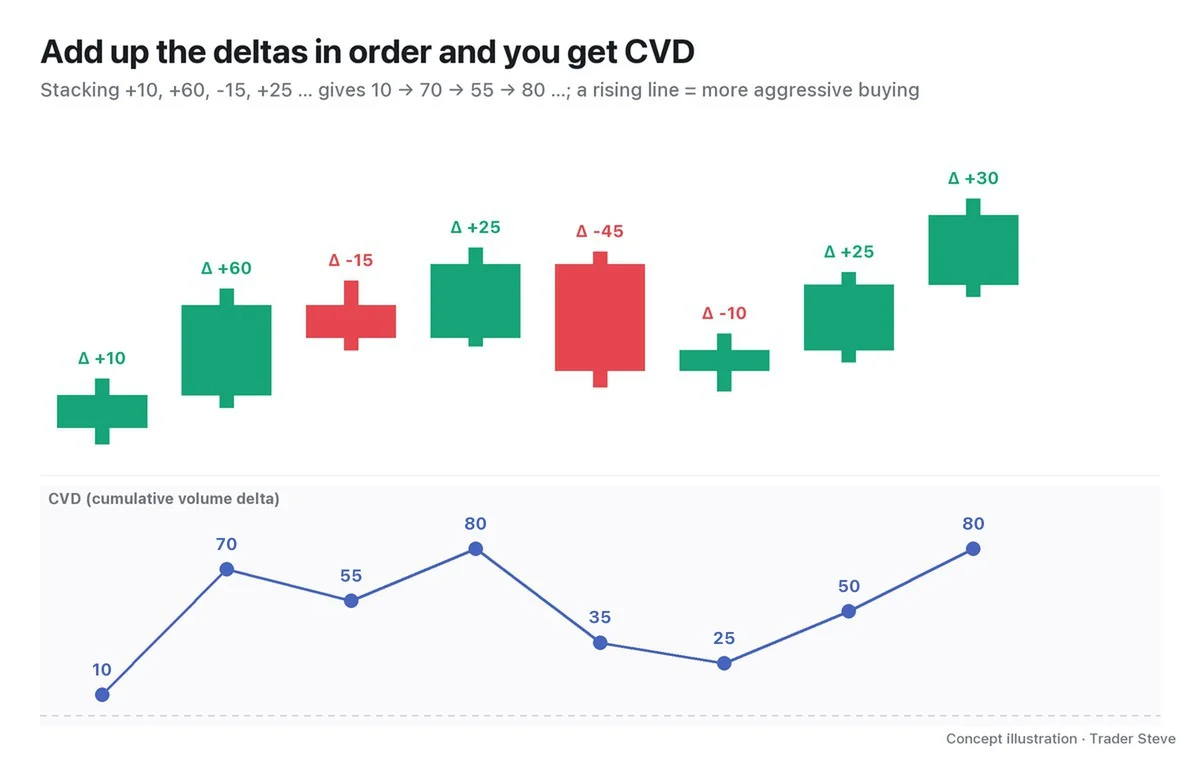
Where the CVD line rises, more was bought at market; where it falls, more was sold at market. The height of CVD itself depends on where you started adding, so look at the direction and the difference between two points rather than the size of the number. Part 2 covers this in detail.
On-balance volume (OBV), another cumulative volume indicator, differs by one line of logic. OBV adds all of a candle's volume when the close rises (see Divergence OBV and Volume, divergence/obv-volume). On the sixth candle in the chart above, OBV adds the full 90 of volume, while CVD adds -10. OBV splits volume by "which way the candle closed"; CVD splits it by "who pushed in first."
4. CVD Divergence: When Price and Aggressive Orders Disagree
A divergence is when price and an indicator point in different directions (see Divergence Basics, divergence/basics). On the live stream, I explained how price works like this:
"Stocks, crypto, real estate — the structure is exactly the same. When money comes in and there are more buyers than sellers, price goes up. When there are more sellers than buyers, price goes down. We have to understand this very simple truth." — Trader Steve, live stream, Oct 19, 2026 (translated from Korean) · ▶ Watch the stream highlights (Korean audio)
CVD counts only the side that pushed in first at market. So when price and CVD disagree, it signals that aggressive orders are losing steam, or that limit orders on the other side are absorbing that aggression.
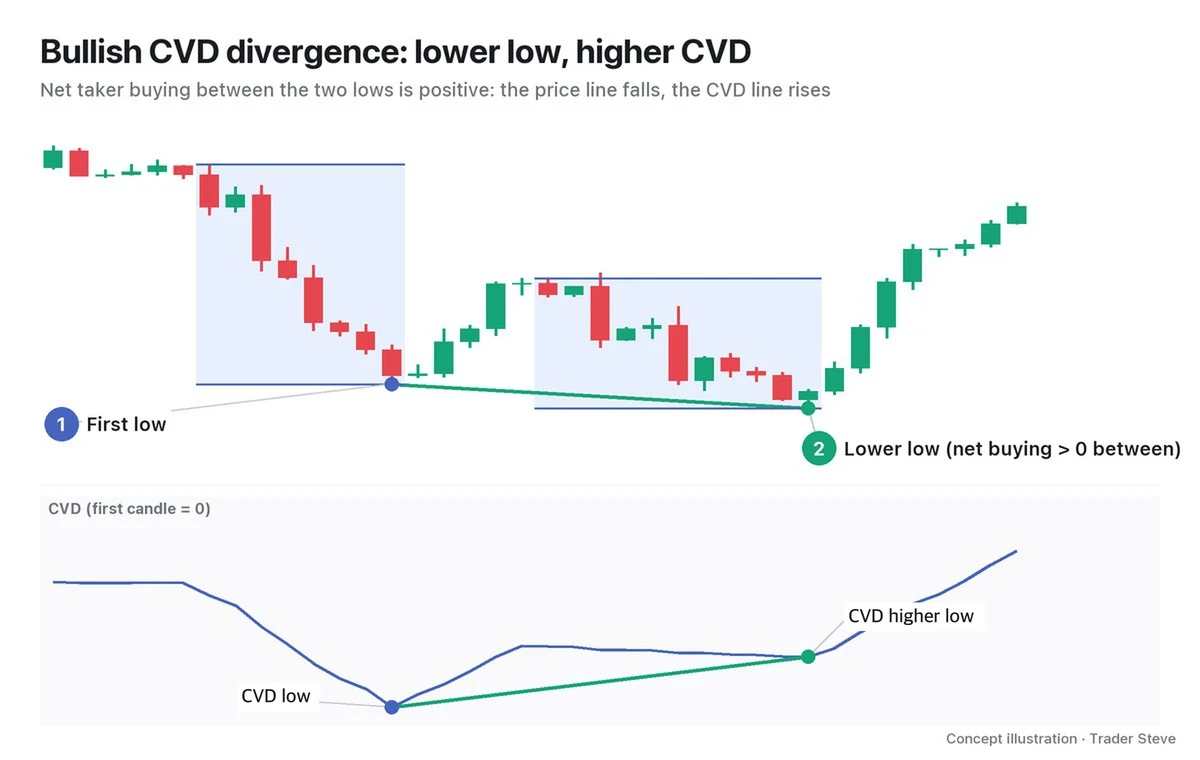
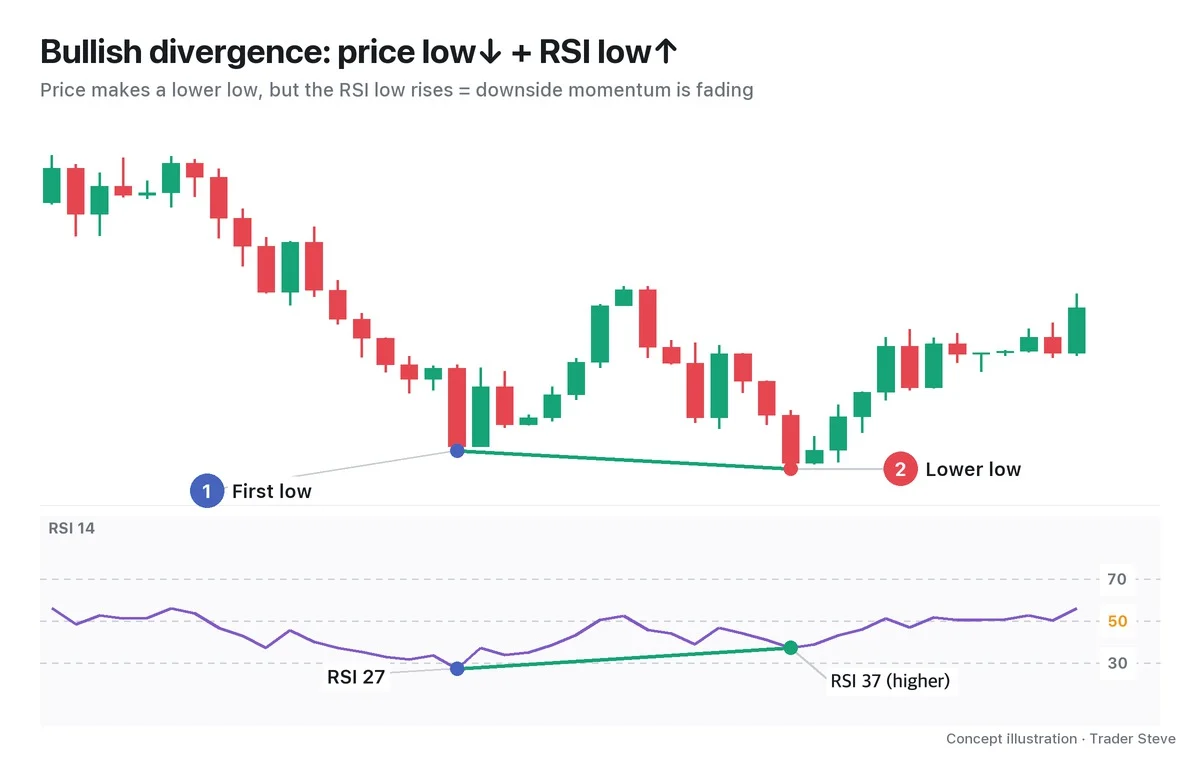
A bullish CVD divergence is when price makes a lower low but the CVD on those same two candles makes a higher low. It means net taker buying from the first low candle to the second low candle was positive. Whether the absolute amount of aggressive selling actually shrank across the two declines can only be known by adding up each decline's taker sell volume separately.
"So what can we tell? Price has fallen, but more and more people are buying." — Trader Steve, live stream, Oct 16, 2026 (translated from Korean) · ▶ Watch the stream highlights (Korean audio)
I said this while reading a Korean stock's 4-hour chart with RSI. In crypto futures, you can check the same question with CVD, by counting actual traded quantities.
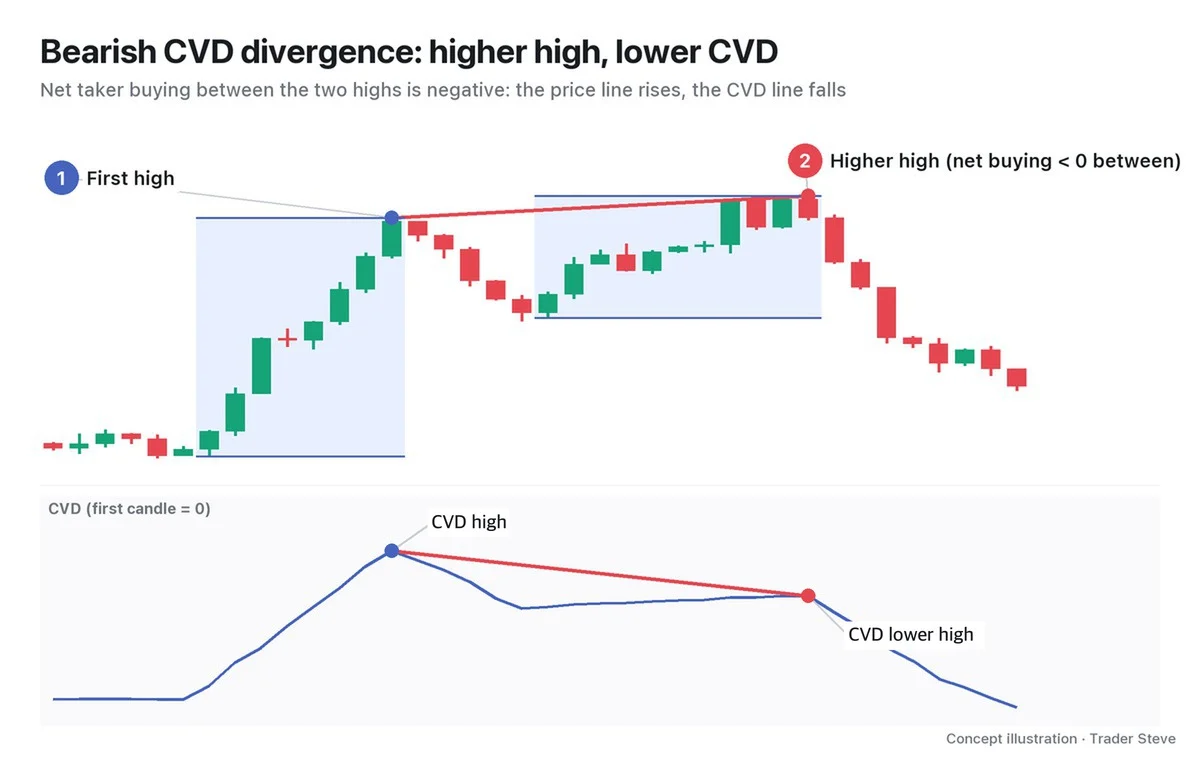
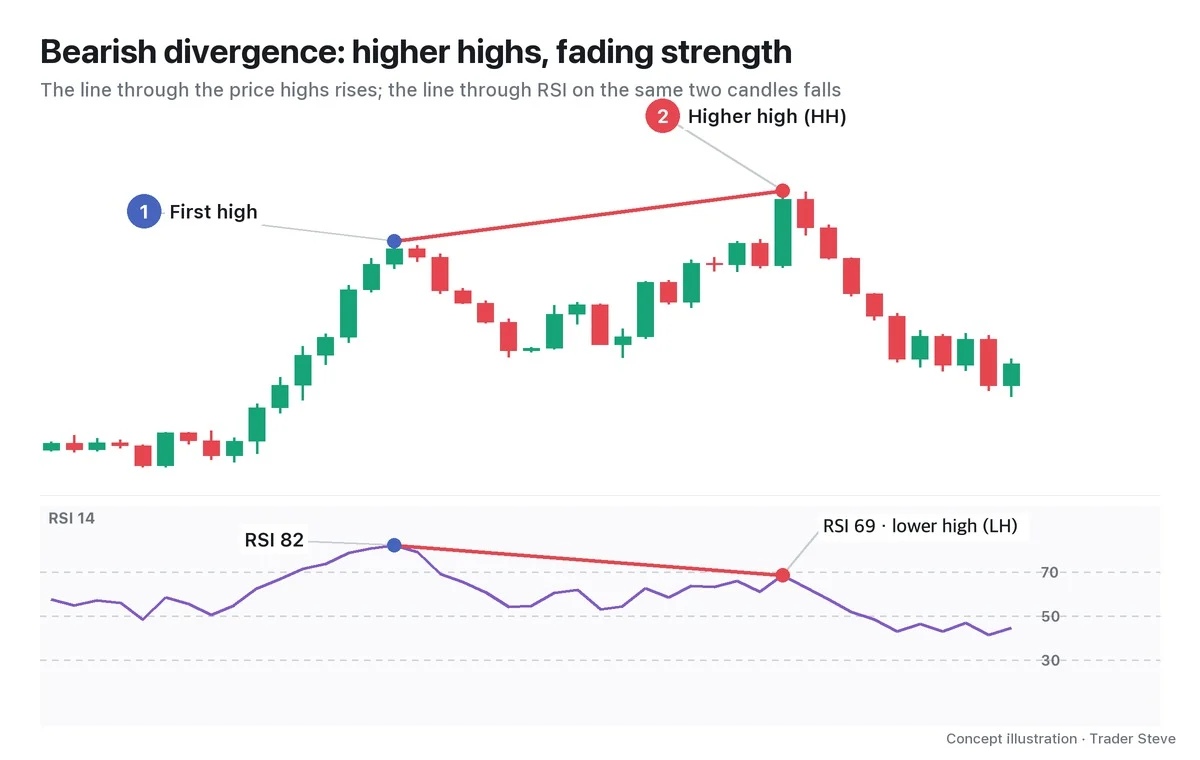
A bearish CVD divergence is the reverse. Price made a new high, but net taker buying between the two high candles was negative. That does not mean the absolute amount of aggressive buying in each rally shrank.
In both charts, you pick the two price swings first, then compare the CVD values on those two candles. And a divergence is only a warning that "momentum is fading," not a confirmed signal that direction will turn right there.
5. Why Crypto Traders Watch Futures CVD
Start with what normal looks like. When price rallies hard, CVD rising along with it is the normal state.
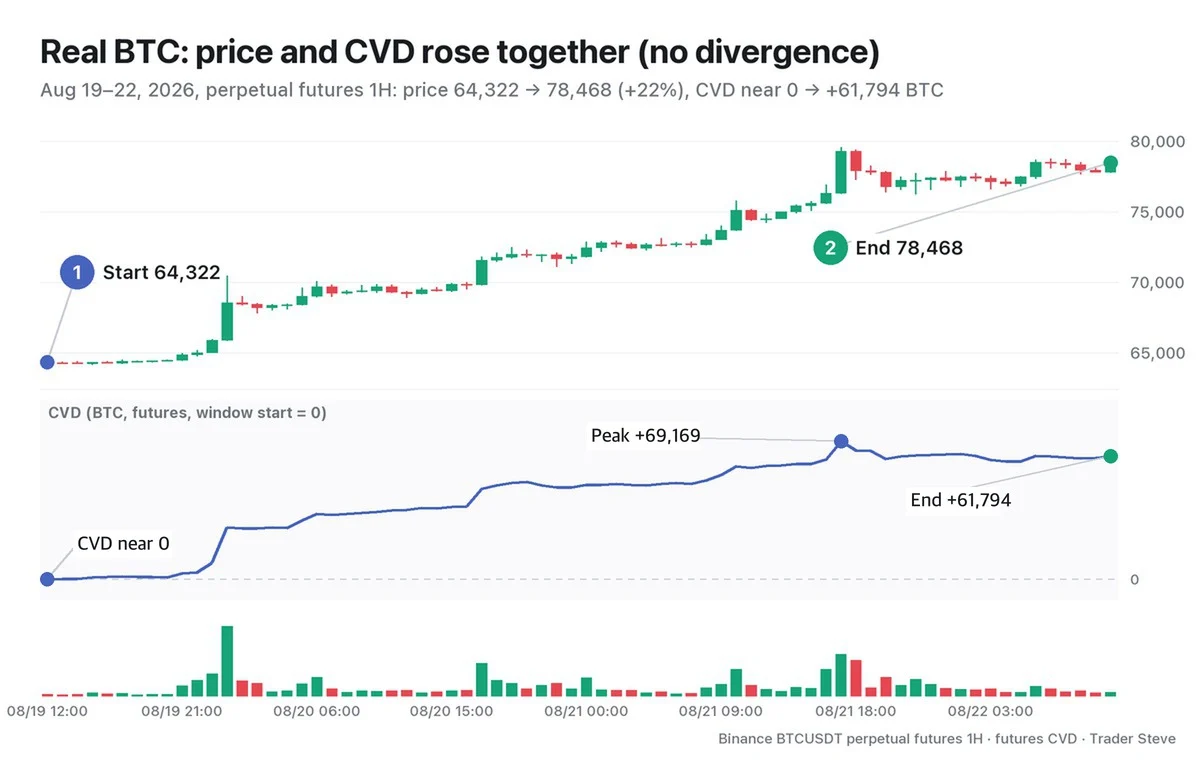
Price rose about 22%, and futures CVD peaked at +69,169 BTC on the 17:00 KST candle on Aug 21. Scanning this stretch with code, using swings with 6 candles on each side, finds not a single regular CVD divergence candidate. Price and aggressive buying moved in the same direction — the baseline picture to know before you go looking for divergences.
This chart, however, uses perpetual futures data, not spot. The reason is volume. Comparing Binance BTC 1-hour data for Aug 24–30, 2026, perpetual futures volume was about 9.2 times spot volume, and over the three days above it was about 9.7 times. Spot CVD over those same three days was +4,490 BTC, only about 1/14 of futures CVD.
Most of the market orders that push crypto prices come from futures. So this series uses futures CVD as the default and spot CVD for comparison. Cases where the two tell different stories come in Parts 4 and 5; the basics of reading volume bars are in Basics Volume (related lesson).
Key Takeaways
- A taker consumes resting orders; takers include market orders and limit orders that fill immediately.
- Delta = a candle's taker buys minus taker sells; CVD = the line you get by stacking those deltas in order.
- OBV adds or subtracts a candle's whole volume, while CVD splits it by which side was aggressive.
- Price low ↓ with CVD low ↑ is a bullish CVD divergence; price high ↑ with CVD high ↓ is a bearish CVD divergence. Both are warnings, not confirmed signals.
- In crypto, futures volume is about 9.2 times spot volume, so futures CVD is the default.
In Part 2, we'll cover the rules and checklist for finding CVD divergences on a chart.
If matching CVD to every swing by hand feels tedious, take a look at the Omnisight Report, which lays it out for each market.
This lesson adapts the text, figures and live-stream quotes of the Trader Steve TA series for the web, translated from the original Korean. Check the text and figure captions for the timing and interpretation of each real example, and read conceptual diagrams and real charts separately.
Corrections: support@omnisight.report