What Is Exaggerated Divergence? Double Bottoms, Double Tops and RSI
Historical examples for learning · not current prices or trade recommendations.
Contents
You often see price come down to the same spot twice, while the Relative Strength Index (RSI) doesn't drop as far the second time. Textbooks call this exaggerated divergence. This lesson uses charts to show what this shape — price at the same height, RSI at a different height — actually is, and why it is read as "the second push ran out of steam."
All dates and times are Korea Standard Time (KST, UTC+9). A daily candle is dated by its 09:00 KST open, and intraday examples are timed by the open of the KST candle.
1. The One-Line Definition: Two Points at the Same Height, RSI at Different Heights
Exaggerated divergence is when price makes two lows (a double bottom) or two highs (a double top) at the same height, but the oscillator prints a clearly different height at the second point. This series uses the 14-period RSI (RSI 14) as the oscillator.
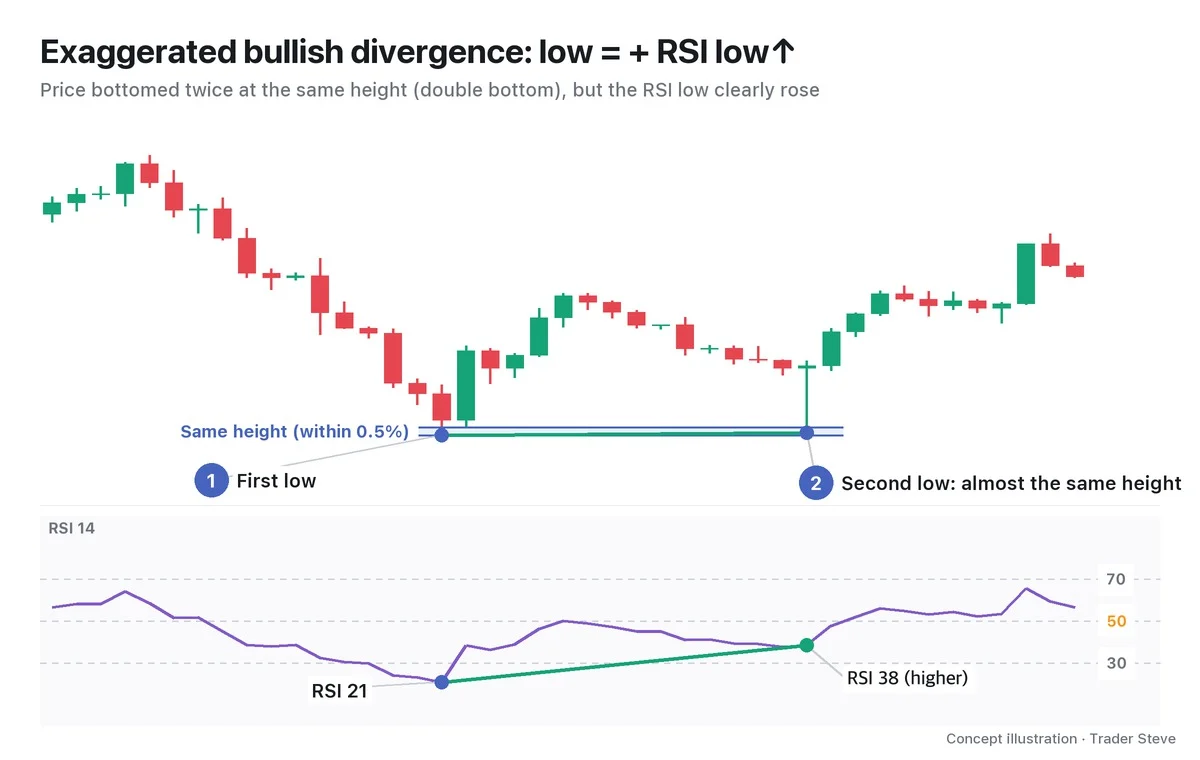
The word "exaggerated" comes from the fact that the gap on the indicator stands out even though price never made a new low. There is no widely used abbreviation, and some sources classify it as "Class B divergence." Note that the name is a textbook term. On the live stream, I usually describe it instead as "a double bottom with bullish RSI divergence on it."
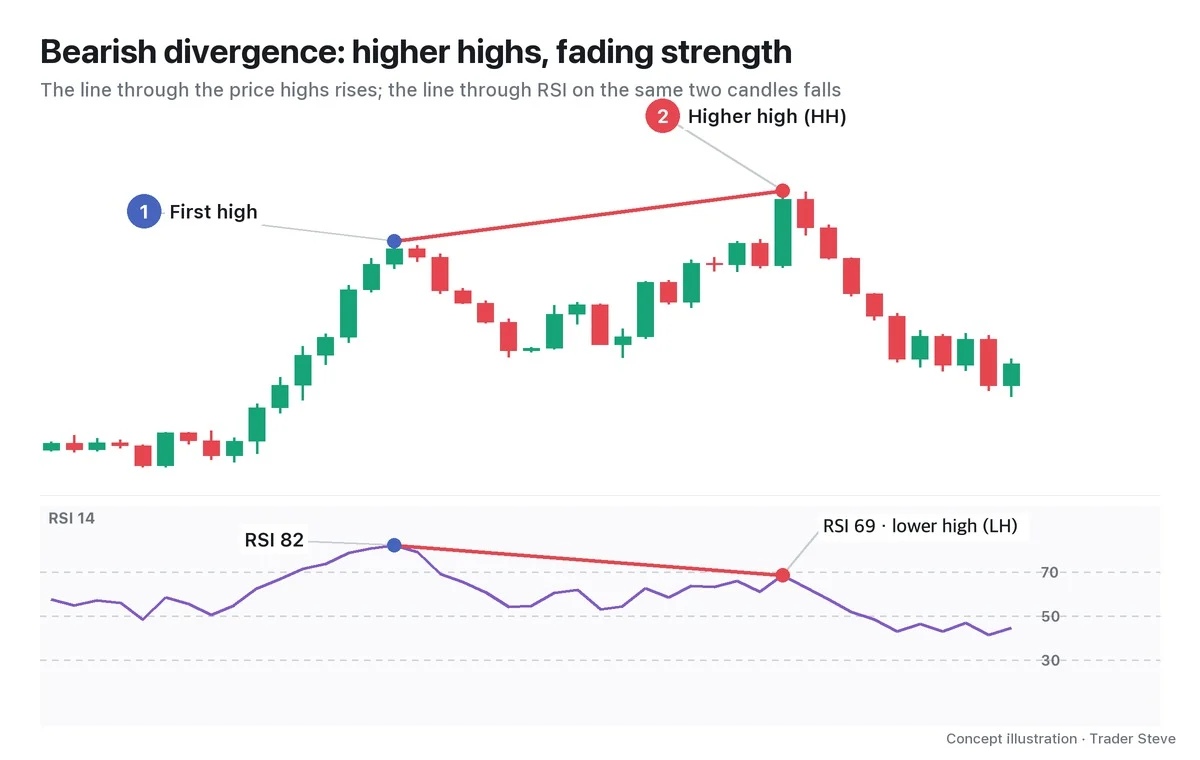
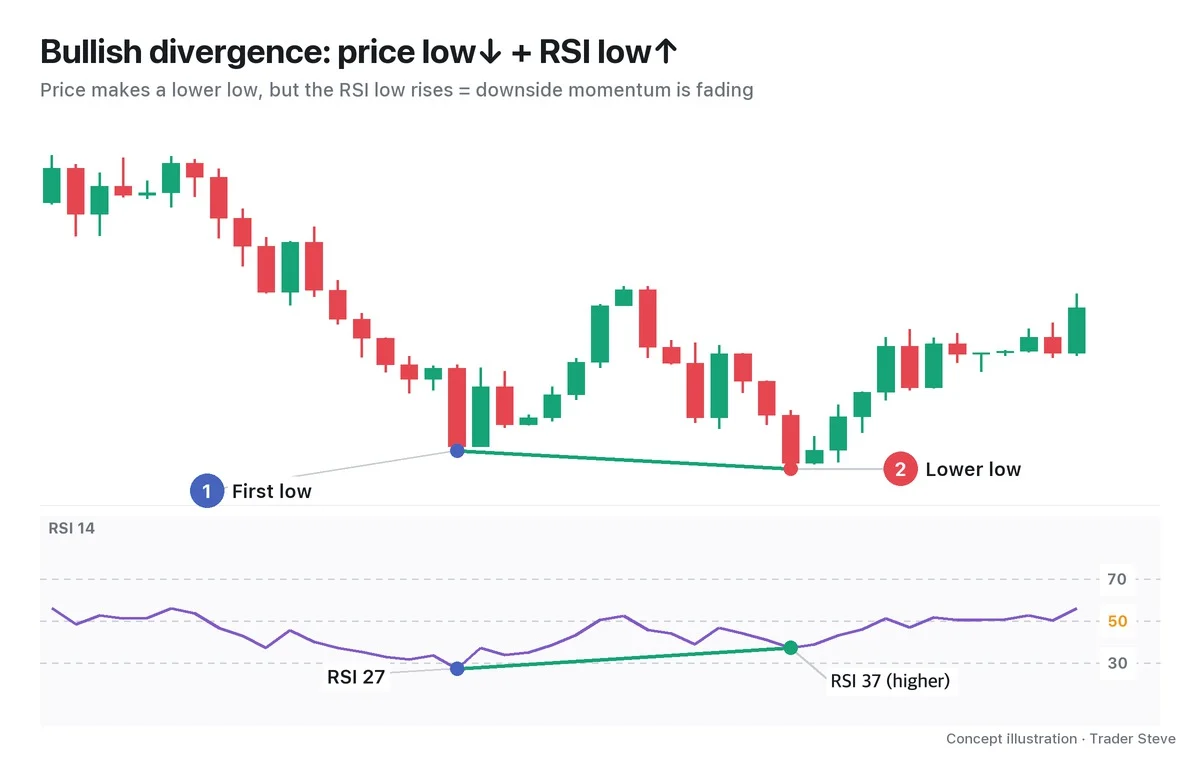
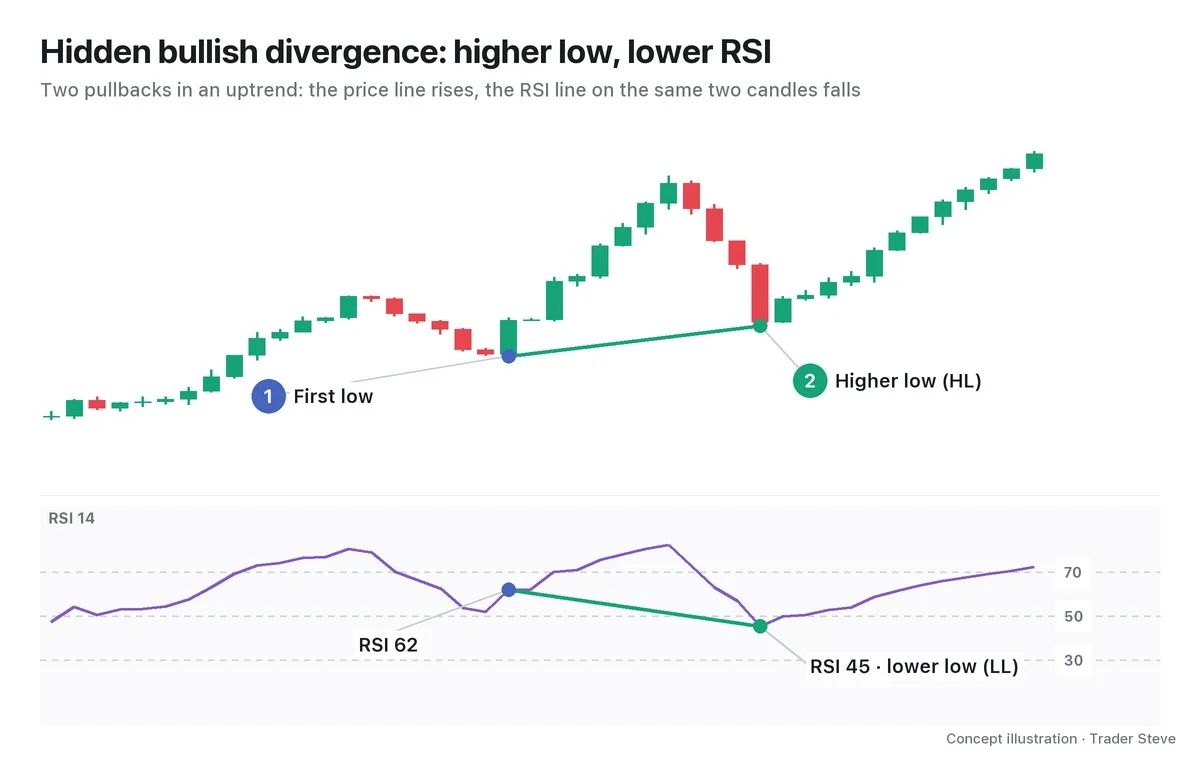
How you define "the same height" matters. In this series, two points whose prices are within 0.5% of each other count as the same height. If the second low is below that band (a lower low) and RSI is higher, it is regular bullish divergence. A low above the band (a higher low) counts as hidden bullish divergence only if RSI is lower; if RSI is higher as well, it is none of these divergences. At highs, price must be lower and RSI higher for hidden bearish divergence. Part 2 covers the criteria in detail, with numbers.
2. Exaggerated Bullish and Exaggerated Bearish Divergence
There are two kinds, depending on direction.
| Type | Price shape | RSI | How to read it |
|---|---|---|---|
| Exaggerated bullish divergence | two lows at the same height (double bottom) | the second low is higher | the second drop had less momentum |
| Exaggerated bearish divergence | two highs at the same height (double top) | the second high is lower | the second rally had less momentum |
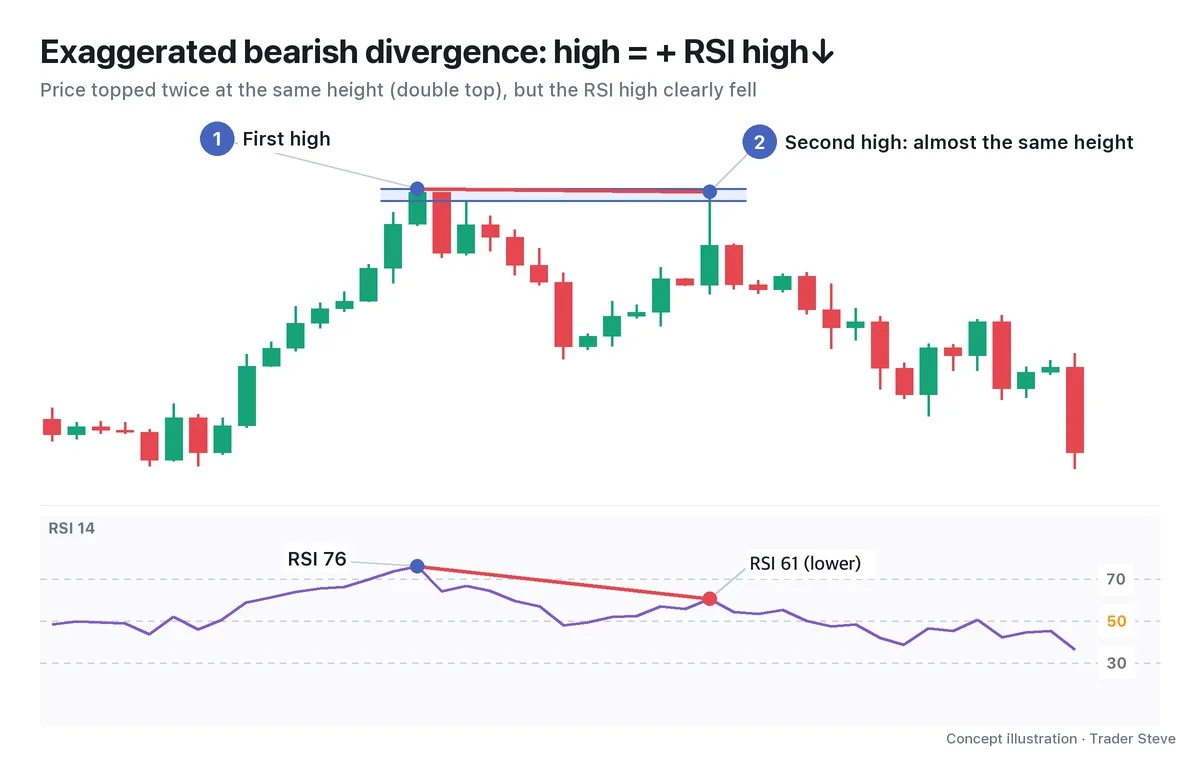
Double bottom and double top are names for price shapes. Exaggerated divergence is that shape with an RSI mismatch added on top. Not every double bottom is exaggerated divergence. If RSI dropped equally both times, there is no mismatch — it is just a double bottom.
The bounce high between the two lows (or, for a double top, the pullback low between the two highs) is called the neckline. It is the line you use later to judge whether the shape has been confirmed and where to set a target.
3. Why It Forms: Price Got There, but With Less Force
RSI is calculated from the ratio of the size of the up moves to the size of the down moves over a recent period. So even if price comes down to the same spot, RSI won't fall as far as the first time if that drop happened slowly, in small candles.
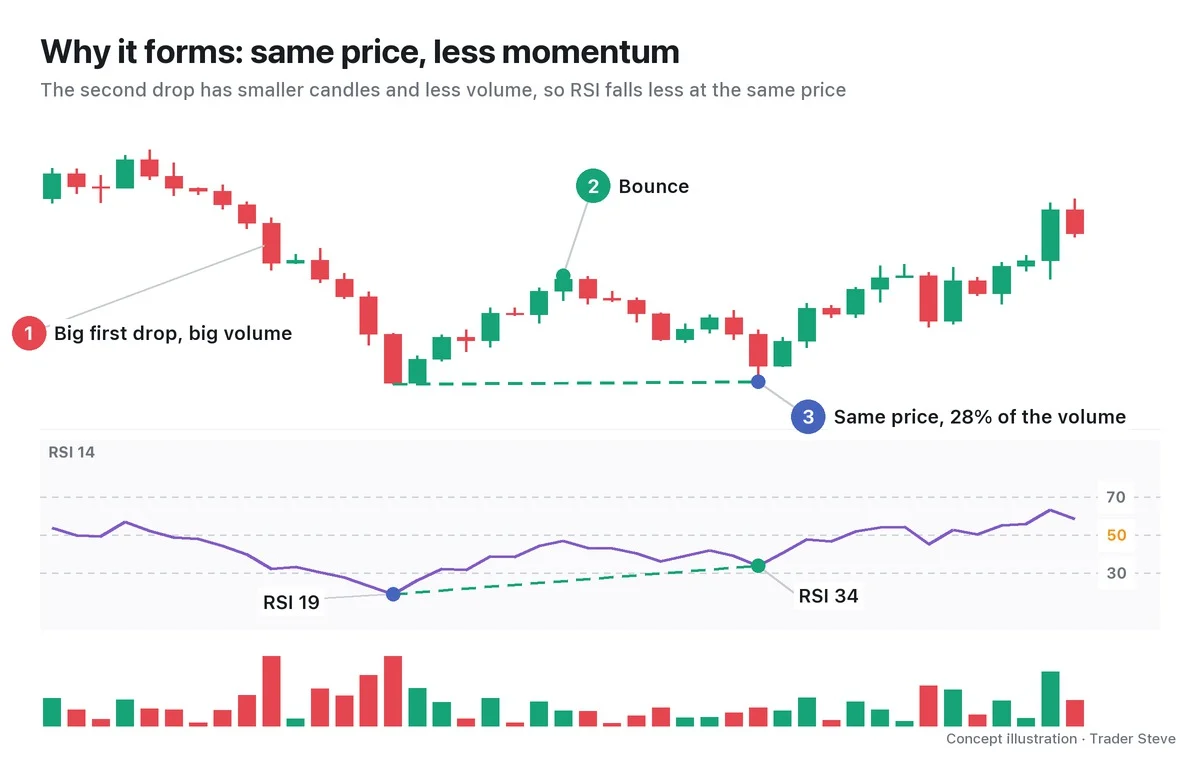
The second drop reaches the same price, but its candles and its volume are both small. On price alone, it reads as "pushed down to the same bottom again." Look inside, though, and it means the selling pressure was weaker than the first time.
"The second pullback being shallow means that when the double bottom formed, the right-hand bottom sat a bit higher and made a higher-low structure. It means sellers wanted to sell a lot but couldn't, it means the supply to sell had run dry…" — Trader Steve, live stream, Sep 4, 2026 (translated from Korean) · ▶ Watch the stream highlights (Korean audio)
This quote describes a case where the second low was slightly higher than the first. If the two lows are within 0.5% of each other and RSI rises, it is exaggerated bullish divergence. A low above the band counts as hidden bullish divergence only if RSI is lower; if RSI is higher as well, it is none of these divergences. Either way, the core idea is the same. Stopping at the same spot (or above it) means there were people who wanted to sell, but they couldn't sell enough to drag price any lower.
The bearish side (a double top) is the reverse. The second rally did reach the same high, but the buying pressure behind it was weaker.
"Price looks like it's holding up, but the picture may actually be that more and more selling is pouring in. Then the moment the size that's been holding it up here suddenly runs out, it drops like this." — Trader Steve, live stream, Oct 14, 2026 (translated from Korean) · ▶ Watch this moment (Short, Korean audio)
If price holds near the same high but the RSI high is lower, read it as a warning that the buying defending that height is shrinking.
4. How It Differs From Regular and Hidden Divergence
Divergence is classified by how the two points on price and the two points on RSI split apart. Using lows (the bullish side), it looks like this.
| Type | Price low | RSI low | Usual reading |
|---|---|---|---|
| Regular | lower ↓ | higher ↑ | a reversal warning that the downtrend may turn |
| Hidden | higher ↑ | lower ↓ | a pullback inside an uptrend; leans toward trend continuation |
| Exaggerated | equal = | higher ↑ | a reversal-side signal, but weighted less than regular |
For highs (the bearish side), flip every arrow. Regular is price high ↑ with RSI high ↓, hidden is price high ↓ with RSI high ↑, and exaggerated is price high = with RSI high ↓.
The reason exaggerated divergence is weighted less than regular divergence is simple. Regular divergence means price pushed all the way to a new low and still lost momentum; exaggerated divergence never made a new low, so the evidence that "momentum has faded" is that much less dramatic. Regular and hidden divergence are covered separately in the Divergence Regular and Divergence Hidden topics.
5. A Real Example: Ethereum's June 2026 Daily Double Bottom
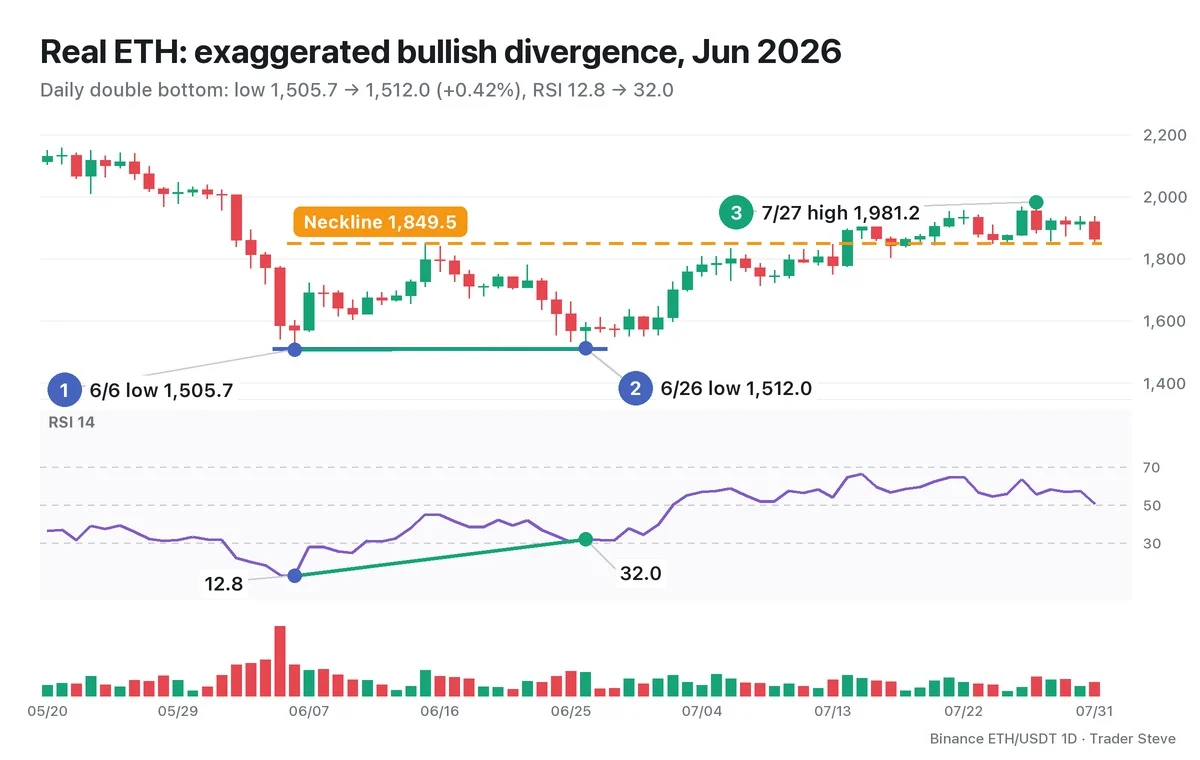
Ethereum (ETH) started sliding from a low of 1,967.0 on May 28 and fell 23.5% to a low of 1,505.7 on Jun 6. The day before, Jun 5, was a large bearish candle with the highest volume in this chart window, and RSI on Jun 6 fell as low as 12.8. It is a textbook "strong first drop."
Price then bounced to a high of 1,849.5 on Jun 15, was pushed back down, and made a low of 1,512.0 on Jun 26. The difference from the first low is +0.42%, within the 0.5% same-height threshold. No candle between the two lows went below the first low (the lowest price in between was 1,532.9 on Jun 25), and RSI that day was 32.0, 19.2 points higher than at the first low. Volume on Jun 26 was also about 34% of Jun 5's. Price reached the same level, but the selling pressure that brought it down was far weaker.
Here is what happened next. RSI closed above 50 for the first time on Jul 3 (55.2), and the first daily close above the 1,849.5 neckline came on Jul 14 (1,891.9). On Jul 27, price reached a high of 1,981.2, 31.0% above the second low, and through Jul 31 it did not go back below the Jun 26 low.
Still, this shape is a reversal "candidate," not a confirmation. Even in this case, the second low needed several more candles before it was confirmed as a swing low, and confirmations like RSI 50 and the neckline came much later. Above all, stop-loss orders tend to cluster just below two lows at the same height, so it is common for that spot to get swept once before the direction is decided. Part 3 covers when to enter and where to put the stop, and Part 5 checks with numbers how often the same spot gets swept.
Key Takeaways
- Exaggerated divergence is a double bottom or double top at the same height + RSI at a different height.
- Exaggerated bullish divergence means the second drop had less momentum; exaggerated bearish divergence means the second rally had less momentum.
- This series treats two points within 0.5% of each other in price as the same height. Outside that band, look at the direction of price and RSI together. Only a higher low with a lower RSI is hidden bullish divergence.
- It is a weaker reversal "candidate" than regular divergence, and the same-height spot sometimes gets swept.
In Part 2, we'll cover how to judge "the same height" with numbers, how to measure the RSI difference, and a checklist for telling wicks from bodies.
If matching double bottoms, double tops and RSI by hand for every market feels tedious, the Omnisight Report lays out the evidence for each market, divergence included.
This lesson adapts the text, figures and live-stream quotes of the Trader Steve TA series for the web, translated from the original Korean. Check the text and figure captions for the timing and interpretation of each real example, and read conceptual diagrams and real charts separately.
Corrections: support@omnisight.report