What Is Hidden Divergence? The Trend-Continuation Signal Explained
Historical examples for learning · not current prices or trade recommendations.
Contents
When traders hear "divergence," most think of a reversal signal: the trend is about to turn. But there is also a divergence that points the other way — "this pullback is ending, and the original trend may resume." That is hidden divergence. This lesson uses charts to show what hidden bullish and hidden bearish divergence are, why they form, and how to tell them apart from regular divergence.
All dates and times are Korea Standard Time (KST, UTC+9). A daily candle is dated by its 09:00 KST open. Intraday examples are identified by the KST open time of the candle.
1. The One-Line Definition: A Trend-Continuation Divergence
Divergence is when price and an oscillator such as the Relative Strength Index (RSI) point in different directions. It helps to separate two kinds right away.
- Regular divergence: a reversal warning that the trend is running out of steam
- Hidden divergence: a continuation signal that a pullback within the trend is ending
Hidden divergence is also called "concealed divergence" or "continuation divergence," and some books call it "reverse divergence." The names differ, but the meaning is the same: the indicator says the pullback went fairly deep, yet the price structure did not break down to the same degree.
Every indicator in this lesson is RSI 14. The same principle applies to the Moving Average Convergence Divergence (MACD) histogram and the stochastic oscillator.
2. Hidden Bullish Divergence: Higher Low in Price, Lower Low in the Indicator
Hidden bullish divergence appears in an uptrend. When price pulls back twice, you compare the two lows.
- Price: the second low is higher than the first → a higher low (HL)
- RSI: on those same two candles, the second RSI reading is lower → a lower low (LL)
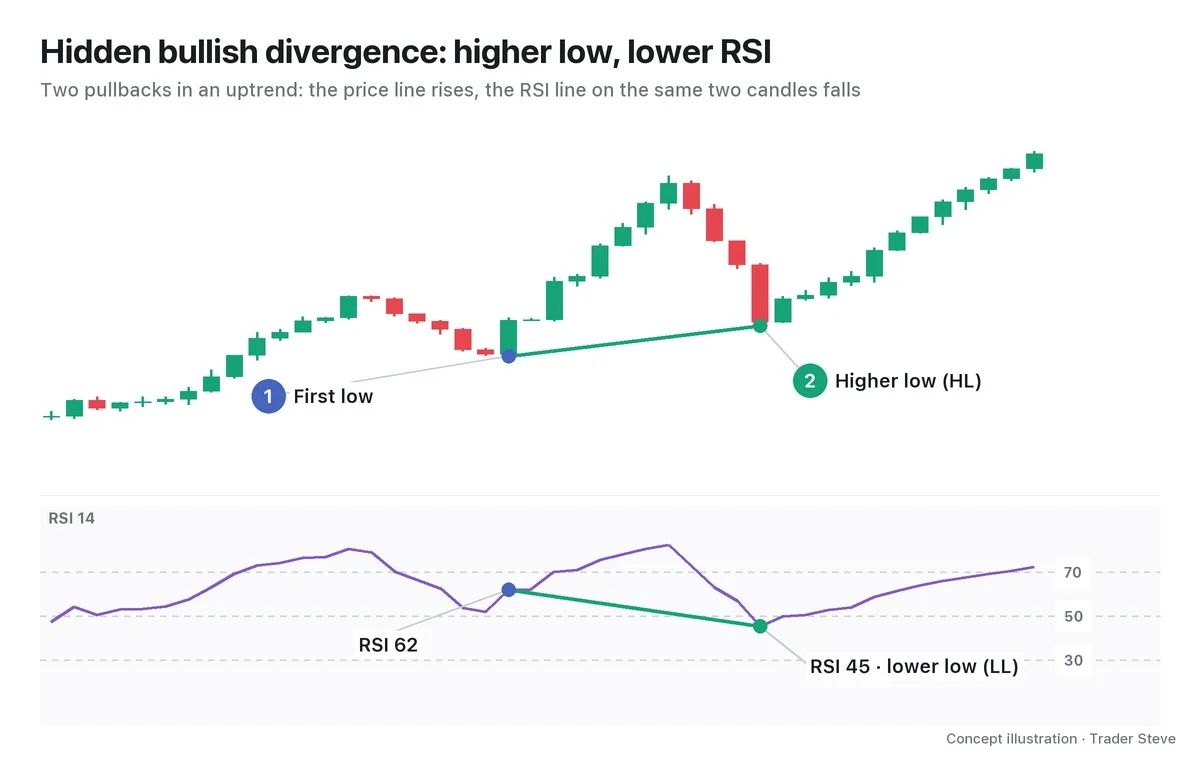
Two points matter here. You connect lows to lows, and you don't pick just any RSI trough — you use the RSI value on the same candle as the price swing low. A higher low that holds in an uptrend means the structure is still intact, so hidden bullish divergence is read as a signal that leans toward the uptrend continuing.
3. Hidden Bearish Divergence: Lower High in Price, Higher High in the Indicator
Hidden bearish divergence is the mirror image. In a downtrend, when price bounces twice, you compare the two highs.
- Price: the second bounce high is lower than the first → a lower high (LH)
- RSI: on those same two candles, the second RSI reading is higher → a higher high (HH)
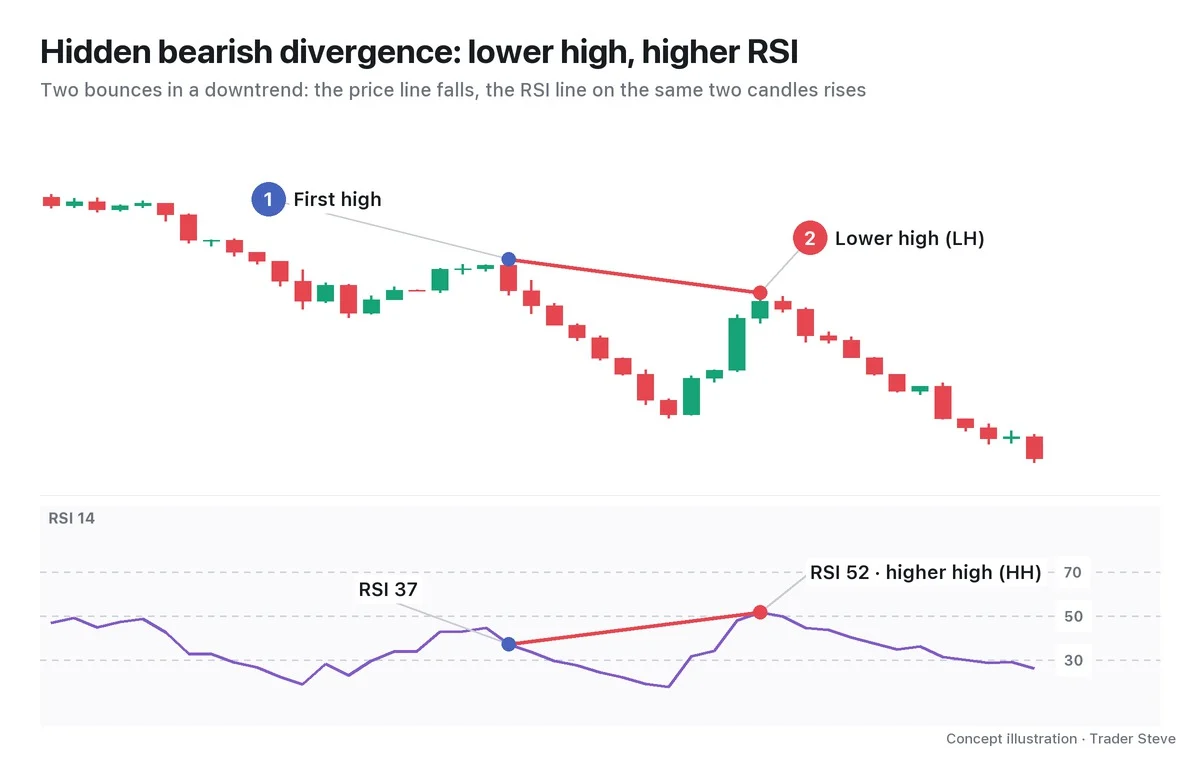
This time you connect highs to highs. Judging by the indicator alone, the bounce looked fairly strong, yet price failed to clear the prior high and stalled lower. The bearish structure (lower highs) held, so it is read as a signal that leans toward the downtrend continuing.
4. Why It Forms: The Pullback Ran Deep, but the Structure Held
RSI measures "how hard and how fast price has moved recently" more than "where price is right now." So when a pullback comes quickly and steeply, RSI can drop below its reading at the first low even though price never gets back down to that first low.
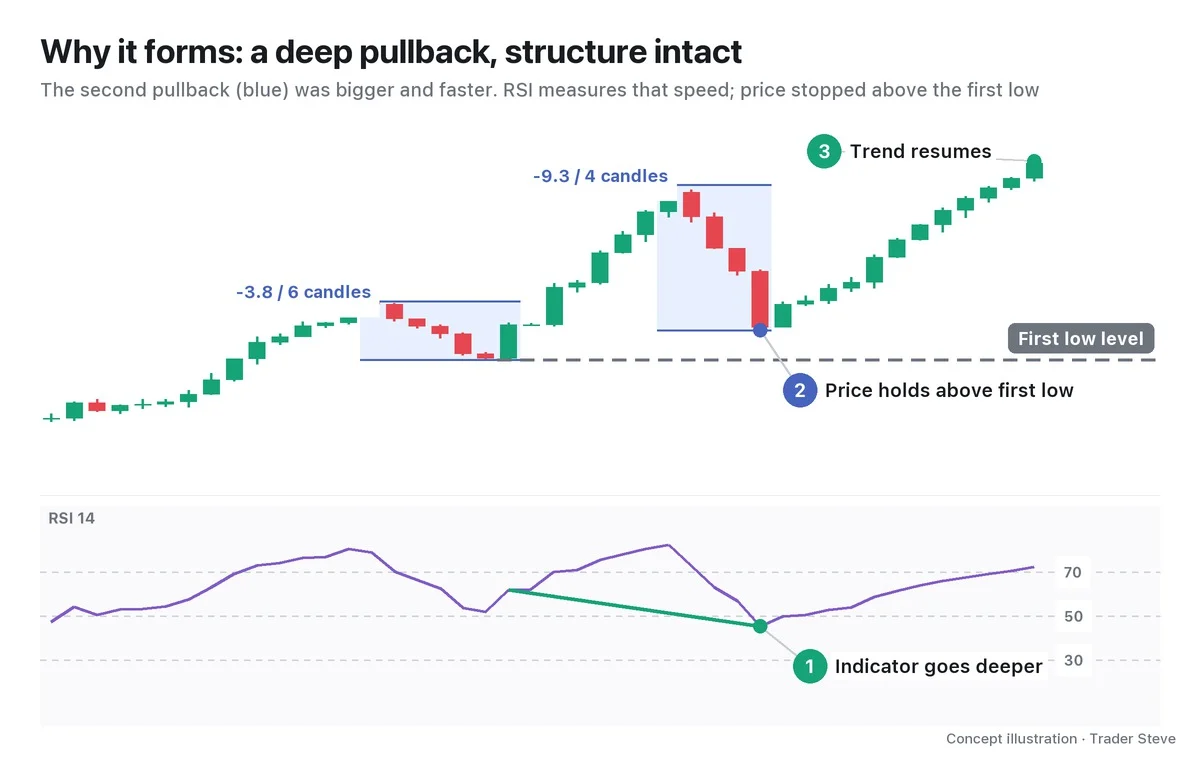
In the illustration, the second pullback is more than twice as large as the first, and faster — selling came in all at once. Even so, price could not break the first low. That tells you someone was absorbing the selling below, and that is the core of hidden bullish divergence. I once described the same kind of scene on the live stream:
"Right now, on the short timeframe — this is the 5-minute chart — it got hammered into oversold. But the structure that's forming here is, honestly, what people call hidden divergence. There's a ton of selling going on, but price isn't getting pushed down nearly as much." — Trader Steve, live stream, Aug 28, 2026 (translated from Korean) · ▶ Watch the stream highlights (Korean audio)
"A ton of selling, but price isn't getting pushed down nearly as much" is the definition itself. The indicator (selling pressure) set a new extreme; the price structure did not. Put the other way round, the moment that higher low breaks, the signal is over. Hidden divergence is valid only "while the structure holds." Part 3 covers how to use this invalidation level to set your stop-loss.
The same shape shows up on real charts.
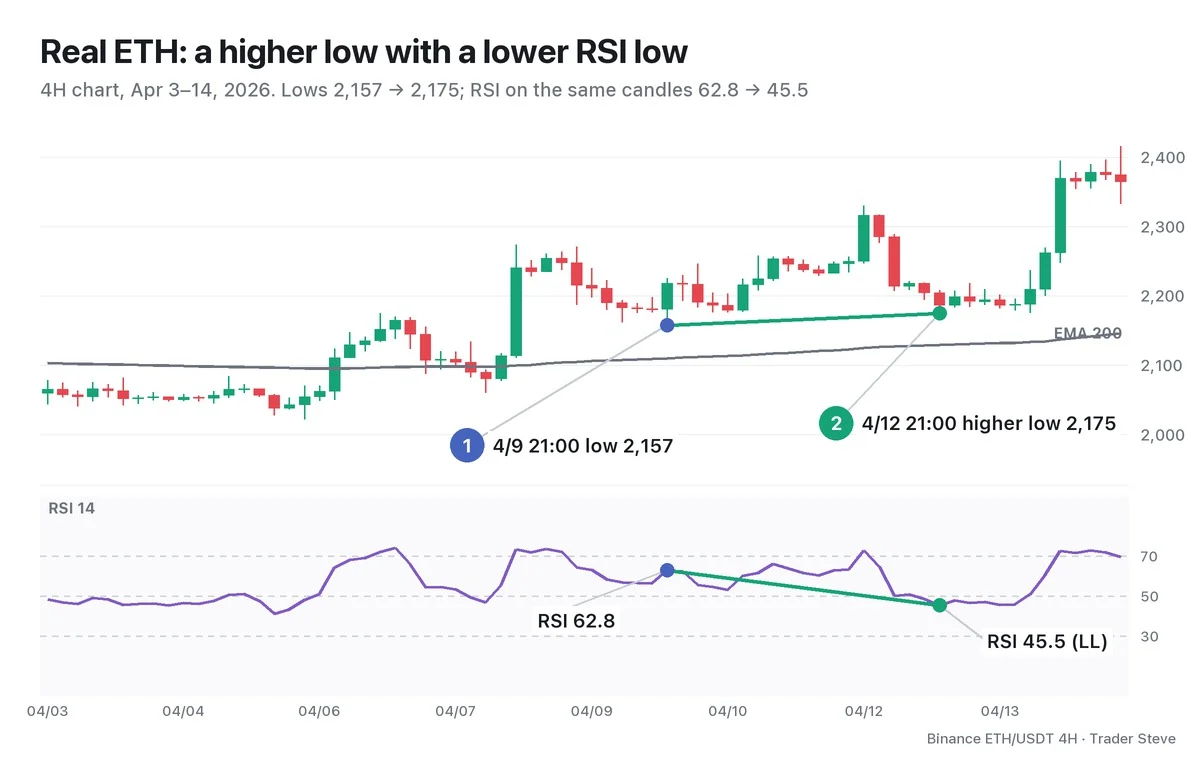
After the 2,157 low on the Apr 9 21:00 candle (RSI 62.8), the low on the Apr 12 21:00 candle was higher at 2,175, but RSI was 45.5 — 17.3 points lower. The second low's candle closed above the 200-period exponential moving average (EMA 200, at 2,129), so the larger trend was also pointing up. Through the Apr 14 21:00 candle at the end of the chart, 2,175 did not break. Note, though, that under a rule requiring four candles on each side, this low is only confirmed as a "swing low" once the Apr 13 13:00 candle closes. Part 2 covers this confirmation delay, and Part 3 walks through building an entry, stop and target from this exact setup.
5. Side-by-Side With Regular Divergence
Putting all four types in one table removes most of the confusion.
| Type | Points connected | Price | Indicator (RSI) | How to read it |
|---|---|---|---|---|
| Regular bullish | lows to lows | lower low (LL) | higher low (HL) | downtrend reversal warning |
| Regular bearish | highs to highs | higher high (HH) | lower high (LH) | uptrend reversal warning |
| Hidden bullish | lows to lows | higher low (HL) | lower low (LL) | leans toward uptrend continuation |
| Hidden bearish | highs to highs | lower high (LH) | higher high (HH) | leans toward downtrend continuation |
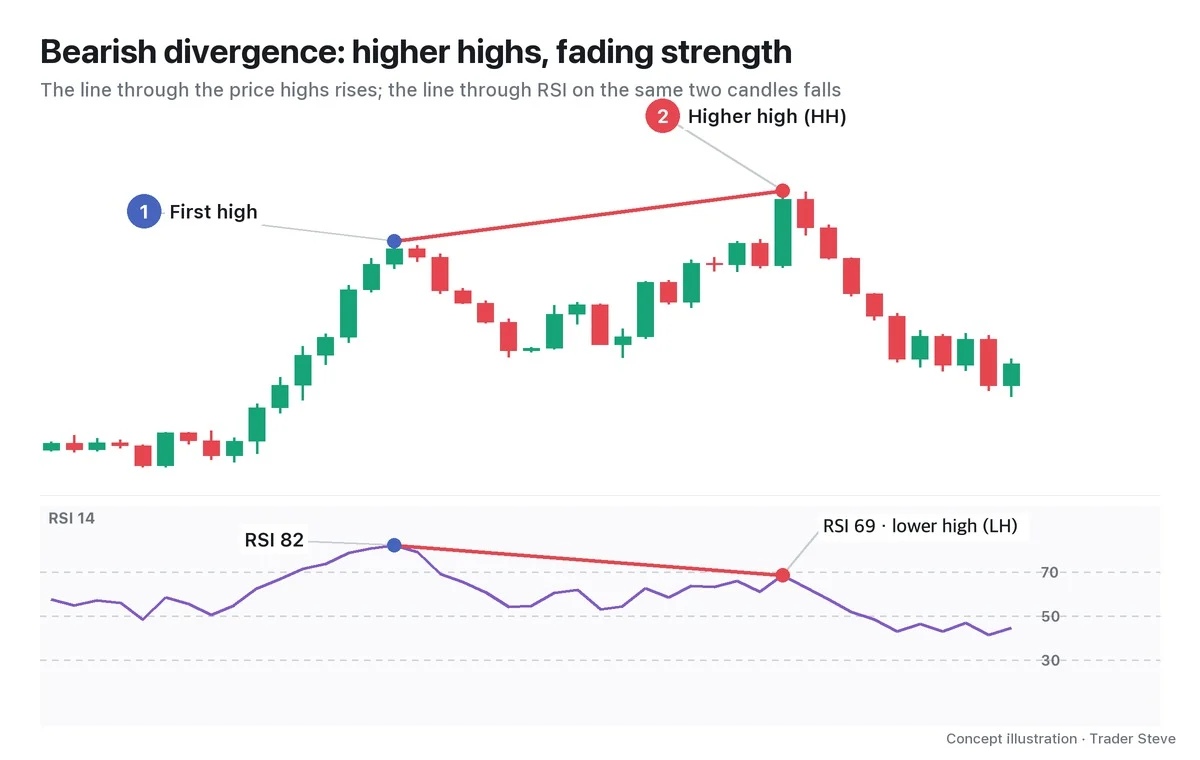
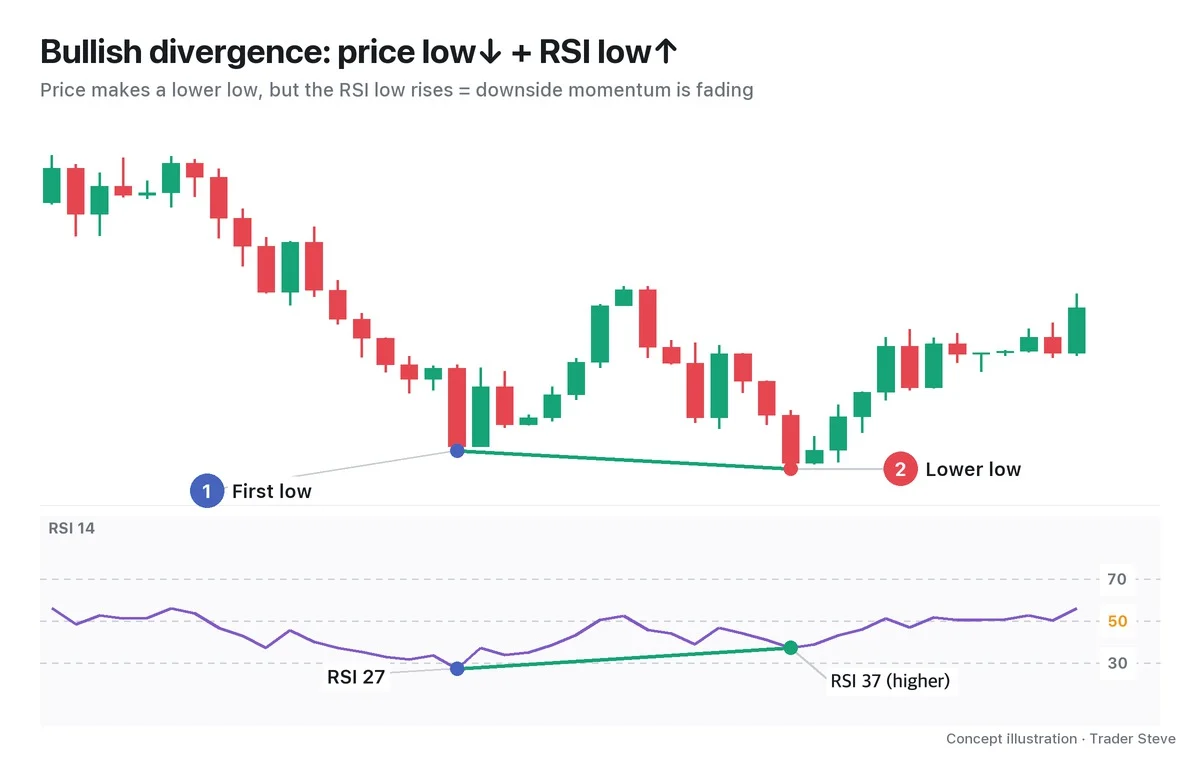
There is one thing to remember: if price sets a new extreme (a higher high or a lower low) and the indicator doesn't follow, it's regular; if the indicator sets a new extreme and price doesn't follow, it's hidden. Regular means reversal; hidden means continuation.
That is why, with hidden divergence, the trend direction comes first. If you call something hidden bullish just because two lows connect that way when there is no uptrend, the meaning changes. Part 2 turns trend confirmation and choosing which points to connect into a checklist. If divergence itself is new to you, start with the Divergence Basics lessons; if you're curious about the reversal type, the Divergence Regular lessons are a good place to begin.
Key Takeaways
- Hidden divergence is a divergence that leans toward trend continuation: it signals that a pullback within the trend is ending.
- Hidden bullish: in an uptrend, connect lows to lows — a higher low (HL) in price, a lower low (LL) in RSI.
- Hidden bearish: in a downtrend, connect highs to highs — a lower high (LH) in price, a higher high (HH) in RSI.
- The meaning: "the pullback ran deep (indicator), but the structure held (price)."
- Once the higher low (or lower high) breaks, the signal is over. It is not a confirmed signal — it is evidence that holds only while the structure holds.
In Part 2, we'll cover the step-by-step process for finding hidden divergence on a chart, the rules for connecting lows and highs, and a checklist. If checking divergence and structure by hand across many markets and timeframes gets tedious, the Omnisight Report below compiles it for each market.
This lesson adapts the text, figures and live-stream quotes of the Trader Steve TA series for the web, translated from the original Korean. Check the text and figure captions for the timing and interpretation of each real example, and read conceptual diagrams and real charts separately.
Corrections: support@omnisight.report