What Is MACD Divergence? Meaning and Why It Forms
Historical examples for learning · not current prices or trade recommendations.
Contents
You have probably seen it at least once: Bitcoin prints a new high, yet the Moving Average Convergence Divergence (MACD) under the chart rolls over well below its previous peak. When price and MACD tell different stories like this, you are looking at MACD divergence. This lesson uses charts to show what MACD divergence is, why it forms, and why MACD gives you two separate things to compare: the "line" and the "histogram."
All dates and times are Korea Standard Time (KST, UTC+9). A daily candle is dated by its 09:00 KST open, and intraday examples are identified by the open time of the KST candle.
1. A 30-Second MACD Refresher: Line, Signal and Histogram
Moving Average Convergence Divergence (MACD) is an indicator created by Gerald Appel in the late 1970s. It has three parts.
| Component | Calculation | What it means |
|---|---|---|
| MACD line | EMA12 - EMA26 | The gap between a short and a long average = the speed of the trend |
| Signal line | EMA9 of the MACD line | A smoothed version of the MACD line |
| MACD histogram | MACD line - signal line | Whether that speed is rising or falling = acceleration |
An exponential moving average (EMA) is a moving average that gives more weight to recent values. The zero line is the reference point. A MACD line above 0 means the short average is above the long one; a histogram above 0 means the MACD line is above the signal line. The components and the basics of reading them are covered in Part 2 of the Basics Oscillators topic. Here, you only need to remember one thing: "MACD line = the gap between two moving averages."
2. The One-Line Definition: Price Went Further, MACD Didn't
Divergence is a mismatch between price and an indicator: price makes a new extreme, but the indicator fails to follow. On MACD, it comes in two forms.
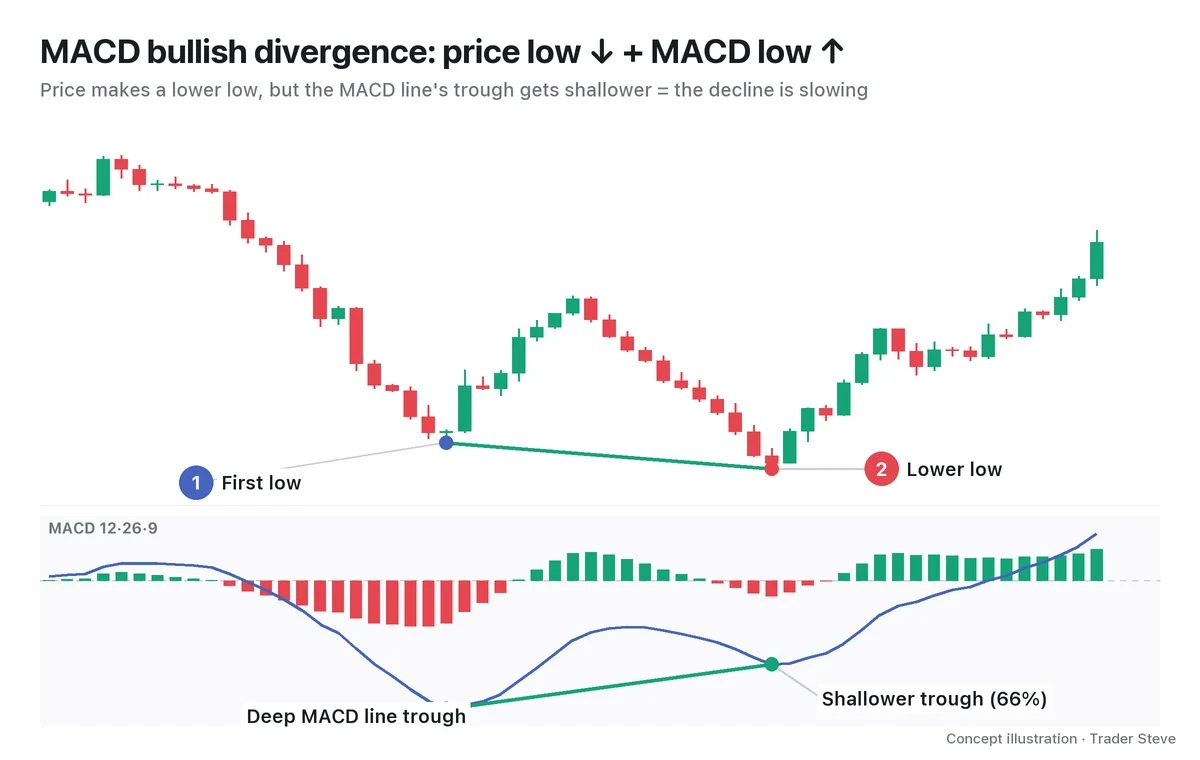
Regular bullish divergence is when price makes a lower low while MACD makes a higher low. In the chart, the green line on price slopes down and the green line on MACD slopes up. Price alone says "another new low," but with MACD added it reads as "a new low, but the decline is slower than last time."
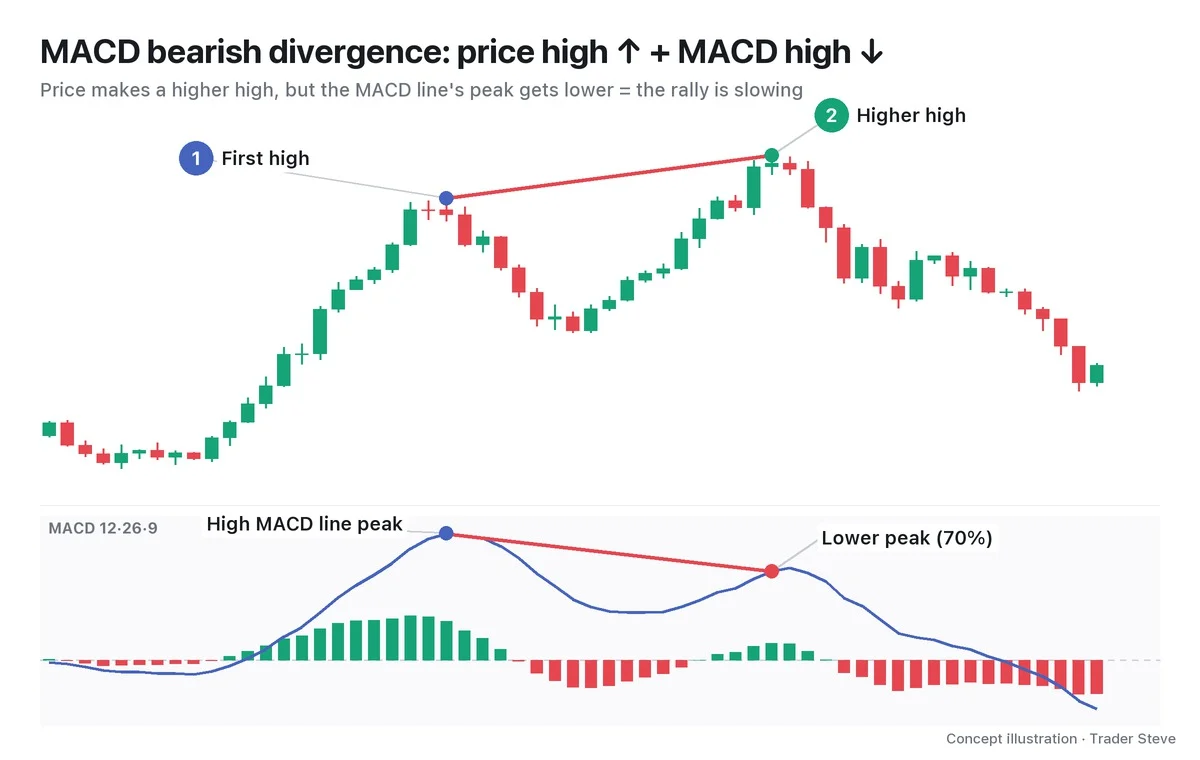
Regular bearish divergence is the exact mirror image: price makes a higher high while MACD makes a lower high. In both cases, what you compare is two swing points on price and the two MACD extremes made around the same time. You don't connect just any two MACD troughs that have nothing to do with the price lows.
3. Why It Forms: The Gap Between Two Moving Averages Narrowed
The reason MACD divergence forms is built into the definition of the MACD line. The MACD line is EMA12 minus EMA26 — in other words, the gap between a fast average and a slow average.
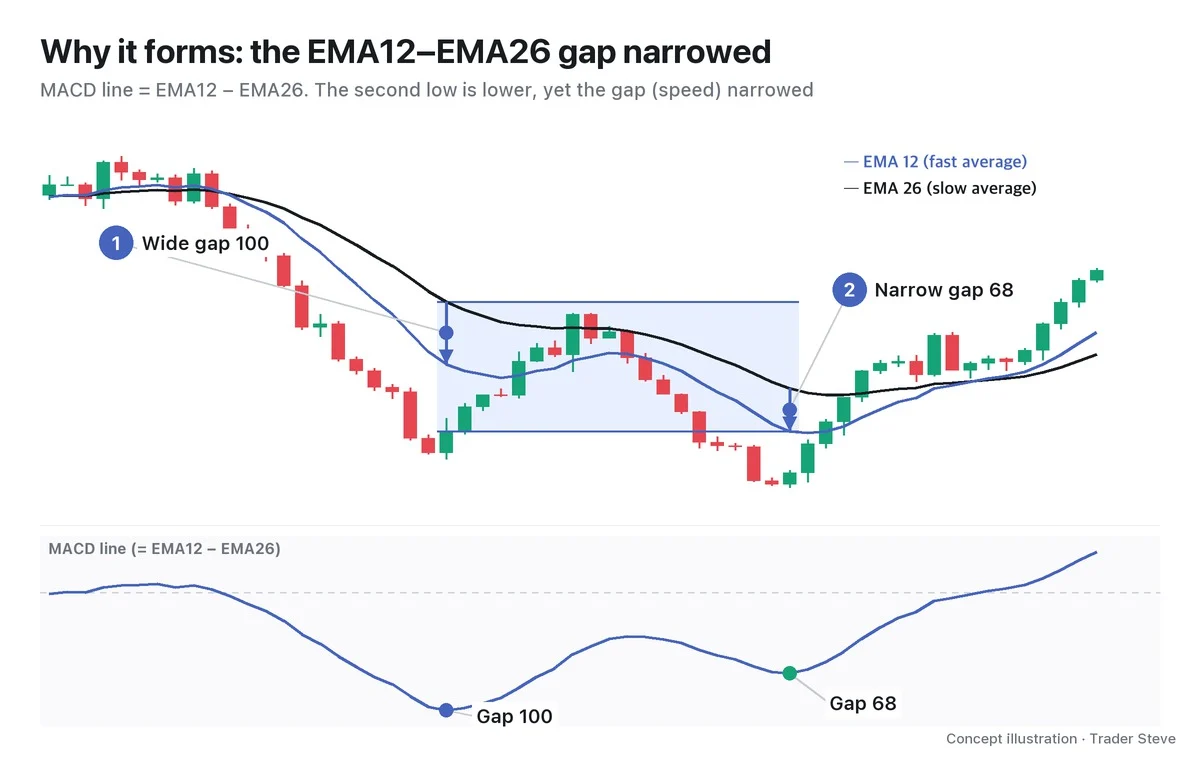
When price falls fast, EMA12, which reacts more to recent values, drops first while EMA26 follows slowly. The gap widens and the MACD line goes deep. The second decline, however, starts from a bounce and moves more slowly. Even though the low is lower, EMA12 can't pull far away from EMA26, so the gap stays narrow and the MACD line's trough is shallower. Price went further, but the decline lost speed — it decelerated.
On the live stream, I described this state like this.
"The selling momentum is decelerating, and you can see it on several timeframes. The selling pressure was enormous — is it being pushed back? How do you tell? MACD. What is MACD? It means the gap between the short- and long-term moving averages keeps shrinking. (…) It means buyers and sellers are coming into balance to some degree. It means the amplitude is shrinking." — Trader Steve, live stream, Oct 23, 2026 (translated from Korean) · ▶ Watch the stream highlights (Korean audio)
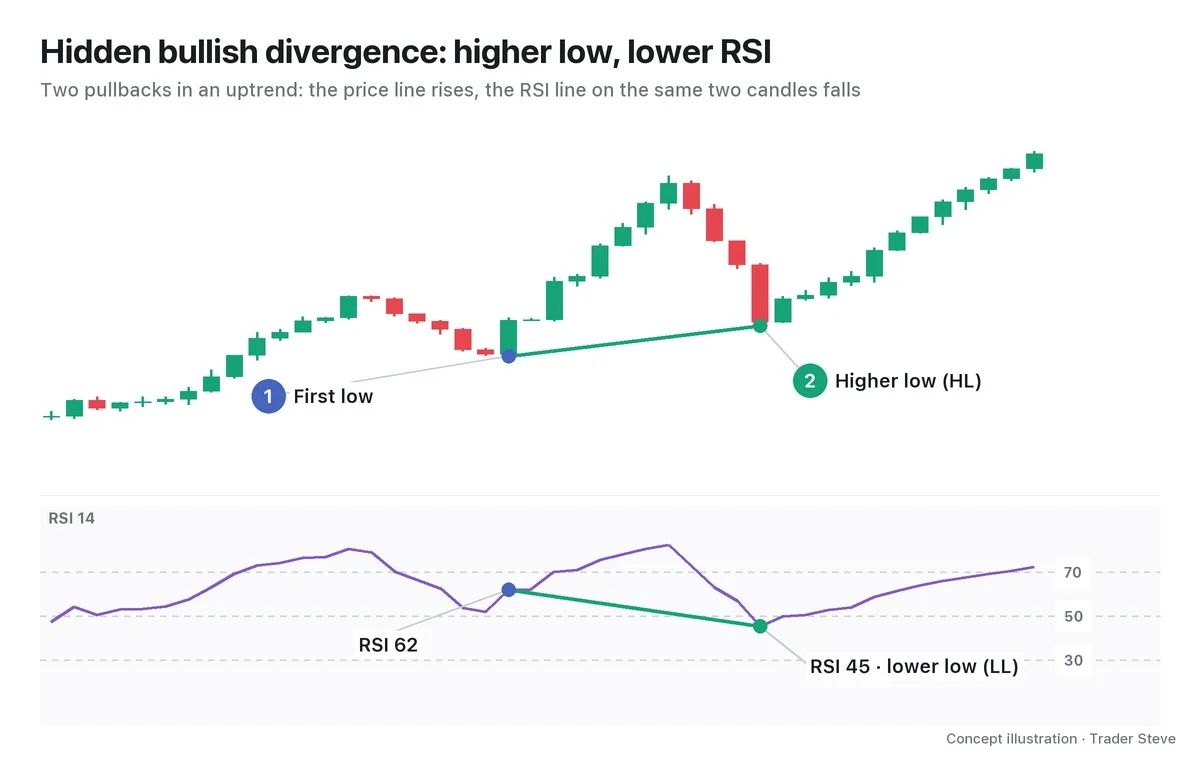
"The gap is shrinking" and "the amplitude is shrinking" describe the same thing as the blue zone in chart 3: the side that was pushing hard is losing its edge over the other side.
4. Two Things to Compare: The Line and the Histogram
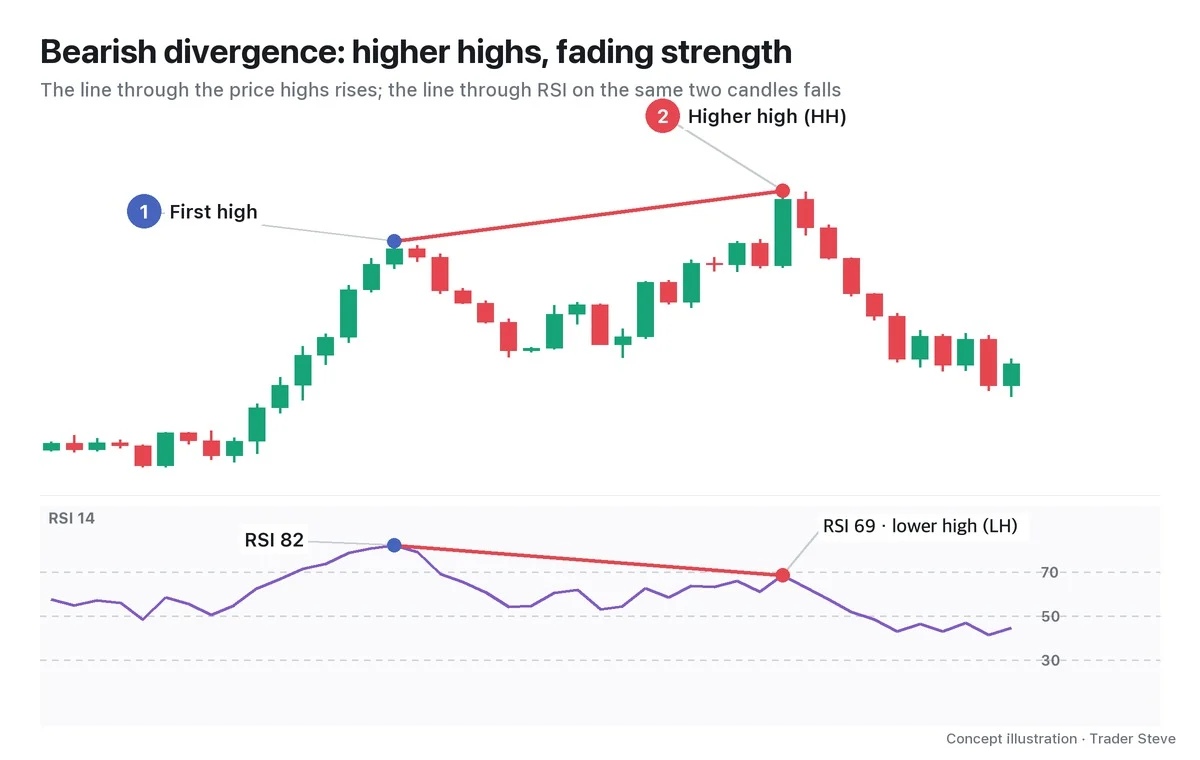
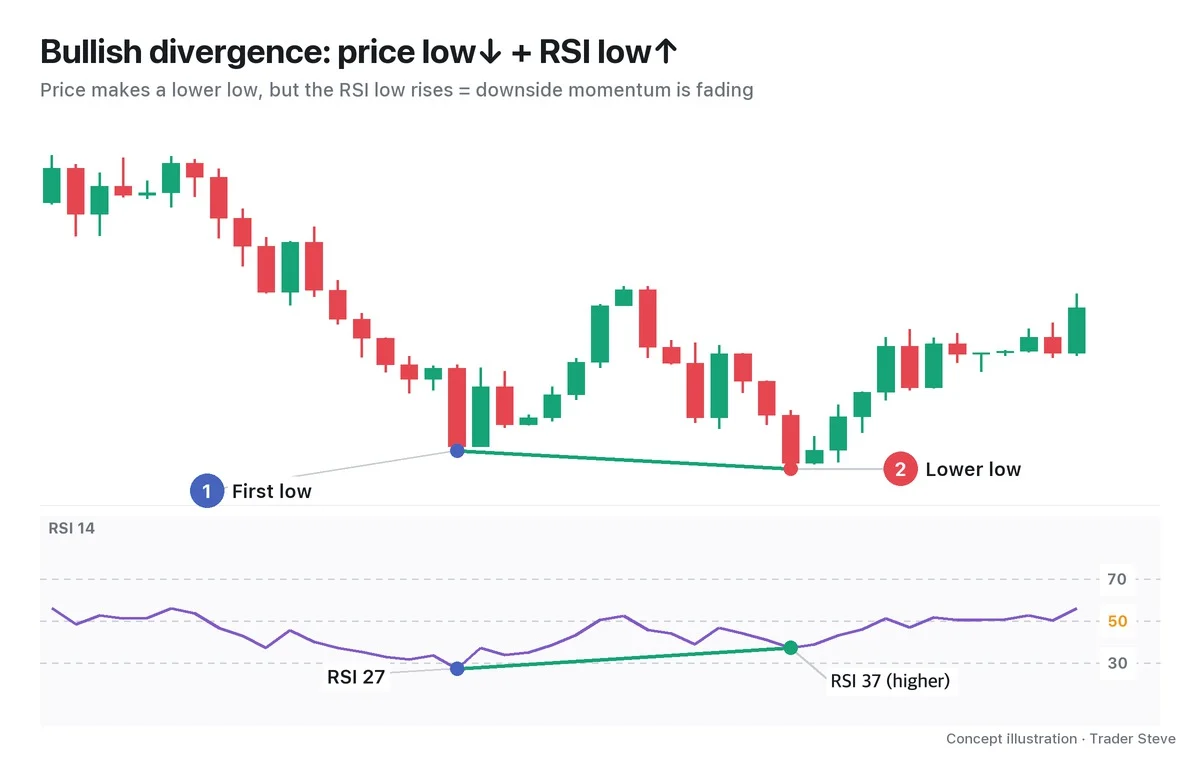
With Relative Strength Index (RSI) divergence you only watch one line, but MACD gives you two things to compare. The lower panel of charts 1 and 2 shows the blue MACD line together with the green and red bars (the histogram). Both can form divergences, and they behave differently.
| MACD line divergence | Histogram divergence | |
|---|---|---|
| What it compares | The gap = speed | The change in speed = acceleration |
| Timing | Late | Early |
| Frequency | Less often | More often |
| Character | Heavier; carries more weight on higher timeframes | An early warning, and wrong just as often |
Think of a car: the histogram shows you first that "the driver started braking," and the MACD line confirms later that "the car actually slowed down." That is why it matters whether the two say the same thing or different things. Cases where they disagree, and identification rules such as the histogram's zero-line reset, are covered in detail in Part 2.
5. Real Bitcoin: The Summer 2025 New High and a Weaker MACD
Let's look at a textbook bearish divergence on the real Bitcoin daily chart.
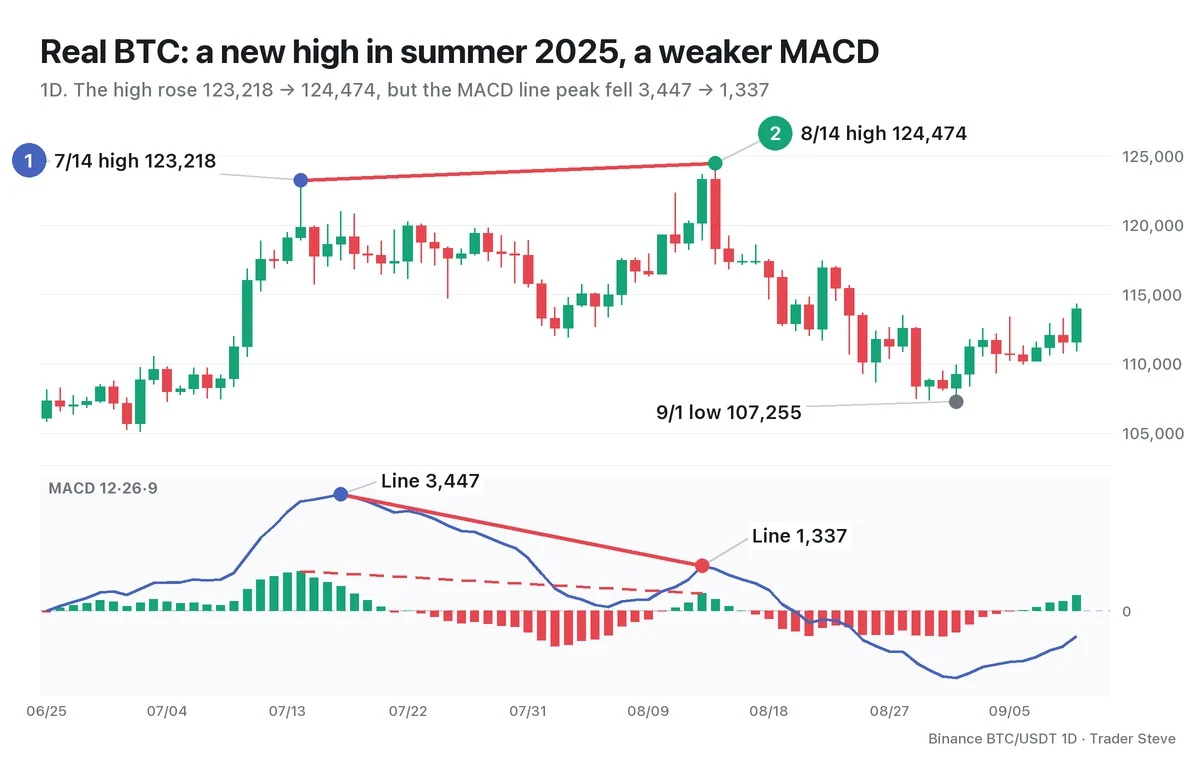
Bitcoin hit a high of 123,218 on Jul 14, 2025, and a month later, on Aug 14, it pushed the high 1.0% further to 124,474. Over the same period, the MACD line peak fell from 3,446.6 on Jul 17 to 1,337.4 on Aug 13 — 39% of the first one. The histogram peak also fell, from 1,176.1 on Jul 14 to 525.5 on Aug 13, so the line and the histogram said the same thing. Between the two peaks, there were also 20 days when the histogram closed below the zero line.
Price made a new high, but the speed of the rally that produced it was less than half of July's. Afterward, the Sep 1 low reached 107,255, 13.8% below the Aug 14 high.
6. A Signal That Momentum Faded, Not Proof of a Reversal
The example above is a reading made in hindsight. On Aug 14, all you could know was that a divergence was "in place"; nobody knew whether a decline would follow. In a strong trend, price can ignore divergence and keep going, again and again.
So read MACD divergence as a heads-up that momentum has faded, and make the actual decision only after checking price structure (higher lows or lower highs, a break of the last swing) and where your stop-loss goes. How to use confirmation signals and set the stop is covered in Part 3. For the principles all divergences share, see the Divergence Basics topic; for the same concept on RSI, see the Divergence RSI topic.
Key Takeaways
- MACD divergence is when price makes a new extreme but MACD fails to follow.
- Bullish = price low ↓ + MACD low ↑; bearish = price high ↑ + MACD high ↓.
- The MACD line is the gap between EMA12 and EMA26 — the speed of the trend. When the gap narrows, MACD goes less far even at a new extreme.
- There are two things to compare: the MACD line (speed; late and heavy) and the histogram (acceleration; early and frequent).
- It is only a signal that momentum has faded, not proof that price will turn.
In Part 2, we'll cover the difference between MACD line divergence and histogram divergence, the conditions for spotting them, and how to draw them. If checking MACD by hand across many assets and timeframes every time is a chore, the Omnisight Report below compiles it for each asset.
This lesson adapts the text, figures and live-stream quotes of the Trader Steve TA series for the web, translated from the original Korean. Check the text and figure captions for the timing and interpretation of each real example, and read conceptual diagrams and real charts separately.
Corrections: support@omnisight.report