What Is Triple Divergence? Double vs. Triple and Why They Form
Historical examples for learning · not current prices or trade recommendations.
Contents
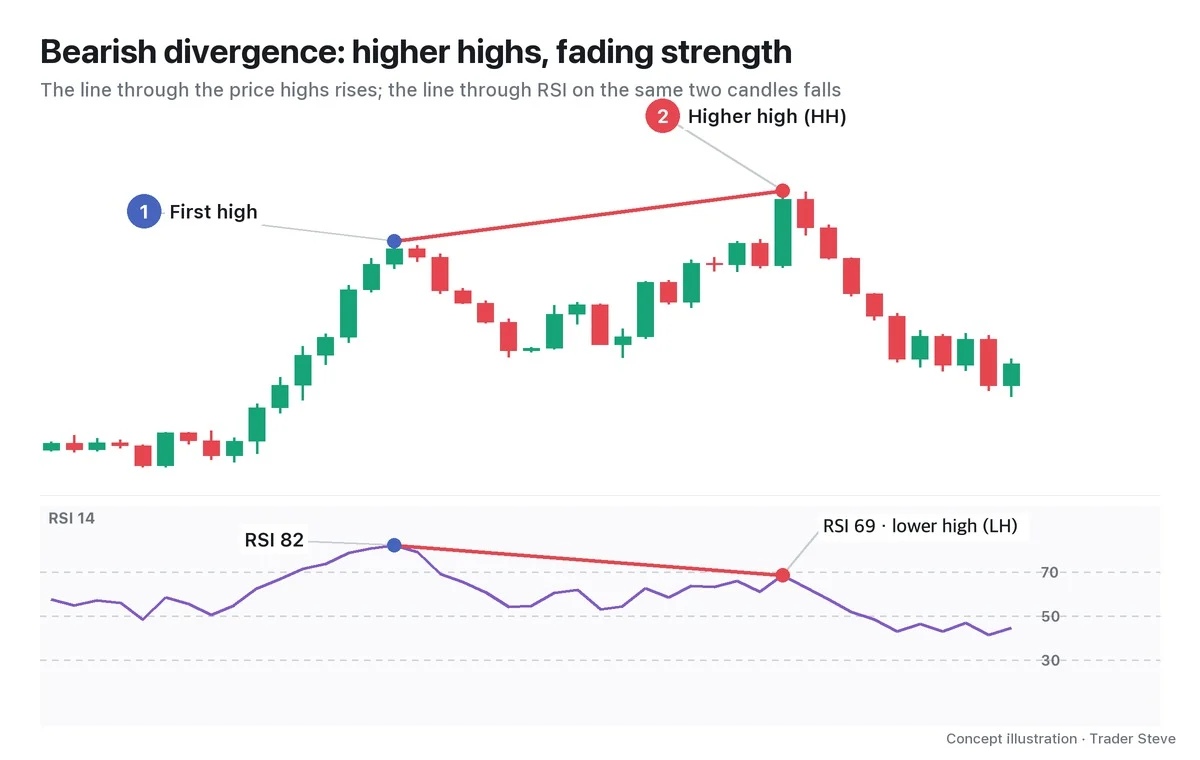
In an uptrend, price makes another higher high while the Relative Strength Index (RSI) below it prints another lower high. Once, that's an ordinary divergence. When it happens twice or three times in a row, the story changes a little. A run of divergences linked like a chain is called double divergence (2 links) or triple divergence (3 links). This lesson uses charts to show what double and triple divergence are, how they differ from regular divergence, and why they form.
All dates and times are Korea Standard Time (KST, UTC+9). A daily candle is dated by its 09:00 KST open, and intraday times are the open time of the candle on the timeframe shown.
1. The One-Line Definition: Price Keeps Extending, RSI Weakens Every Time
Double (2-link) and triple (3-link) divergence mean price keeps making new extremes in the same direction while the oscillator comes in weaker than its previous extreme every time. Every chart in this series uses RSI 14.
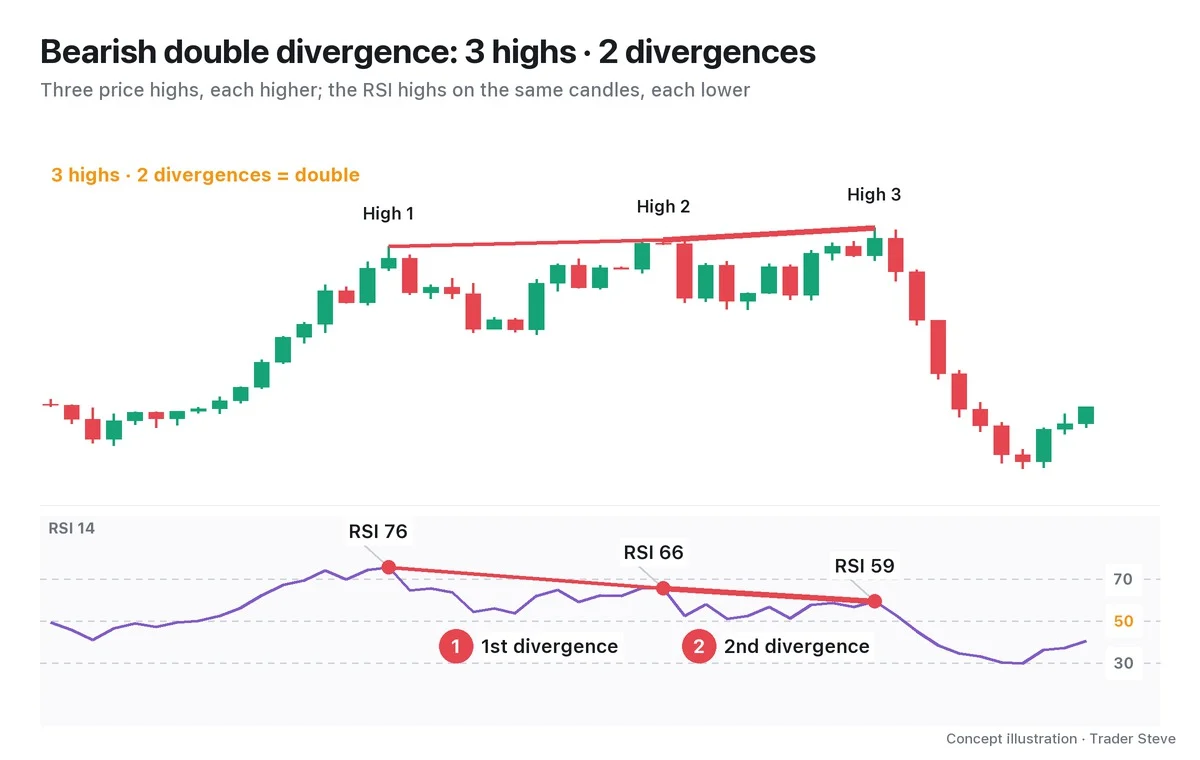
First, let's agree on how to count. This series counts how many divergences (links) form.
- Two highs that disagree once = 1 divergence = regular divergence
- Three highs rising in turn while the three RSI highs fall in turn = 2 divergences = double
- Four highs, 3 divergences = triple (a 3-link chain)
Some sources count swings instead and call "3 highs" a triple, so every chart here gives both numbers, as in "3 highs · 2 divergences" (Part 2 covers the difference in detail).
2. How It Differs From Regular Divergence
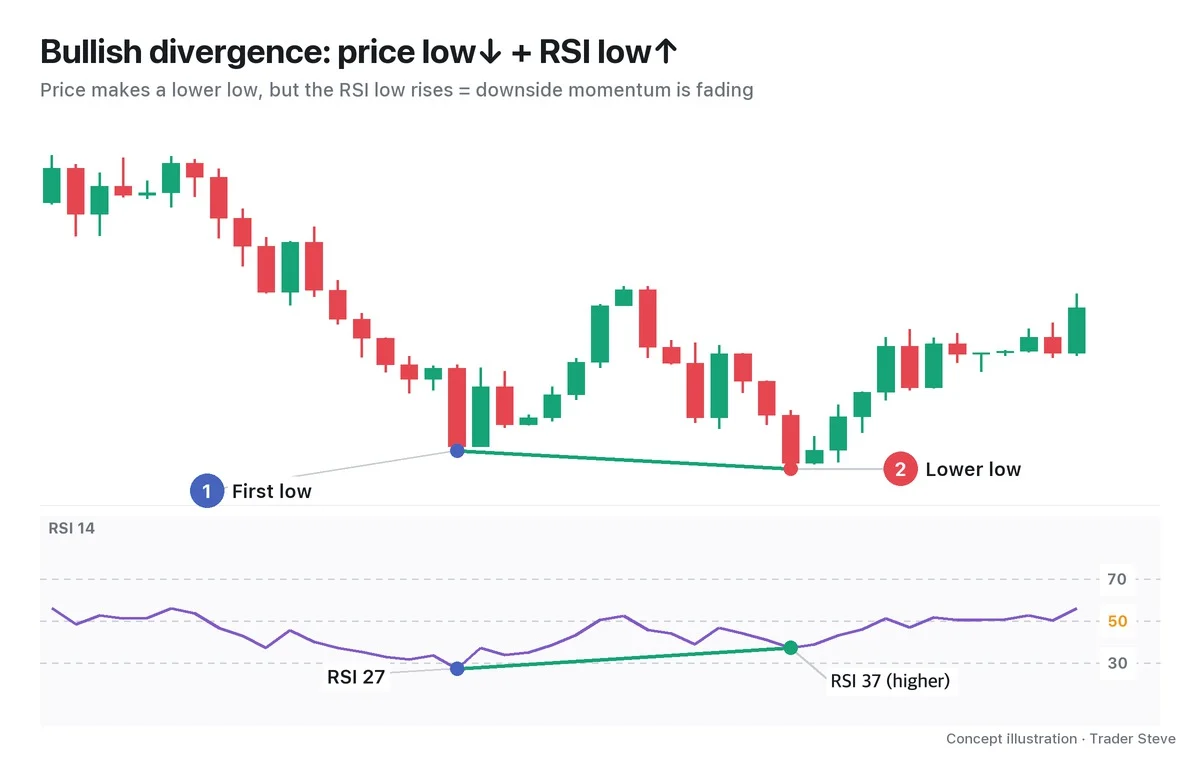
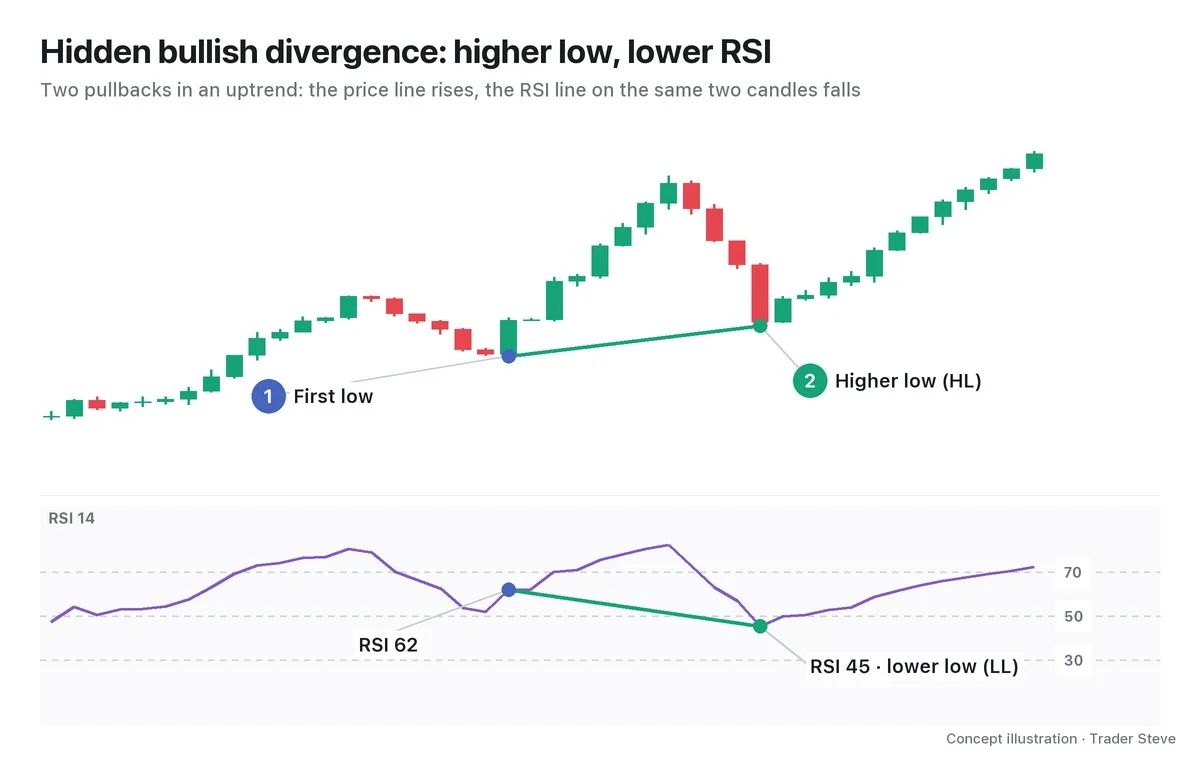
Regular divergence has one link; double and triple divergence extend that into 2 or 3 links. Like regular divergence, they come in two directions.
| Type | Price | RSI | Double (2 links) | Triple (3 links) |
|---|---|---|---|---|
| Bearish chain | highs keep rising | highs keep falling | 3 highs | 4 highs |
| Bullish chain | lows keep falling | lows keep rising | 3 lows | 4 lows |
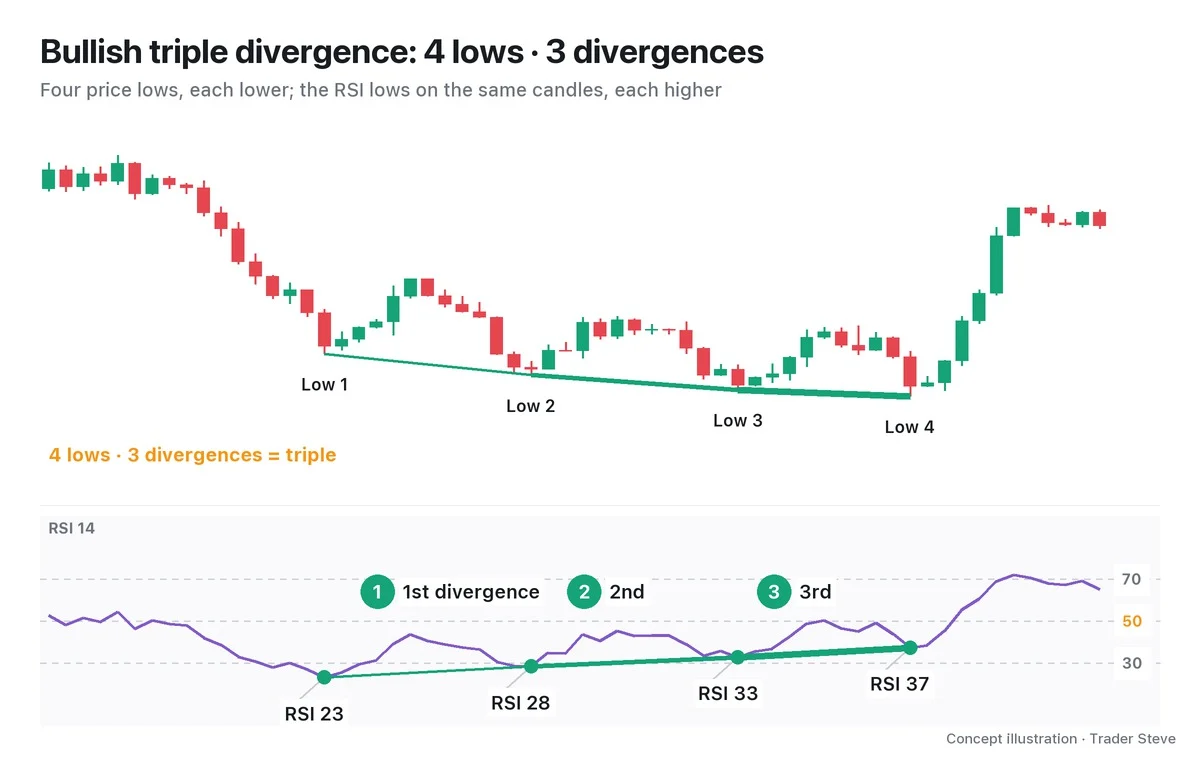
The key point is that each link re-checks the same conditions. Did price take out the previous point again? Is the RSI on that candle weaker than at the previous point again? Both must hold every time for the chain to continue. If RSI comes in stronger than the previous point at any step, the chain breaks right there (Part 2 covers which points to connect and when a chain fails). If the basic single-divergence shape is unfamiliar, start with Part 1 of the Divergence Regular lessons.
3. Why It Forms: Every Push Has Less Behind It
RSI measures the ratio of up moves to down moves over a recent period. So even when price makes a new high, if the distance it traveled to reach that high is smaller than last time, RSI can't climb as high as it did before.
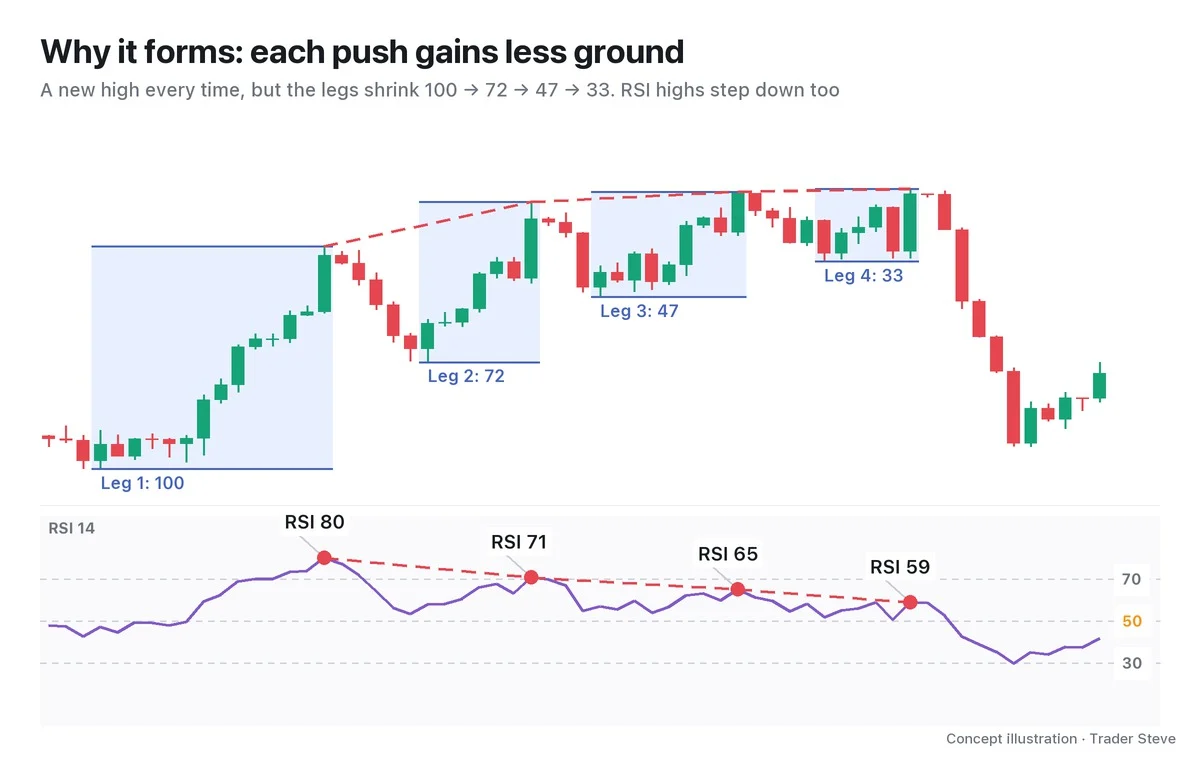
In an uptrend, this means fewer buyers step in with each push. Price still makes one more high thanks to momentum and liquidity: the stop-loss orders stacked above get triggered, and late buyers chase the new high. Price records the new high, but RSI records that the momentum behind it has weakened. In a downtrend it's the reverse: each wave of selling has fewer sellers behind it.
On a live stream, I explained the same thing while looking at a Nasdaq chart:
"The size of each rally and pullback — the amplitude — keeps shrinking… What's the core of it? The amount by which the highs and lows are stepping up keeps getting smaller. It just can't push very far." — Trader Steve, live stream, Oct 19, 2026 (translated from Korean) · ▶ Watch this moment (Short, Korean audio)
Each new link adds one more record of "pushed again, with less momentum." On the live stream I describe this as "the footing getting thinner and thinner."
4. What More Links Tell You — and What They Don't
More links means the weakened state has lasted that much longer. So a double reads as more trend fatigue than a single divergence, and a triple as more than a double.
But there are things the link count does not tell you.
- When the turn comes: a triple can stretch to 4 or 5 links while the trend keeps going, and a double can turn right away.
- Count rules like "the third one reverses": no such rule exists. The link count measures fatigue; it is not a timer.
That's why a chain is a warning, and a real signal is only complete once confirmation arrives. Confirmation means something like a structure break, with a close below the low between the last two extremes (for a bearish chain), or a break below RSI 50. Part 3 covers how to wait for confirmation, and Part 5 covers failures where the chain just kept getting longer without a turn.
5. Real Case: A Bearish Double (2 Links) on the 2025 BTC Weekly Chart
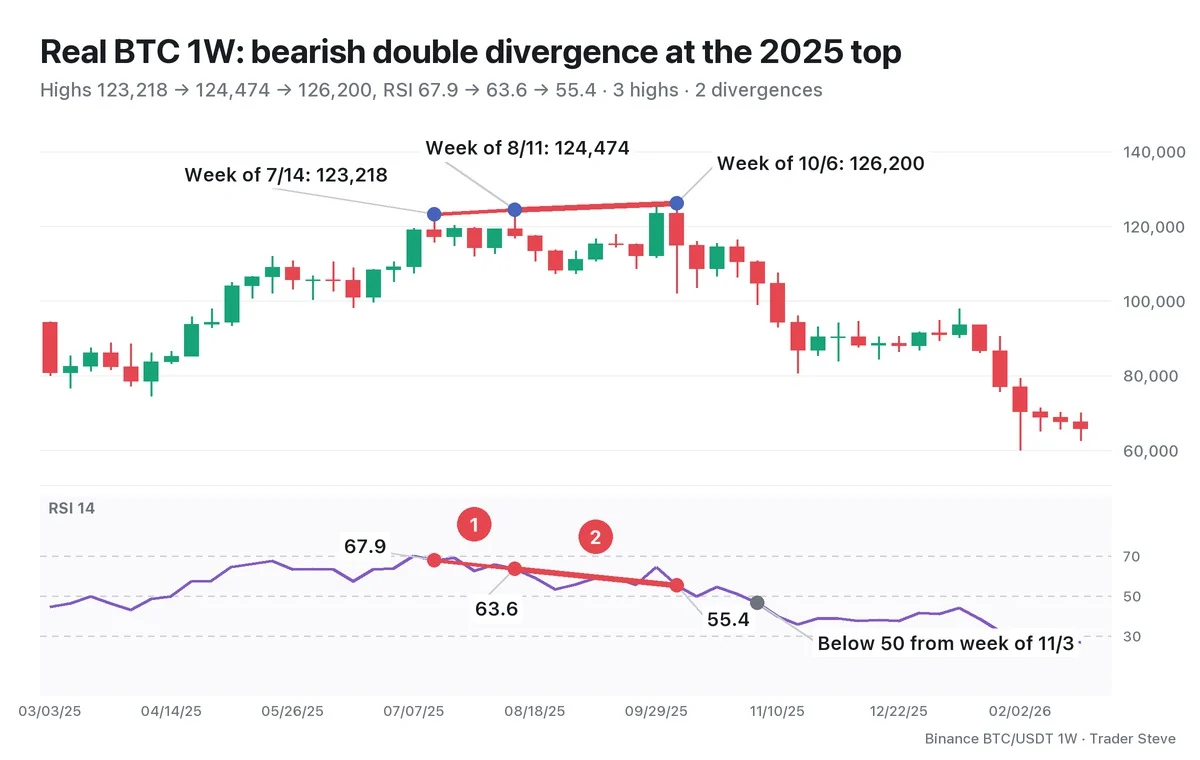
On the Bitcoin (BTC) weekly chart, the highs of the weeks of Jul 14, Aug 11 and Oct 6 rose in turn. Each step up was small: 1.0% and 1.4%. Meanwhile RSI for those same weeks fell twice in a row, 67.9 → 63.6 → 55.4. The earlier high in the week of May 19 (111,980) had an RSI of 67.5, lower than the week of Jul 14, so it is not where the chain starts.
The week of Oct 6 stands out. Intraweek, price reached 126,200 for a new all-time high, but in the same week it sank to 102,000 and closed at 114,959. RSI is calculated on closes, so that week's RSI came in at only 55.4. The very week that set the all-time high was the weakest one.
After that, weekly RSI closed the week of Oct 13 at 49.96, just under the 50 line, then climbed back above it; from the week of Nov 3 (46.6) it stayed below 50. Price fell to 60,000 in the week of Feb 2, 2026, -52.5% from the last high. But this is a record read in hindsight. In October, all anyone could know was that a chain "was in place." Nobody knew when or how far price would fall. For what the weekly RSI 50 line means, see the Basics Oscillators topic.
I covered a weekly chain like this on a recent live stream too. On the Oct 8, 2026 stream, looking at the Nasdaq weekly chart, I pointed out that "divergence is forming on the weekly, and forming again — the momentum of the rising waves keeps getting weaker." Five days later, on the live stream, I summed it up again:
"The Nasdaq kept pushing higher too, but RSI was rolling over hard. I've kept warning you about this since last week… When divergence is this strong on the weekly chart, it's hard for price to keep going up." — Trader Steve, live stream, Oct 13, 2026 (translated from Korean) · ▶ Watch the stream highlights (Korean audio)
The words here are "hard to keep going up." Not "it will definitely fall" — a warning to be careful because the weakened state is continuing.
Key Takeaways
- Double and triple divergence are 2 or 3 divergences in a row, linked like a chain. Price keeps making new extremes while RSI weakens every time.
- How to count: N highs (lows) = N-1 divergences. Three highs make a double (2 links); four make a triple (3 links).
- Each push covers less ground, so RSI steps down even as new extremes print.
- A triple (3 links) shows more trend fatigue than a double (2 links), but the link count doesn't tell you when the turn comes. There is no count rule.
- A chain is a warning; the signal is only complete with confirmation such as a structure break or RSI 50.
In Part 2, we'll cover how to find 2-link and 3-link chains (double and triple divergence) on a chart, which highs to connect and which to skip, and the failure criteria that break a chain. If counting by hand how many links a chain has across several markets and timeframes gets tedious, the Omnisight Report below organizes it for each market.
This lesson adapts the text, figures and live-stream quotes of the Trader Steve TA series for the web, translated from the original Korean. Check the text and figure captions for the timing and interpretation of each real example, and read conceptual diagrams and real charts separately.
Corrections: support@omnisight.report