What Is OBV Divergence? Meaning and How Volume Divergence Works
Historical examples for learning · not current prices or trade recommendations.
Contents
Sometimes price prints an all-time high and yet the move somehow looks out of breath. The oldest way to put a number on that "strength" is volume, and the indicator that accumulates volume into a single line is on-balance volume (OBV). This lesson uses four charts to show how OBV is calculated, why OBV divergence — when price and OBV tell different stories — happens, and what it looked like on a real Bitcoin (BTC) chart.
All dates and times are Korea Standard Time (KST, UTC+9). A daily candle is dated by its 09:00 KST open, and intraday examples are identified by the open time of the KST candle.
1. The One-Line Definition: Price Sets a New Record, Volume Retreats
Volume divergence is when price makes a new high (or a new low), but the volume behind that move is smaller than the volume behind the move before it. Price is moving forward, but fewer coins changed hands. Whether the number of participants or the traded value also fell can only be judged with separate data.
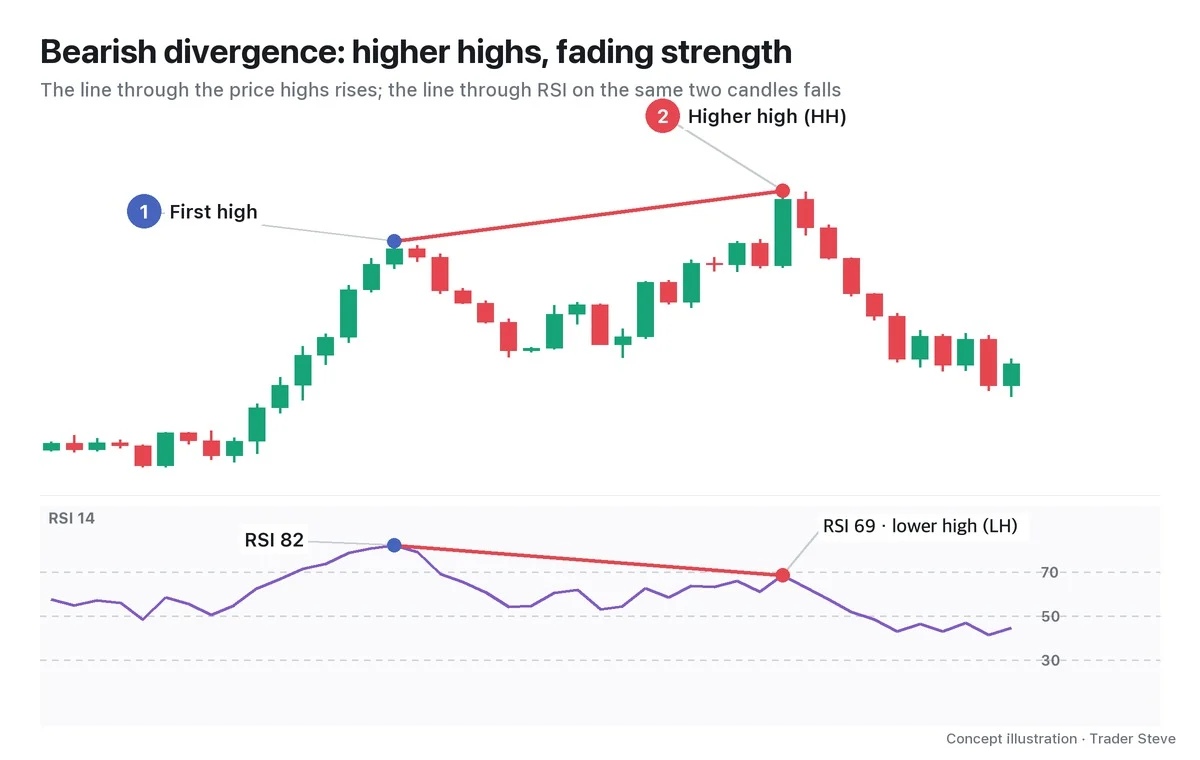
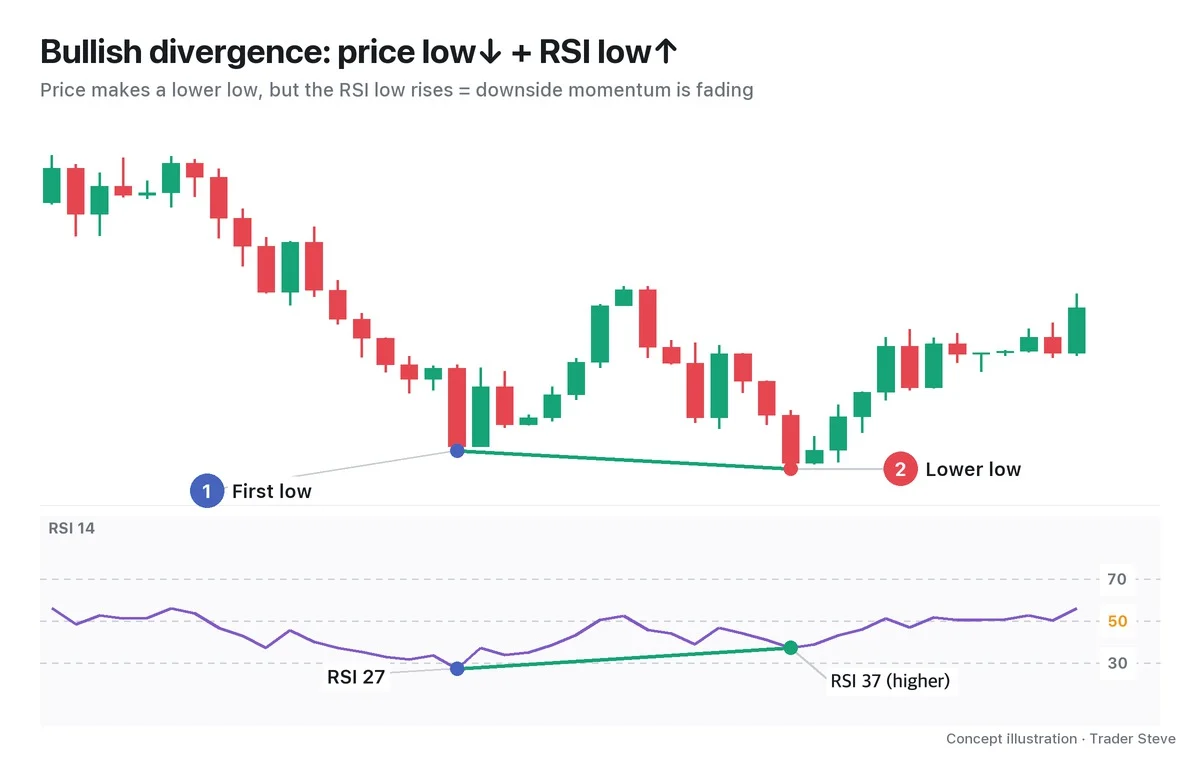
Instead of eyeballing this on a bar chart, you can compare it with numbers on the same candles as the price swings — that is what OBV is for. When the OBV values on the same candles as the price swings point in the opposite direction from price, it is called OBV divergence.
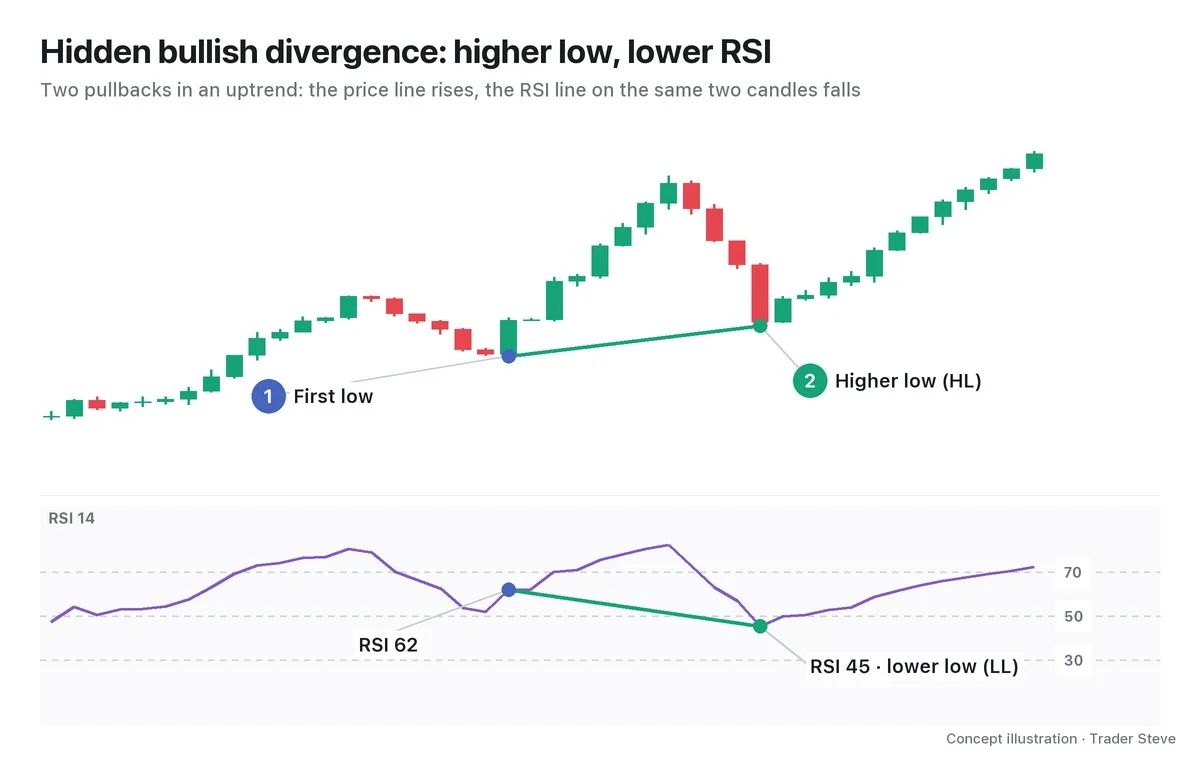
The basic principle of divergence between price and an oscillator such as the Relative Strength Index (RSI) was covered in Divergence Basics (related lesson), and reading volume bars was covered in Basics Volume (related lesson). This lesson combines the two.
2. What OBV Is: One Rule for Adding and Subtracting
OBV is an indicator Joseph Granville introduced in a 1963 book. It has just one calculation rule.
- If the close is higher than the previous candle's close → add that candle's volume
- If the close is lower than the previous candle's close → subtract that candle's volume
- If the close is unchanged → leave OBV as it is
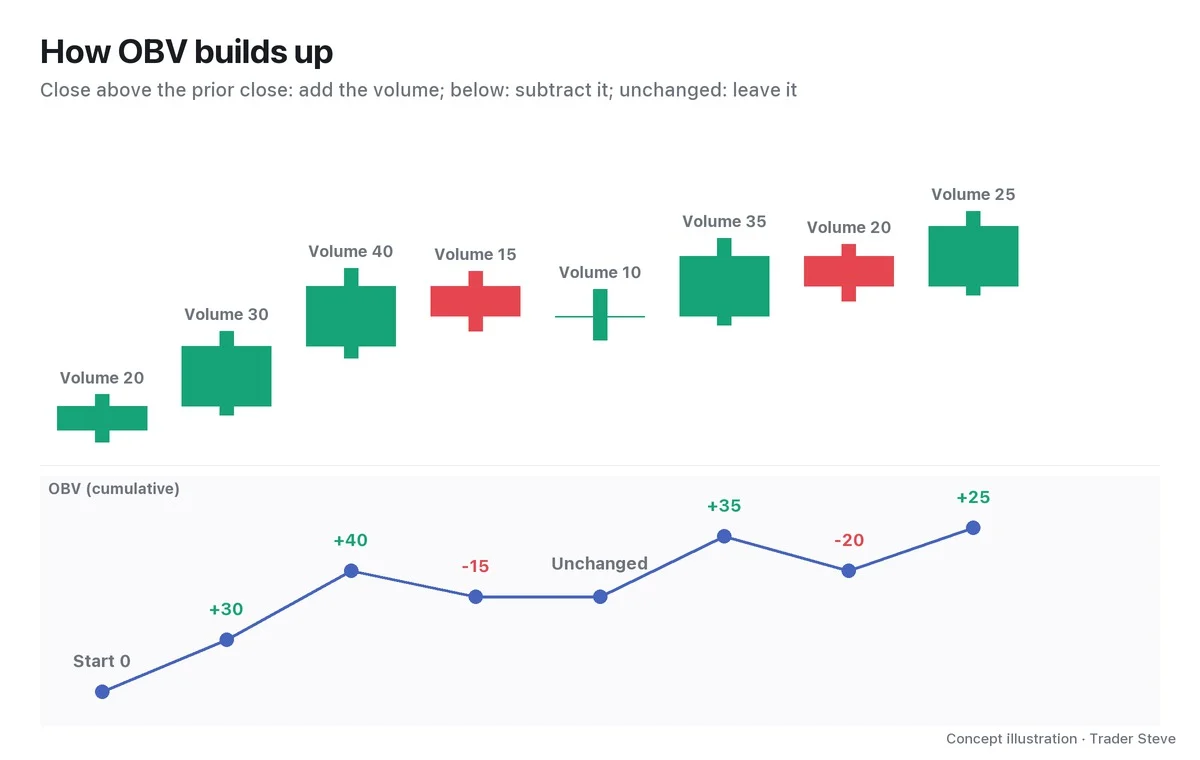
If you set the first candle to 0, OBV builds up as 0 → 30 → 70 → 55 → 55 → 90 → 70 → 95. An up candle carrying volume 40 pushes OBV up a lot, while a down candle with volume 15 trims it only a little. In other words, OBV turns a simple idea into one line: it leans toward the side where more volume traded.
There is one thing you must know here: the OBV number itself means nothing. The whole series shifts up or down depending on when you started adding. That's why every chart in this series resets the first candle of the chart to 0, and the labels show only the difference between two points (ΔOBV). You look at two things only: the direction of OBV, and whether OBV is higher or lower on the same candles as the price swings.
3. Why Volume Turns First
Price can print a new high with a single final trade. But if fewer coins traded on the way up to that high, the strength to absorb the sell orders stacked above shrinks as well. On the live stream I describe this scene with words like "buying pressure" and "volume" rather than the name OBV. Here is what I said while looking at the Hyperliquid (HYPE) 12-hour chart.
"The closer it gets to the high, the less volume is coming in. The new high came at a point where fewer people are buying, which means a lot of people are dumping size up there." — Trader Steve, live stream, Aug 28, 2026 (translated from Korean) · ▶ Watch the stream highlights (Korean audio)
There are two broad reasons volume shrinks at a new high.
- Fewer coins are trading: at higher prices, traders hesitate to chase. With fewer trades needed to climb the same distance, even a little selling can push price back down.
- Early buyers have started taking profits: if those who bought during the earlier rally hand off their size near the high, price may look like it is holding, but the volume on up candles shrinks and the volume on down candles grows. OBV reflects that difference directly.
While reading a line from a Bitcoin report, I broke it down like this.
"The indicator of the strength pushing the rally up was actually lower. What does that mean? It's turning into a divergence. The buying pressure here has come down a lot from the buying pressure back here — it means a lot of people are taking profits." — Trader Steve, live stream, Aug 25, 2026 (translated from Korean) · ▶ Watch the stream highlights (Korean audio)
4. Two Kinds of OBV Divergence: Bearish and Bullish
They split into two by direction (this is regular divergence, which warns that the price trend is weakening).
| Type | Price | OBV on the same candles | How to read it |
|---|---|---|---|
| Bearish OBV divergence | high ↑ | high ↓ | Between the two points, total volume on down-close candles is larger |
| Bullish OBV divergence | low ↓ | low ↑ | Between the two points, total volume on up-close candles is larger |
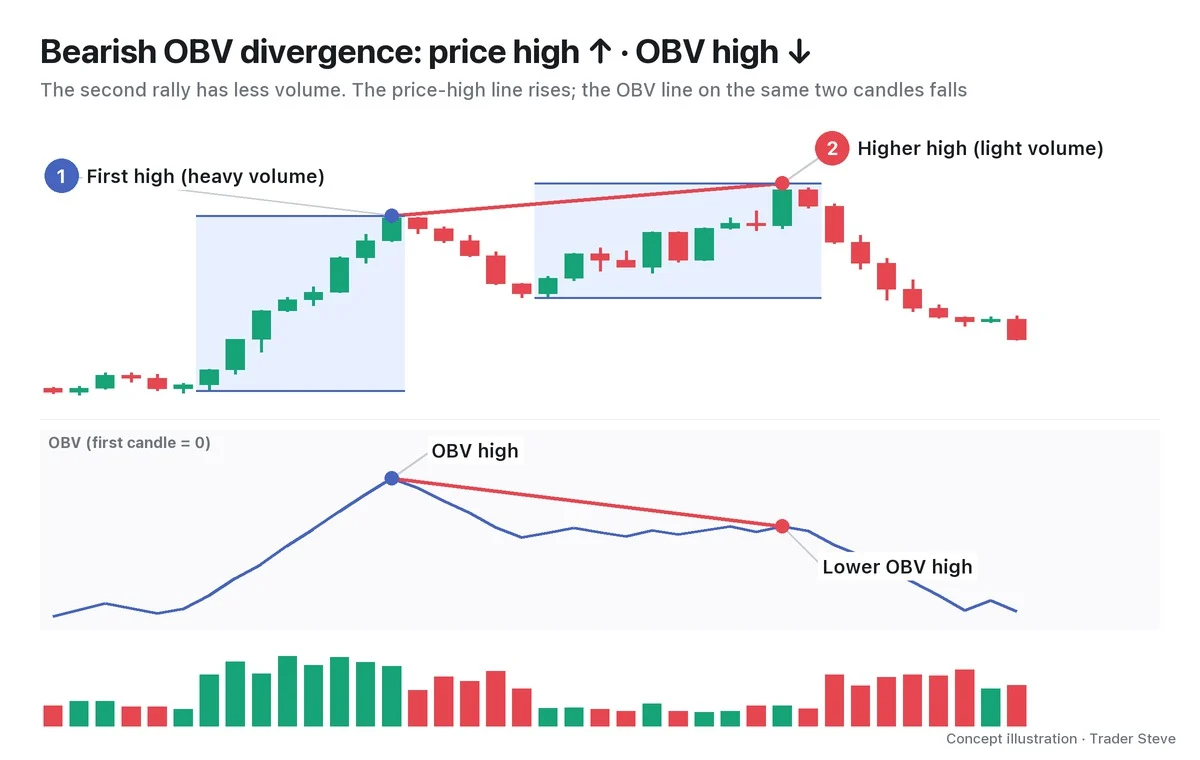
The first rally climbs on high-volume candles, so OBV rises steeply too. After the pullback, the second rally goes a little further in price, but each candle carries less than half the volume. So the line connecting the price highs slopes up while the line connecting the OBV highs slopes down.
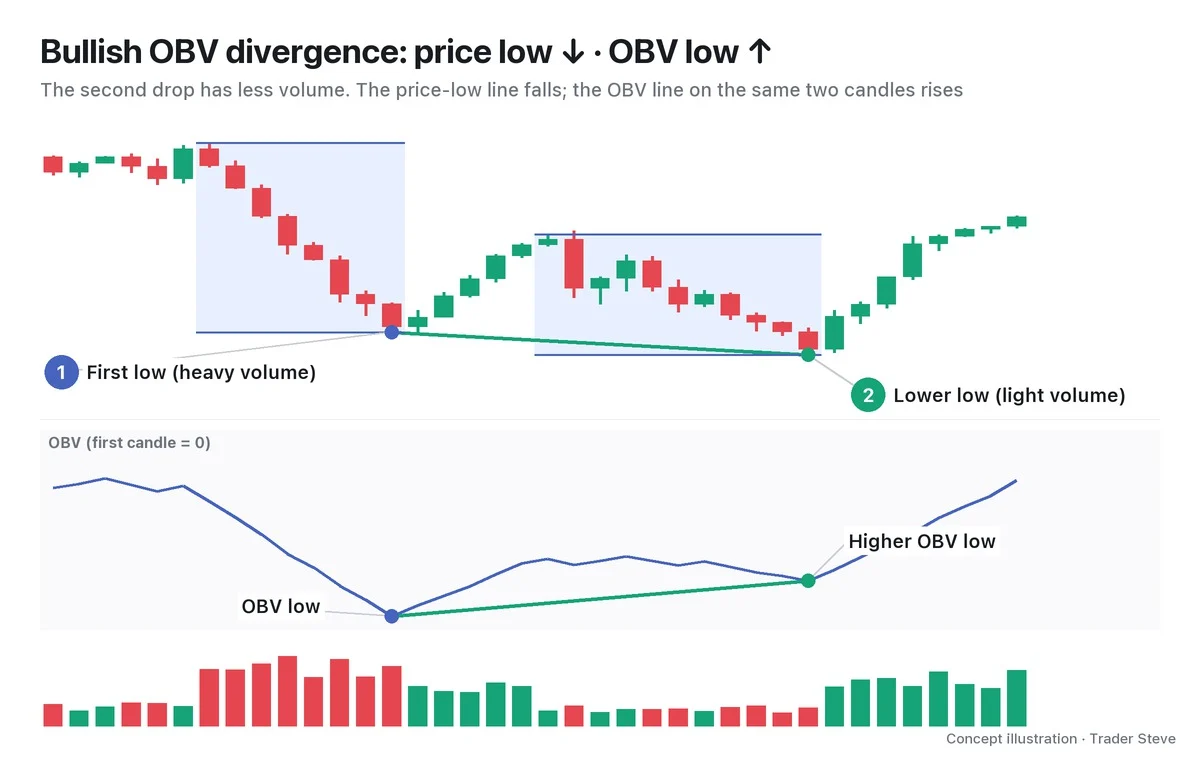
In both charts, the rule for drawing the lines is the same: pick two price swings first, then compare the OBV values on those two candles. You do not separately hunt for the highest and lowest points on the OBV line and connect those. How to pick the swings, and how large the difference must be to count as divergence, are set out with numbers in Part 2.
5. Real BTC: Price Fell 8% Further, but OBV Rose
This is the Bitcoin daily chart in the spring of 2025.
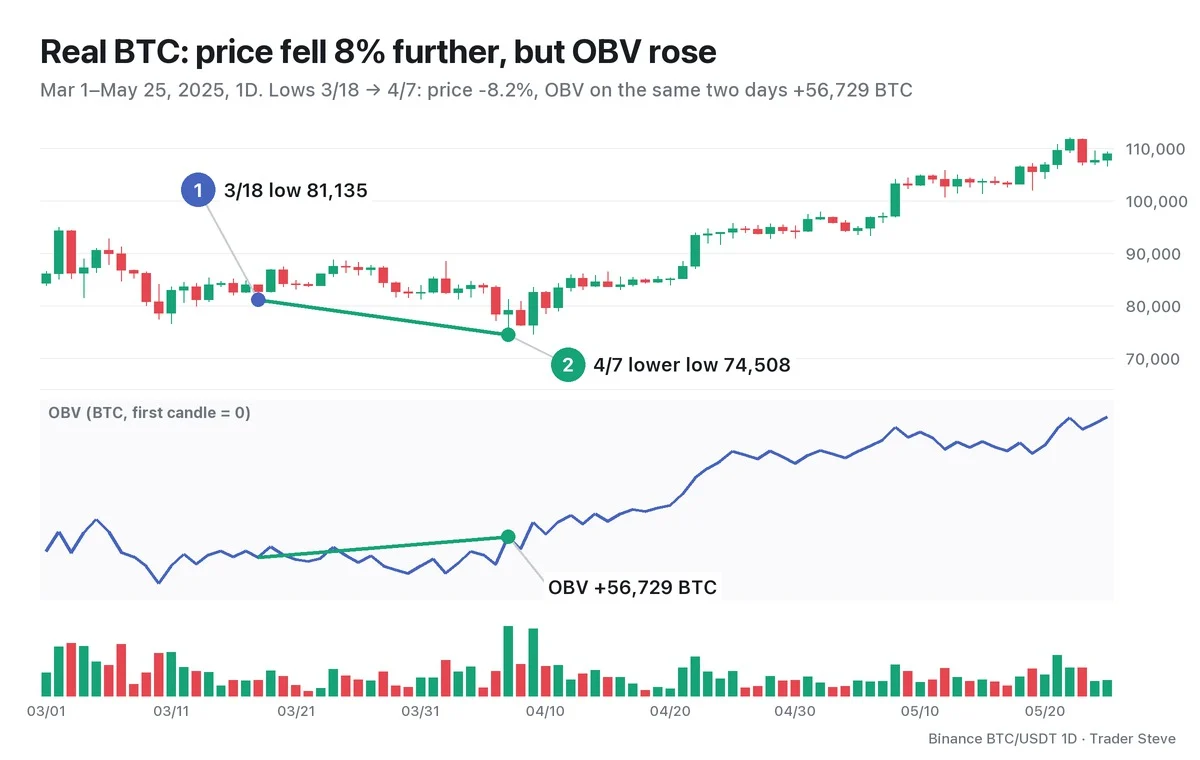
- Price: Mar 18 low 81,134.66 → Apr 7 low 74,508.00; the low came in 8.17% lower.
- OBV: +56,729 BTC between the same two days. Divided by the 20-day average volume as of Apr 7, that's about 2.4 times a normal day's volume added to OBV.
- RSI: fell as well, 42.6 → 38.4. If you had looked only at RSI, you would see no divergence here.
The candle to watch is Apr 7. Volume that day was 78,388 BTC, 3.3x the 20-day average (23,486 BTC). Price was hit hard intraday, but the close (79,163.24) ended above the previous day's close (78,430.00), so that entire heavy volume was added to OBV. On a day of panic selling, OBV kept a trace that someone had absorbed that supply.
What happened next is noted only as a record. On Apr 9, OBV rose above the highest OBV reading between the two lows for the first time (that day's close: 82,615.22), and on May 22 price reached a high of 111,980, 50.3% above the Apr 7 low. But this is the outcome of one past chart. OBV divergence is a warning that "momentum has faded," not a confirmed signal that the direction will change.
The OBV difference between two points is the total volume of up-close candles in between minus the total volume of down-close candles. Actual aggressive buying and selling volume is checked separately with trade data or cumulative volume delta (CVD), and shrinking volume on a down leg is also calculated separately over a defined range.
Key Takeaways
- Volume divergence is when price makes a new high (low), but the volume behind that move shrinks.
- OBV is a cumulative line that adds the volume when the close rises, subtracts it when the close falls, and leaves it unchanged when the close is flat.
- The absolute value of OBV changes with the starting point, so you look only at how high or low it is on the same candles as the price swings (ΔOBV).
- Bearish OBV divergence is a higher price high with a lower OBV high; bullish OBV divergence is a lower price low with a higher OBV low.
- OBV sometimes speaks first while RSI is quiet, but it is only a warning; confirmation is checked separately.
In Part 2, we'll cover how to pick price swings, how many candles' worth of volume the difference must be to count as divergence, the four regular and hidden types, and the confirmation criteria.
Doing this comparison by hand for every market takes a fair amount of time. The Omnisight Report lays out the evidence from several perspectives, divergence included, for each market.
This lesson adapts the text, figures and live-stream quotes of the Trader Steve TA series for the web, translated from the original Korean. Check the text and figure captions for the timing and interpretation of each real example, and read conceptual diagrams and real charts separately.
Corrections: support@omnisight.report