What Is Regular Divergence? Bullish and Bearish Divergence Explained
Historical examples for learning · not current prices or trade recommendations.
Contents
You've probably seen it: price clearly prints a new low, yet the Relative Strength Index (RSI) under the chart doesn't fall as far as it did last time. When price and an indicator point in different directions like this, it's called divergence, and the basic form that shows up where a trend may be turning is called regular divergence. This lesson uses charts to explain what bullish and bearish divergence are, why they form, and how to read them on a chart.
All dates and times are Korea Standard Time (KST, UTC+9). A daily candle is dated by its 09:00 KST open, and intraday examples are timed by the open of the KST candle.
1. The One-Line Definition: Price and the Indicator Go Different Ways
Divergence literally means "moving apart." Price makes a new extreme in one direction (a new low or a new high), but the oscillator that measures the momentum behind that move doesn't follow. Every chart in this series is drawn with RSI 14, the setting I use by default.
"Bullish divergence is when price is moving like this, but RSI, way down below, is actually going up like this — that's bullish divergence. Price is going down, but the share of people buying is growing. What does the word divergence mean? It means this one and this one are different. When price and the indicator that shows the actual trend of buying move differently, that's called divergence." — Trader Steve, live stream, Oct 14, 2026 (translated from Korean) · ▶ Watch the stream highlights (Korean audio)
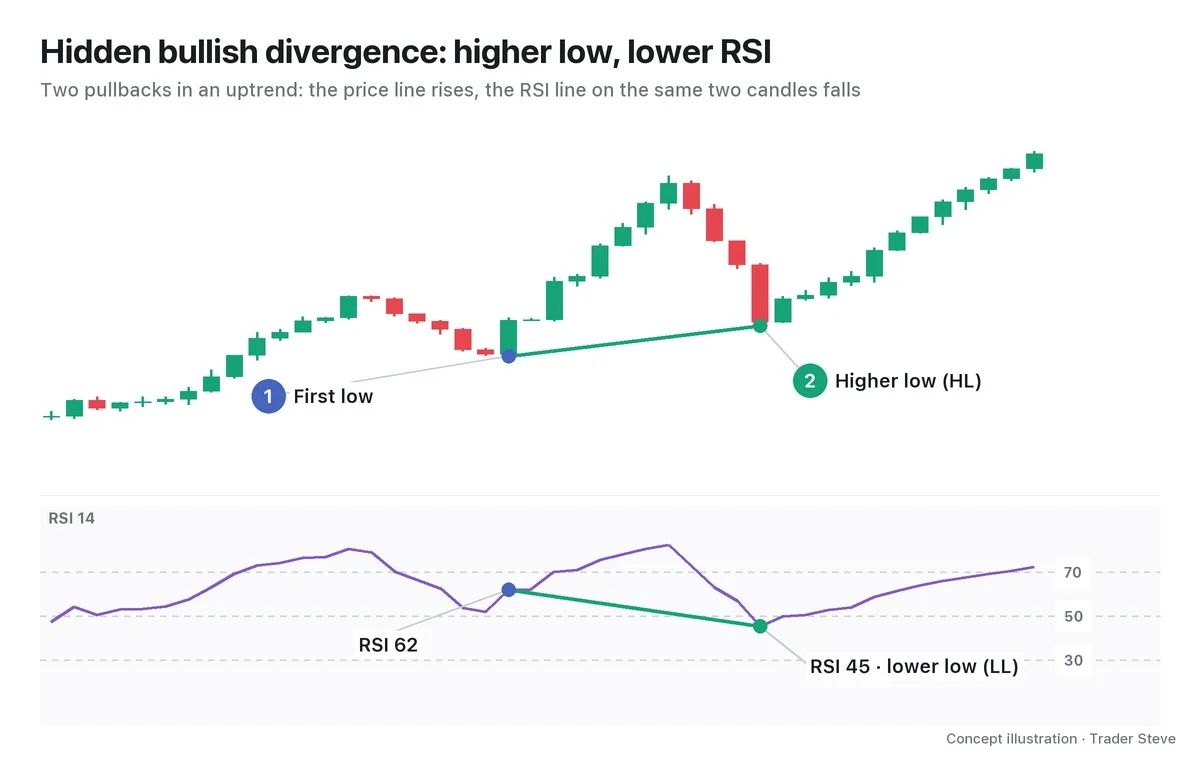
Textbooks also call regular divergence classic divergence. The opposite shape, which appears while a trend continues, is called hidden divergence and is covered separately. This topic deals with regular divergence only.
2. Bullish Divergence: Lower Price Lows, Higher RSI Lows
You look for regular bullish divergence (Bull Div) in the late stage of a downtrend. Price has made a lower low (LL) than its first low, but RSI on those same two candles has made a higher low (HL).
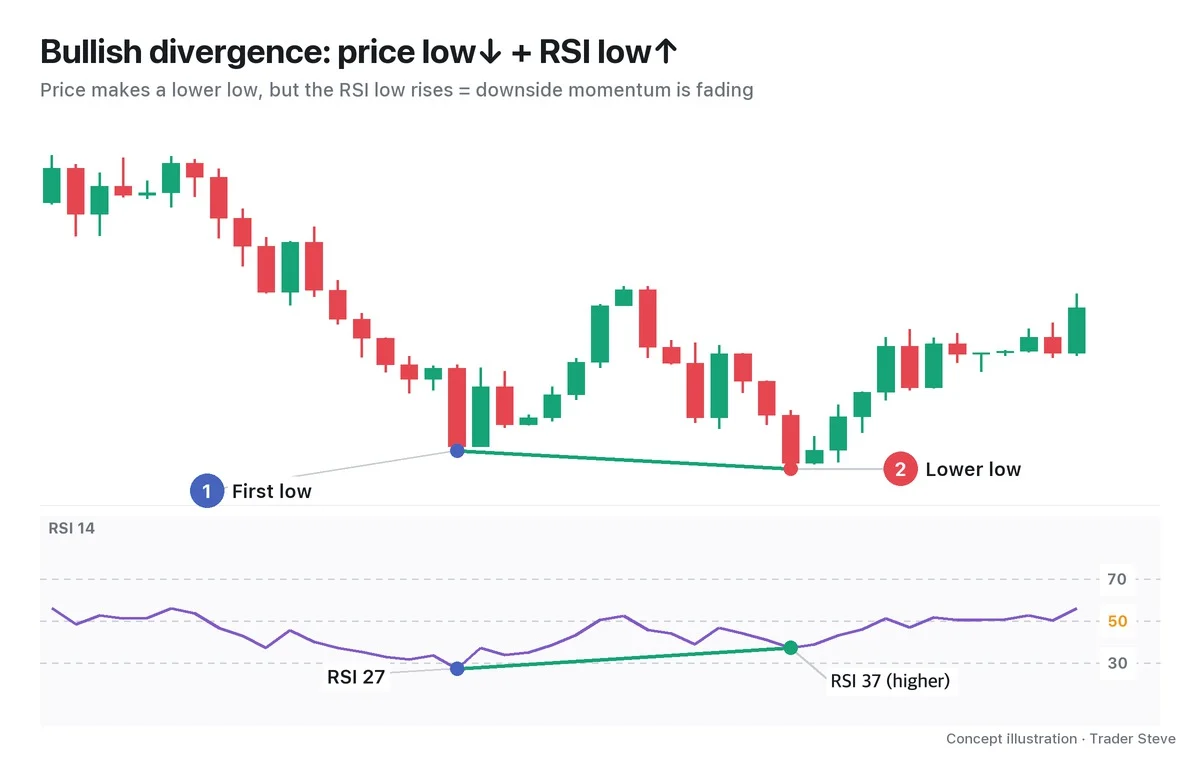
In the chart, the green line on price slopes down while the green line on RSI slopes up. Two lines spreading apart — that is what divergence looks like. Price alone reads as "another new low." Add RSI and it reads as "a new low, but the selling pressure pushing price down is weaker than last time."
The key point: you compare two price swing lows with the RSI values on exactly those two candles. You don't connect random RSI troughs that have nothing to do with the price lows. Part 2 lays out the exact identification conditions and the rules for drawing the lines.
3. Bearish Divergence: Higher Price Highs, Lower RSI Highs
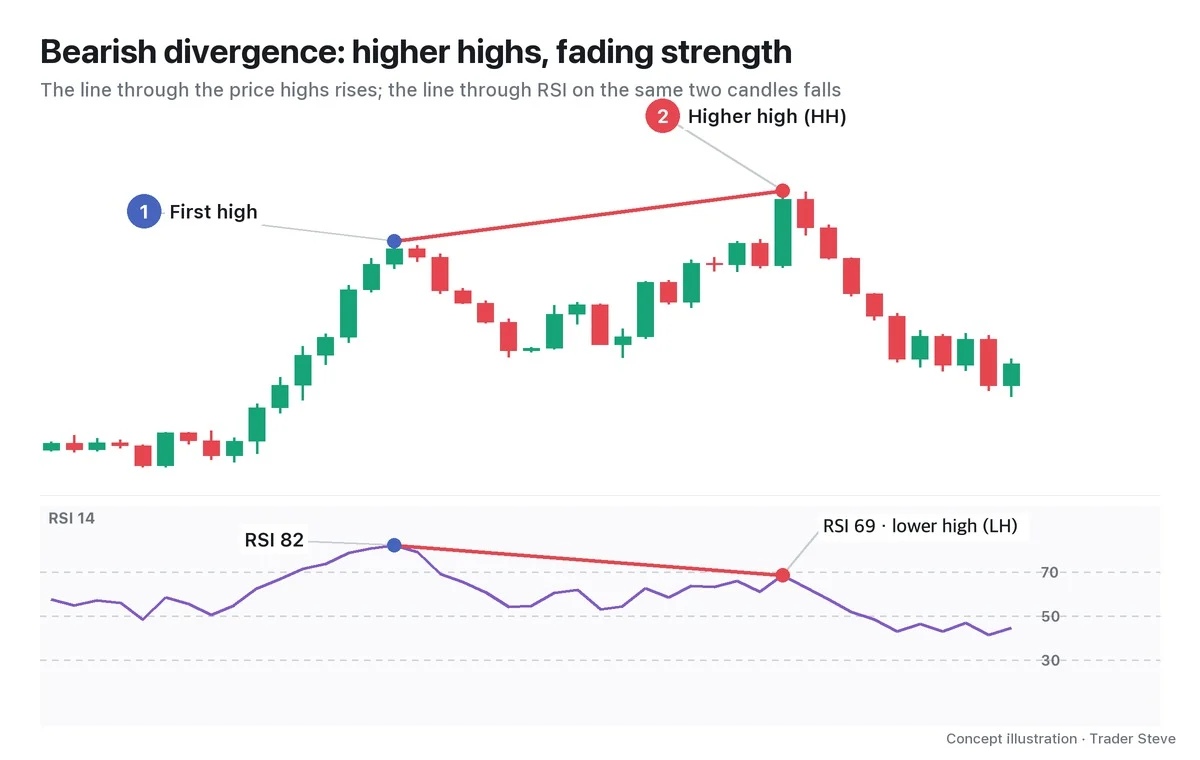
Regular bearish divergence (Bear Div) is the exact mirror image. In the late stage of an uptrend, price makes a higher high (HH), but the RSI high is a lower high (LH).
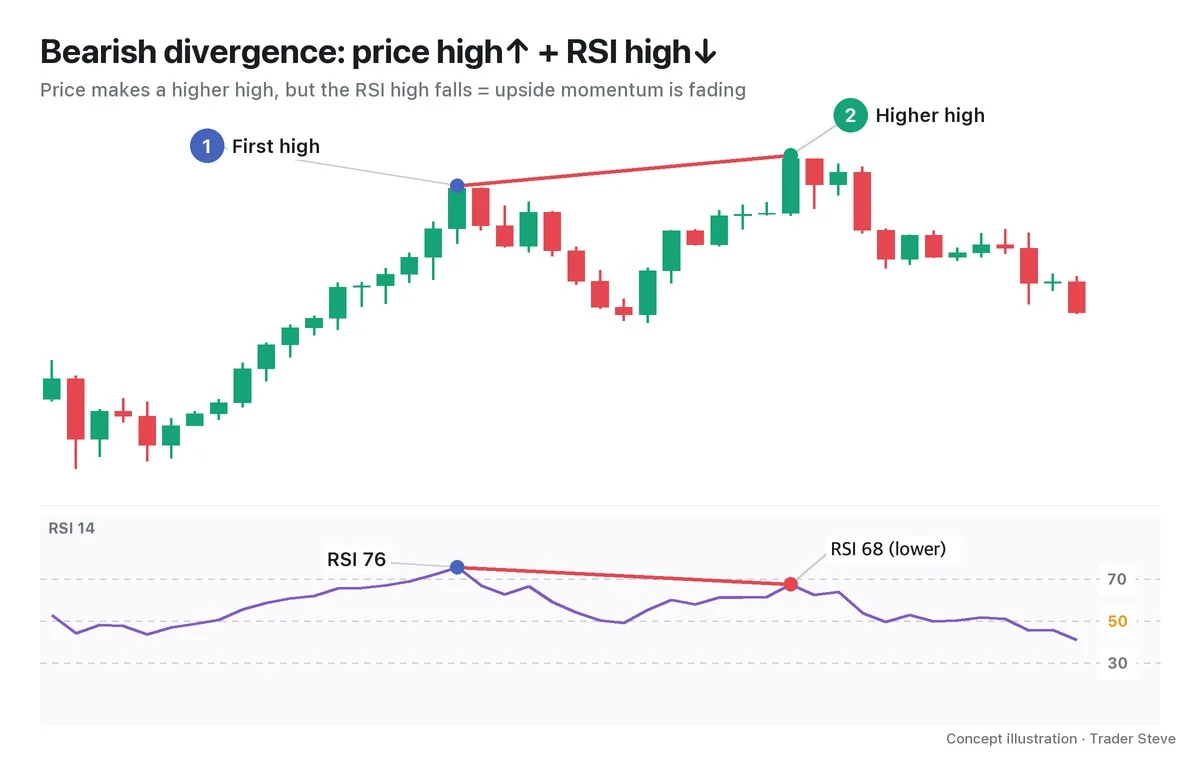
"What's bearish divergence? Price keeps going up. But RSI's highs are coming down. The highs in price are going up, but the highs in RSI buying pressure are going down." — Trader Steve, live stream, Oct 14, 2026 (translated from Korean) · ▶ Watch the stream highlights (Korean audio)
Side by side, the two look like this.
| Type | Price | RSI | Where it appears | Meaning |
|---|---|---|---|---|
| Bullish divergence | low lower (LL) | low higher (HL) | late stage of a downtrend | downside momentum is fading |
| Bearish divergence | high higher (HH) | high lower (LH) | late stage of an uptrend | upside momentum is fading |
On the live stream, this state is described as "a divergence has formed," and this series uses the same expression.
4. Why It Forms: The Size of the Move Shrinks
The Relative Strength Index (RSI) compares the average size of the up moves with the average size of the down moves over the last 14 candles. If the down moves are far larger than the up moves, RSI approaches 0; if the up moves are larger, it approaches 100. So what RSI measures is not "how low is price?" but "how hard has price fallen recently?"
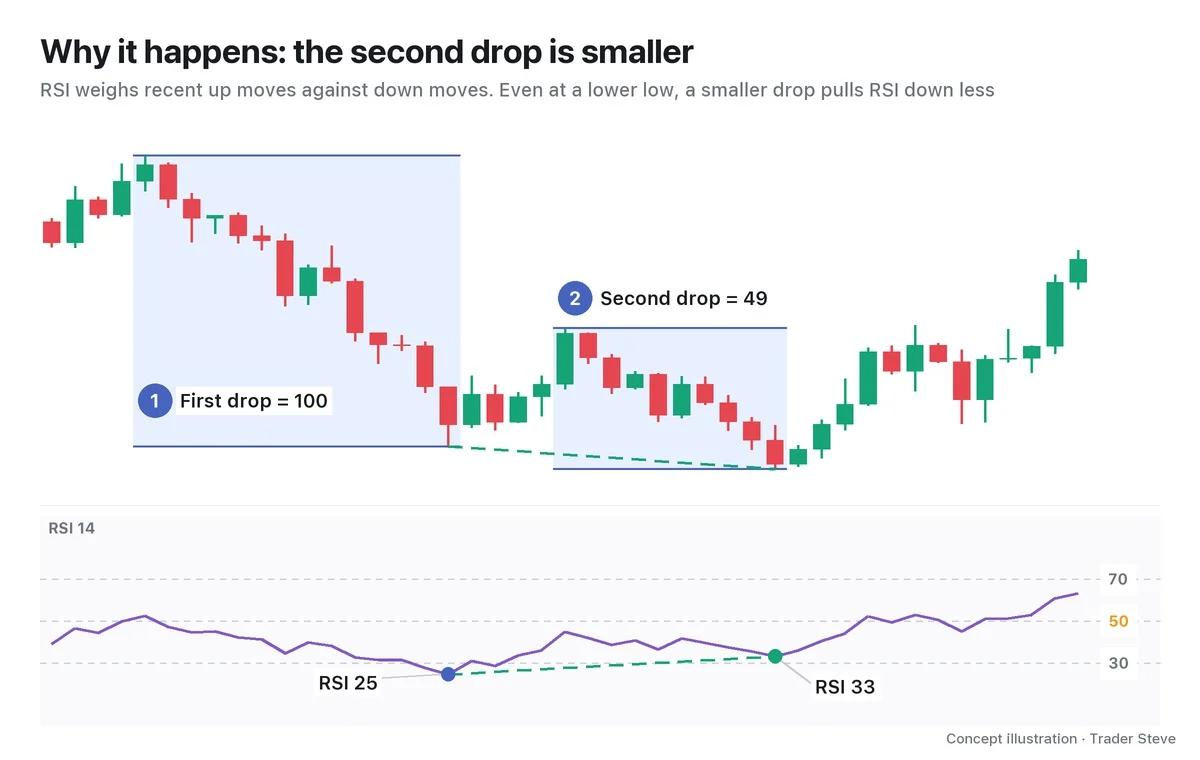
The two blue boxes in the chart show the size of the first drop and the second drop. Because the second drop starts from the point where price had bounced, it made a lower low but covered only about half the distance of the first, and it fell more slowly per candle. Meanwhile, the bullish candles from the bounce are still mixed into the 14-candle average. That's why price is at a new low while RSI stops above its previous low.
In short, regular divergence is a sign that a new extreme has printed, but the move behind it is decelerating. Sellers are still dragging price lower, just without the momentum they had last time. For more on the RSI formula and the principle of deceleration, see the Divergence Basics topic together with Basics Oscillators, which covers RSI and Moving Average Convergence Divergence (MACD).
5. A Real Bitcoin Bottom: A Warning That Flags a Turning-Point Candidate
Divergence matters because it lets you confirm, in numbers, where a trend may be turning.
"I think divergence is pretty much the only way we can confirm an actual turn in the trend as a fact." — Trader Steve, live stream, Sep 2, 2026 (translated from Korean) · ▶ Watch the stream highlights (Korean audio)
Let's check it on a real Bitcoin daily chart.
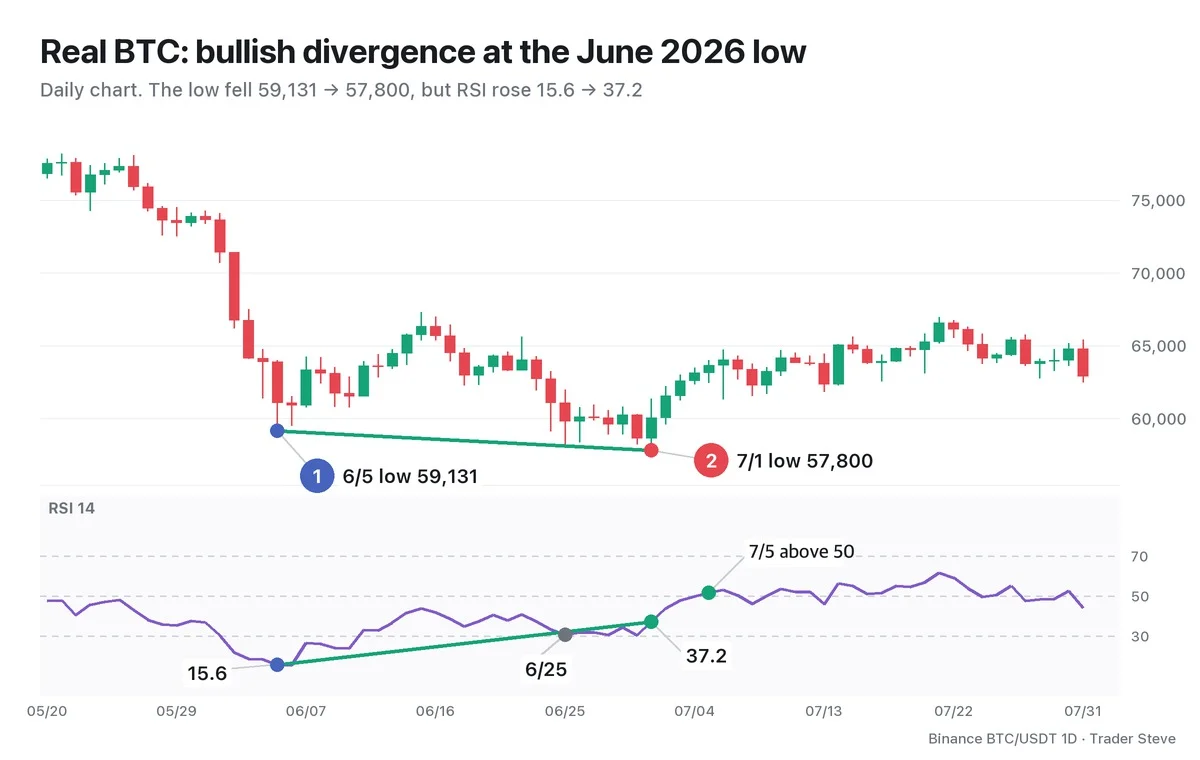
After a sharp sell-off from late May, Bitcoin hit a low of 59,131 on Jun 5. RSI was 15.6, far below the oversold line at 30. 26 days later, on Jul 1, price made a low of 57,800, 2.3% lower — but RSI was 37.2, 21.6 points higher. New low in price, recovering strength: a textbook bullish divergence. The low in between on Jun 25 (58,115, RSI 30.5) points the same way, but divergence that repeats three or more times is covered in the Divergence Multiple topic (double and triple divergence).
Afterward, RSI closed above 50 for the first time on Jul 5 (51.7), and through the end of July the low never went below 59,588, so the Jul 1 low held. But that's a reading made in hindsight. On Jul 1 itself, all you could know was that a divergence had formed; nobody knew whether a bounce would follow.
That's why divergence is a warning, not an entry signal. It only flags a "candidate" for a turning point. A divergence forming doesn't mean price bounces or drops right away. In a strong trend, price can ignore the divergence and keep pushing — on the live stream, this is described as price "chewing through the divergence and climbing anyway." So you look for confirmation alongside it, such as a break of structure or RSI reclaiming the 50 line. Part 3 covers how to enter after confirmation, and Part 5 covers the cases where divergence fails.
By default, this series' comparison tables and statistics use the indicator value on the same candle as the confirmed price swing. Connecting the indicator's extreme within a few candles of the swing (±2 candles for RSI, ±3 for MACD) is kept separate as the 'nearby-extreme variant', and when it's used, both the price time and the indicator time are stated. The same-candle rule is covered in Divergence Basics Part 2 (related lesson).
This is the same 6/5 → 7/1 daily chart as in Divergence Basics Part 1; here I read it for the warning and the confirmation timing of a regular bullish divergence.
Key Takeaways
- Regular divergence is when price makes a new extreme but RSI doesn't follow.
- Bullish divergence = price low↓ + RSI low↑; bearish divergence = price high↑ + RSI high↓.
- Always compare two price swing points with the RSI values on the same candles.
- Even at a new extreme, if the size and speed of the move shrink, RSI moves less. That is the principle behind divergence.
- It is only a warning that flags a turning-point candidate, not an entry signal on its own.
In Part 2, we'll cover the exact conditions for finding regular divergence on a chart, the rules for drawing the lines, and how reliable it is on each timeframe. If finding divergence across many markets and timeframes by hand every time feels tedious, the Omnisight Report below lays it out for each market.
This lesson adapts the text, figures and live-stream quotes of the Trader Steve TA series for the web, translated from the original Korean. Check the text and figure captions for the timing and interpretation of each real example, and read conceptual diagrams and real charts separately.
Corrections: support@omnisight.report