What Is RSI Divergence? Bullish vs. Bearish Divergence and Why It Forms
Historical examples for learning · not current prices or trade recommendations.
Contents
You have probably seen it at least once: price prints a new high, while the Relative Strength Index (RSI) at the bottom of the chart is already hanging its head. When price and RSI point in different directions like this, it's called RSI divergence. This lesson uses concept charts and a real Ethereum (ETH) chart to show what it tells you when price and RSI split apart.
All dates and times are Korea Standard Time (KST, UTC+9). A daily candle is dated by its 09:00 KST open, and intraday examples are timed by the open of the KST candle.
1. The One-Line Definition: Price and RSI Going Different Ways
- Relative Strength Index (RSI): an indicator that compares the size of the up moves with the size of the down moves over the last 14 candles and expresses the balance between buying and selling pressure on a 0–100 scale. Above 70 is read as overbought, below 30 as oversold, and 50 in the middle is the center line.
- Divergence: literally, a splitting apart.
Put the two together, and RSI divergence is when price makes a new high (or a new low), but RSI doesn't follow to the same degree. Here's how I explained it on the live stream.
"Bullish divergence is when price is moving like this, but RSI, down below, is actually going up like this. Price is going down, but the share of people buying keeps growing. … Divergence means this one and this one are different. When price and the indicator that shows the actual trend of buying move differently, that's called divergence." — Trader Steve, live stream, Oct 14, 2026 (translated from Korean) · ▶ Watch the stream highlights (Korean audio)
2. Bullish Divergence: A Lower Low in Price, a Higher Low in RSI
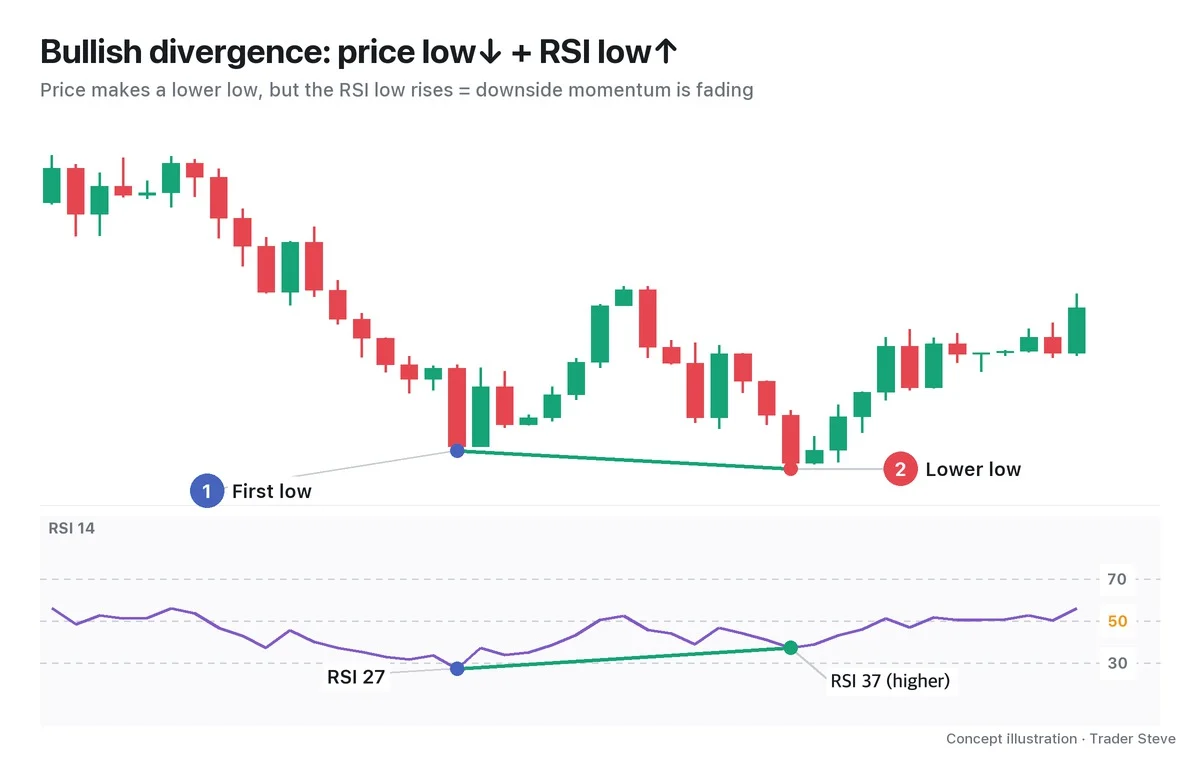
Price has been falling, bounces once, then comes back down and makes a lower low than the previous low. But look at RSI on the same two candles: the RSI at the second low is higher than at the first. That is bullish divergence.
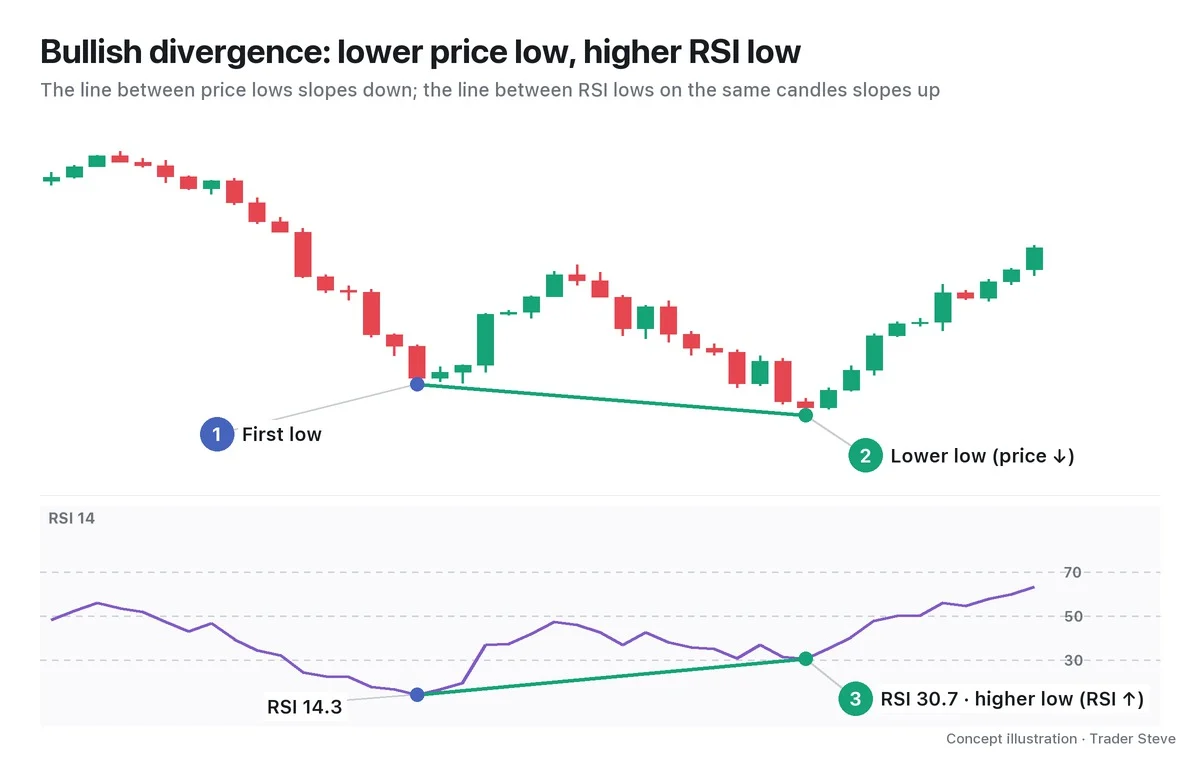
The first drop came with a run of large bearish candles, and RSI fell as far as 14.3. The second drop went deeper in price, but it came down slowly and RSI stopped at 30.7. In other words, price made a new low, but the selling pressure that made that low was weaker than the first time.
In the price panel, connect the two lows; in the RSI panel, connect the RSI lows on the same two candles (green lines). If the two lines slope in opposite directions, you have divergence.
3. Bearish Divergence: A Higher High in Price, a Lower High in RSI
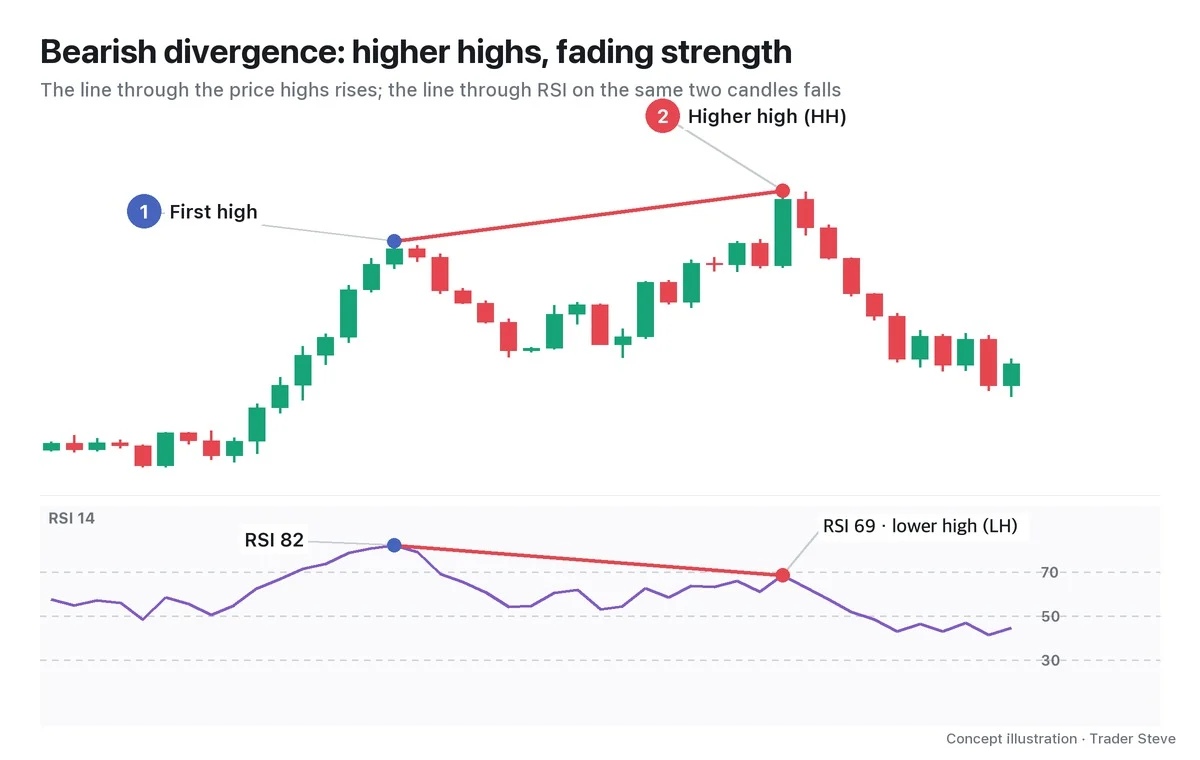
Bearish divergence is the exact mirror image. Price makes a higher high than the previous high, but the RSI high is lower.
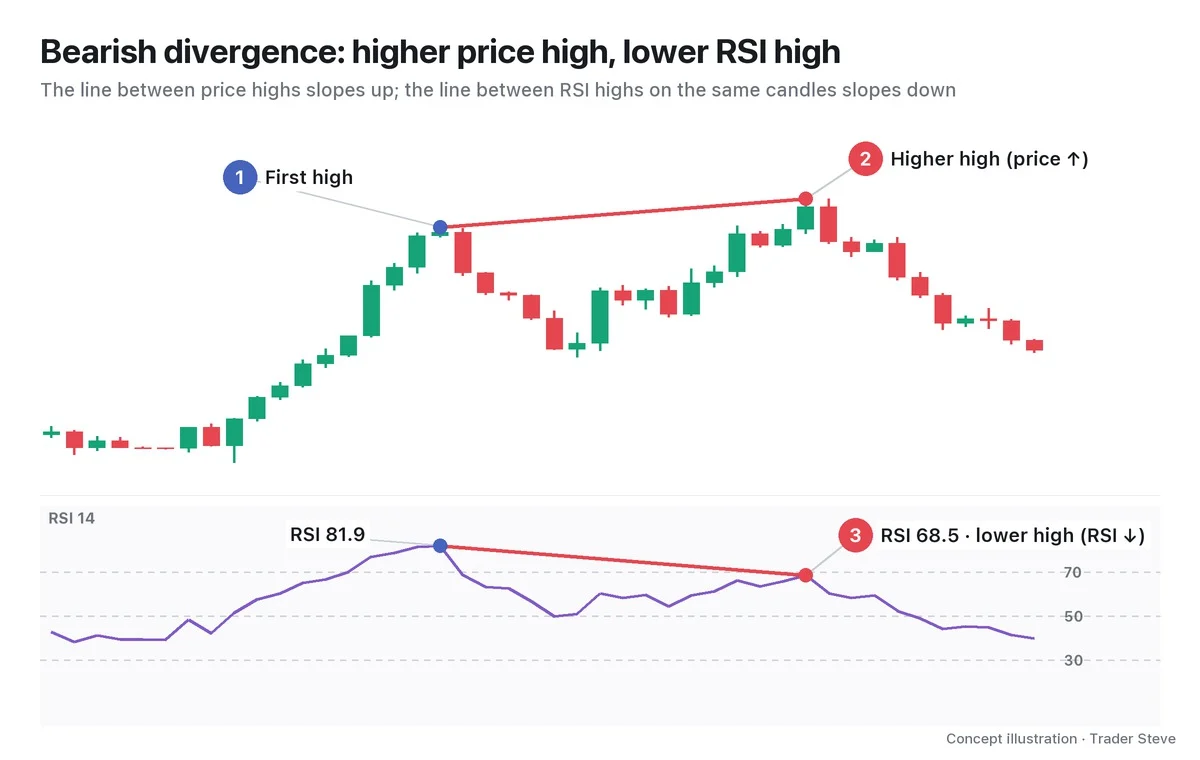
"What's bearish divergence? Price keeps going up, but what's RSI doing? The highs are coming down, like this." — Trader Steve, live stream, Oct 14, 2026 (translated from Korean) · ▶ Watch the stream highlights (Korean audio)
This time you connect the highs (red lines). It's a warning that a new high in price doesn't mean the buying pressure set a new record too.
| Type | Price | RSI | Connect | How to read it |
|---|---|---|---|---|
| Bullish divergence | low ↓ (lower low) | low ↑ (higher low) | low to low | the downward pressure is weakening |
| Bearish divergence | high ↑ (higher high) | high ↓ (lower high) | high to high | the upward push is weakening |
4. Why It Forms: RSI Measures How Forcefully Price Got There
Look at how RSI is calculated and the reason becomes clear.
- RS = average gain ÷ average loss over the last 14 candles
- RSI = 100 - 100 ÷ (1 + RS)
So RSI isn't the height of price. It is the ratio between recent up moves and recent down moves.
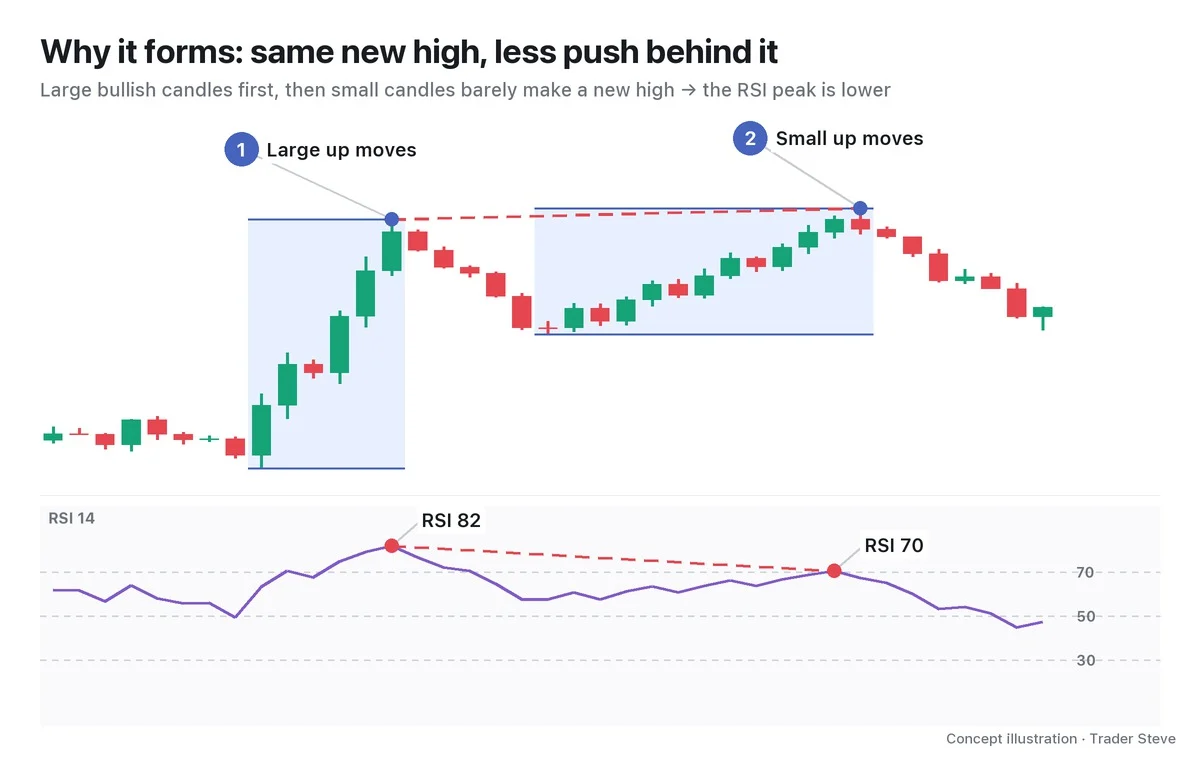
The first rally went up in one go, mostly on large bullish candles. The second rally cleared the first high, but the candles were small and mixed with bearish ones, so the average gain per candle was only about one third of the first rally's. When the numerator of RS (the average gain) shrinks, RSI can't climb back to its previous peak. Even at the same new high, RSI falls behind when the push gets smaller — that is how bearish divergence forms. Bullish divergence is the reverse: it forms when the downward pressure (the average loss) shrinks.
"For it to go up, price comes down but selling pushes a little less, so it has to set up a divergence like this. Price makes a lower low like this, but RSI shouldn't make a lower low like this." — Trader Steve, live stream, Oct 14, 2026 (translated from Korean) · ▶ Watch the stream highlights (Korean audio)
That's also what I watch when I'm waiting for a bottom. More than the new low itself, I look at whether less selling pressure shows up at that low (whether RSI holds above its previous low).
5. A Warning, Not a Signal
Divergence is a warning that the current move is losing momentum. It is not a signal that "it turns here."
- It's common for price to make a few more new highs while momentum keeps draining.
- The second high or low is only confirmed once the candles after it have closed. Don't judge from a candle that is still forming.
- That's why, after I spot divergence, I wait for a confirmation — RSI reclaiming or losing the 50 line, or a close beyond the high (or low) between the two swings — before I act. Part 3 covers this sequence in detail.
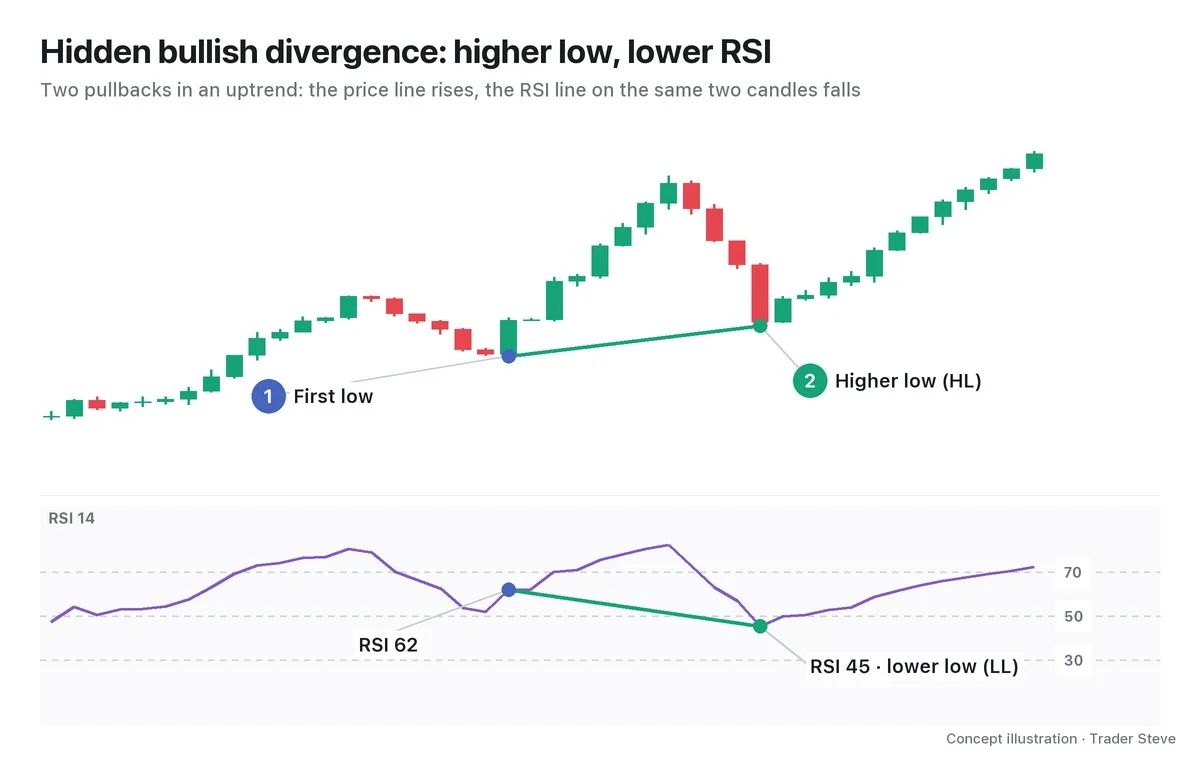
There is also hidden divergence, which appears while a trend continues; it's covered in Part 2 and in the Divergence Hidden topic. For the principles shared by all oscillators, see the Divergence Basics topic.
6. On a Real ETH Chart: The RSI ±2-Candle Extreme Variant
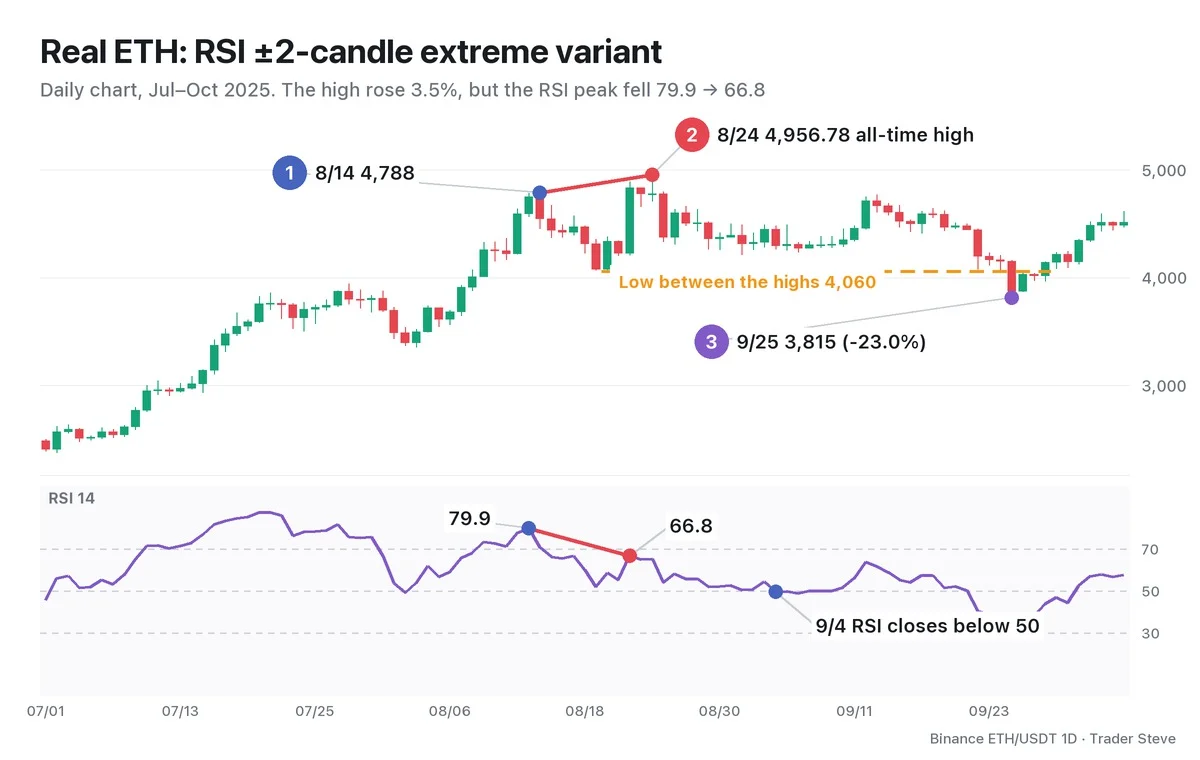
On Aug 14, Ethereum hit a high of 4,788, and the daily RSI peak around then was 79.9. Ten days later, on Aug 24, it made a high 3.5% higher, at 4,956.78. As of Oct 23, 2026, that price is still Binance ETH's all-time high. But the RSI peak around then was 66.8, 13.0 points lower. The momentum that made the all-time high was weaker than it had been ten days earlier.
This chart uses a separate variant: the RSI extreme within ±2 candles of each price swing. For the price highs on 8/14 and 8/24, the matching RSI readings come from 8/13 and 8/22. Under the shared standard — the RSI value on the same candle as the price swing — the readings are 70.7→65.3, the same as in Divergence Multiple Part 4 (double and triple divergence). This kind of offset is common on real charts, and Part 2 sets out the rules for connecting the points.
Here is what happened next.
- On Sep 4, the daily RSI closed below 50 for the first time (close 4,297.55).
- On Sep 25, price closed below the low between the two highs (the Aug 20 low of 4,060), and that day's low of 3,815 was 23.0% below the Aug 24 high.
That said, when this divergence appeared, the weekly RSI was 74.2 — the bigger trend was still strong. So price didn't collapse right after the high, and it took a little over a month (32 days) to close below the low between the two highs. That's why you need to read the warning → the confirmation → the bigger trend together. This case, too, is only a record redrawn after the fact; it does not mean things always play out this way when divergence appears.
By default, this series' comparison tables and statistics use the indicator value on the same candle as the confirmed price swing. Connecting the indicator's extreme within a few candles of the swing (±2 candles for RSI, ±3 for Moving Average Convergence Divergence (MACD)) is kept separate as the 'nearby-extreme variant', and when it's used, both the price time and the indicator time are stated. The same-candle rule is covered in Divergence Basics Part 2 (related lesson).
Key Takeaways
- RSI divergence is when price makes a new high or low, but RSI doesn't follow.
- Bullish divergence connects low to low (price ↓, RSI ↑); bearish divergence connects high to high (price ↑, RSI ↓).
- RSI is the ratio of up moves to down moves over the last 14 candles, so even at the same new high, RSI prints lower when the push gets smaller.
- Divergence is only a warning that momentum is fading; entries come after a confirmation such as the RSI 50 line or a structure break.
In Part 2, we'll cover how to find RSI divergence precisely on a chart, the rules and checklist for connecting highs and lows, and variations such as hidden divergence and the failure swing.
If finding divergence by hand across many markets and timeframes gets tedious, the Omnisight Report lays it out for each market alongside the other structures.
This lesson adapts the text, figures and live-stream quotes of the Trader Steve TA series for the web, translated from the original Korean. Check the text and figure captions for the timing and interpretation of each real example, and read conceptual diagrams and real charts separately.
Corrections: support@omnisight.report