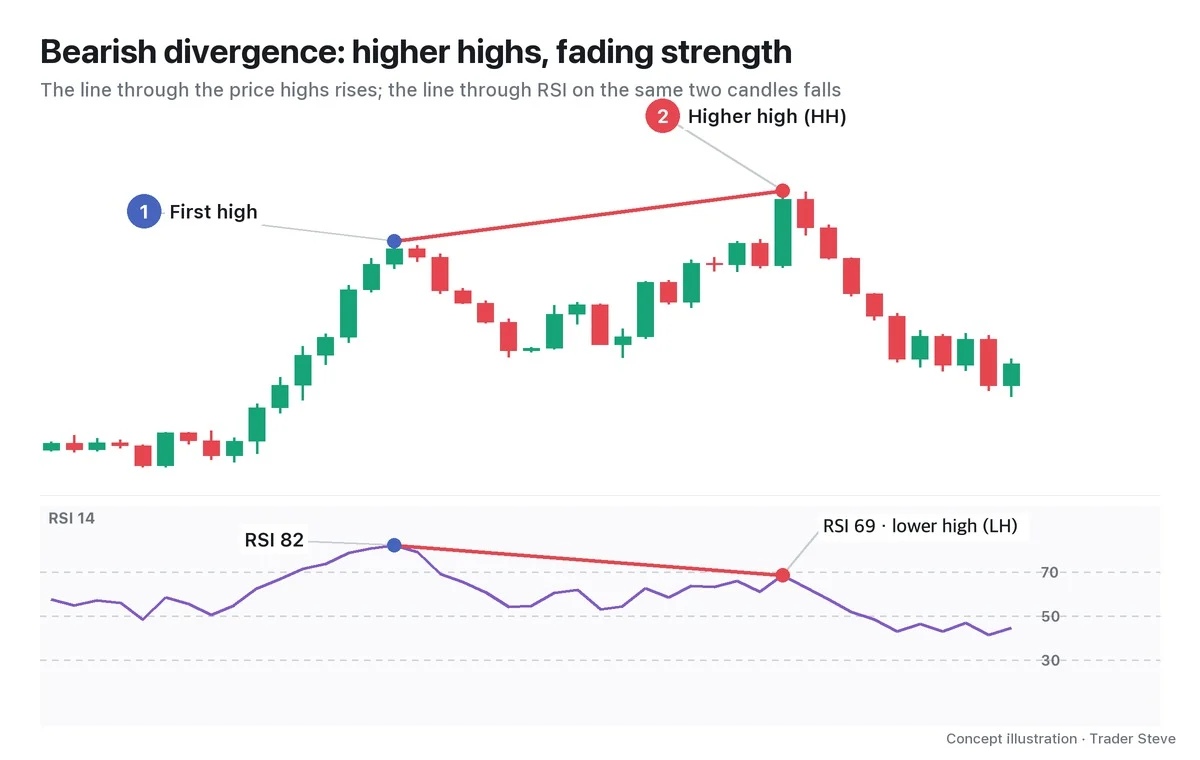
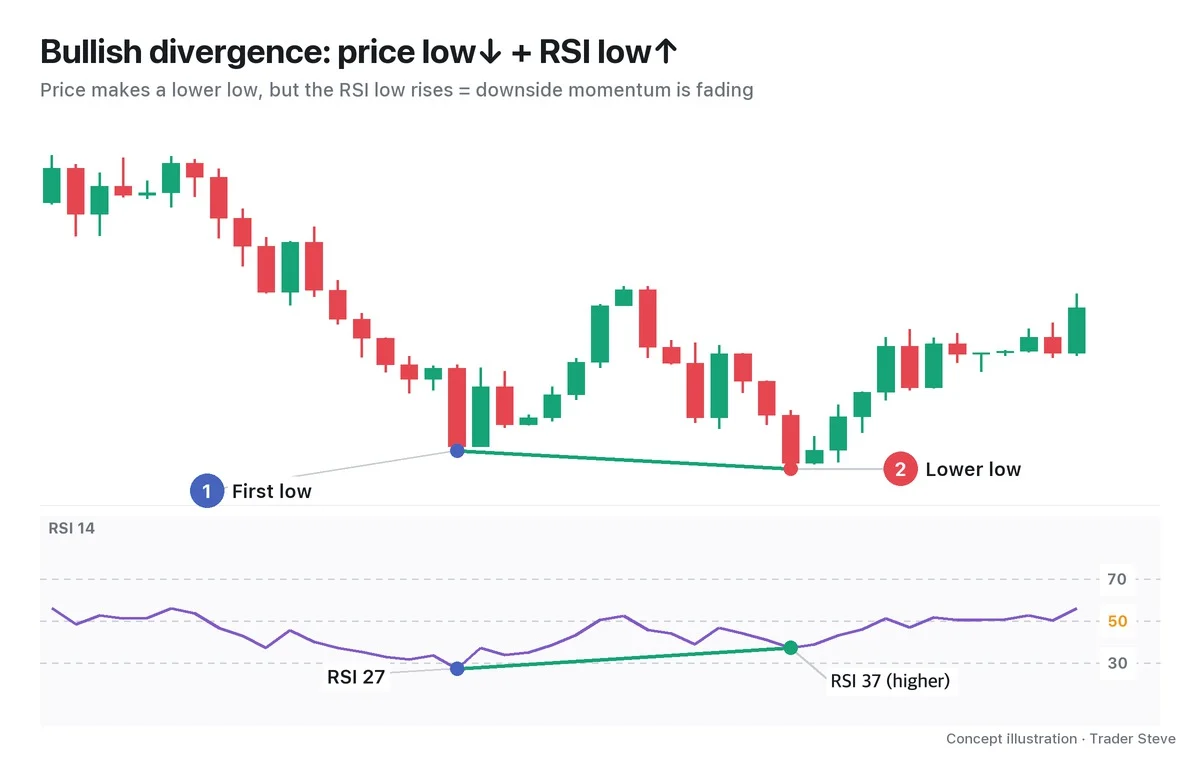
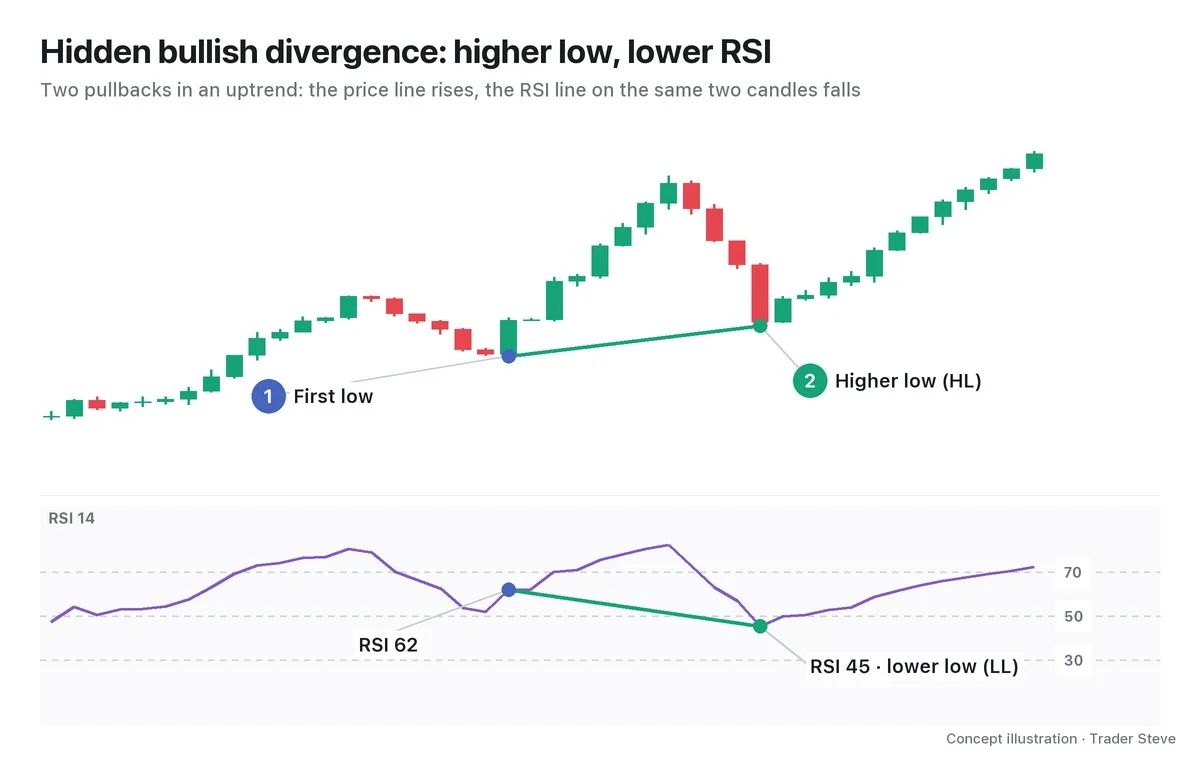
What Is SMT Divergence? How It Differs from RSI Divergence
Historical examples for learning · not current prices or trade recommendations.
Contents
Study divergence long enough and you'll run into SMT divergence (Smart Money Technique divergence), a term from ICT. It carries the same word, "divergence," but look closer and it compares completely different things. This lesson uses four images to set oscillator divergence (such as Relative Strength Index, or RSI, divergence) and SMT divergence side by side: what each one compares, why it forms, and what it tells you.
All dates and times are Korea Standard Time (KST, UTC+9). A daily candle is dated by its 09:00 KST open, and intraday candles are identified by their KST open time.
1. Same Name, Different Things Being Compared
Divergence means "two things that should move together have come apart." So whenever you hear the word, the first question is what came apart from what.
- Oscillator divergence: price vs. an indicator come apart within one asset. "Price made a new high, but the push behind it weakened."
- SMT divergence (Smart Money Technique divergence, SMT): price vs. price come apart between two assets that normally move together. "One made a new high, but its pair failed to follow."
The word is the same, but one reads the speedometer and the other watches the car in the next lane. Once you have that difference clear, you won't confuse the two signals, whether they show up at the same high or separately.
2. Oscillator Divergence Refresher: One Asset, Price vs. Indicator
An oscillator such as RSI is a speedometer: it shows how fast price has moved as a number between 0 and 100. When the line connecting two price highs and the line connecting the RSI highs at the same two candles slope in opposite directions, you have a divergence.
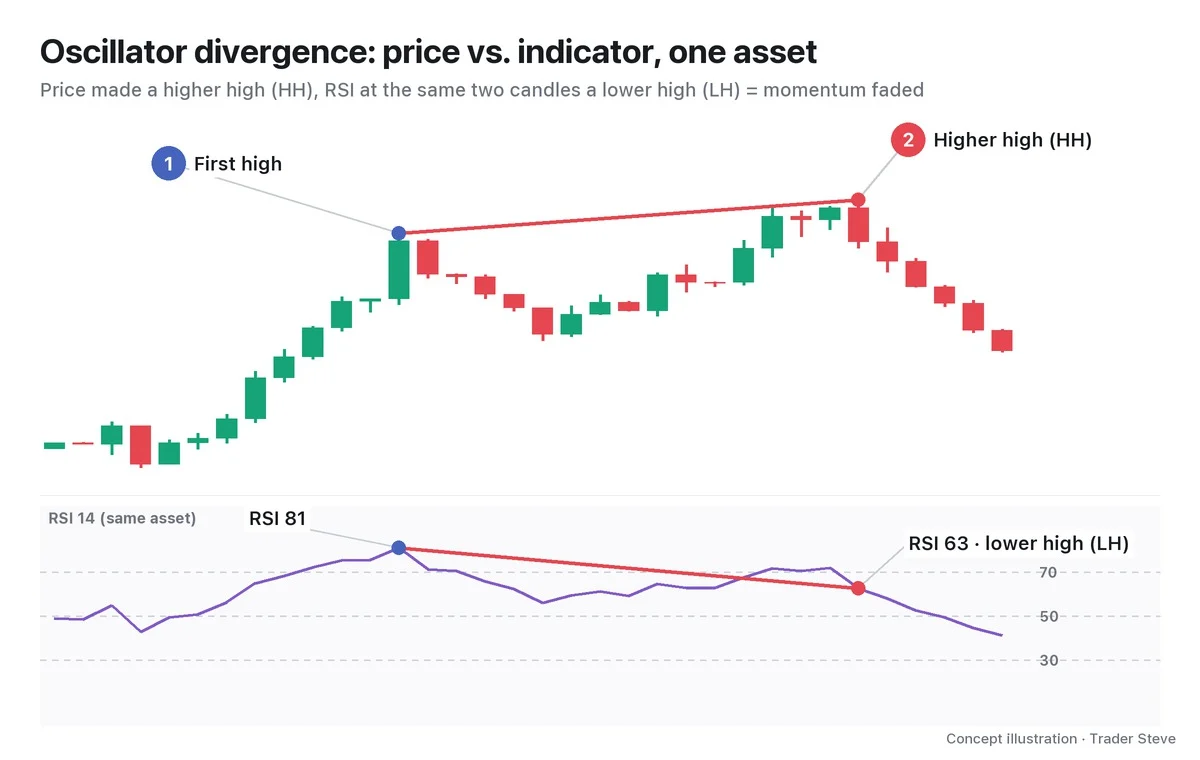
In the image, the first rally is short and strong; the second goes higher but more slowly. Price set a new record, but the momentum behind that record weakened. That is a regular bearish divergence. The only thing used for the comparison here is a single chart. If divergence itself is new to you, start with Divergence Basics Part 1 (related lesson).
3. SMT Divergence: A Pair of Assets, Price vs. Price
SMT divergence uses no indicator. You take a pair that normally moves in the same direction, such as Bitcoin (BTC) and Ethereum (ETH) or the Nasdaq and the S&P 500, put both on the same timeframe at the same times, and compare swing high with swing high and swing low with swing low.
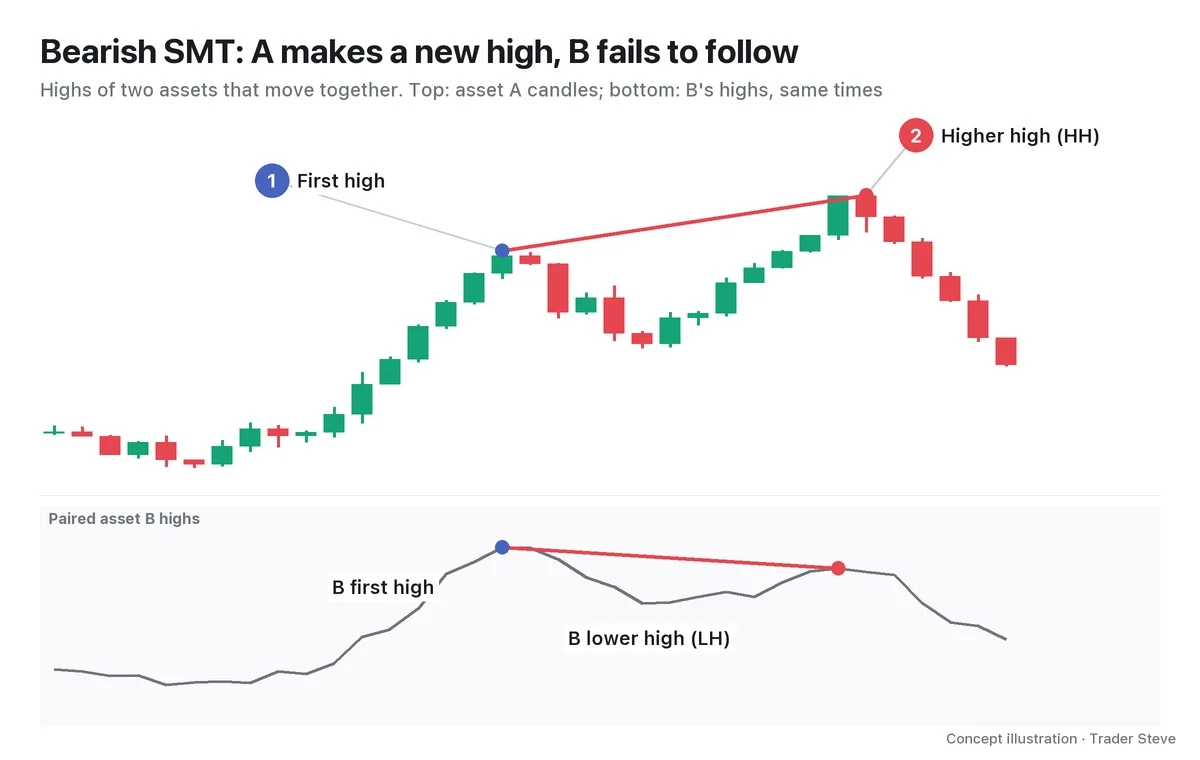
- Bearish SMT: compare highs. One asset makes a higher high (HH); its pair makes a lower high (LH).
- Bullish SMT: compare lows. One asset makes a lower low (LL); its pair makes a higher low (HL).
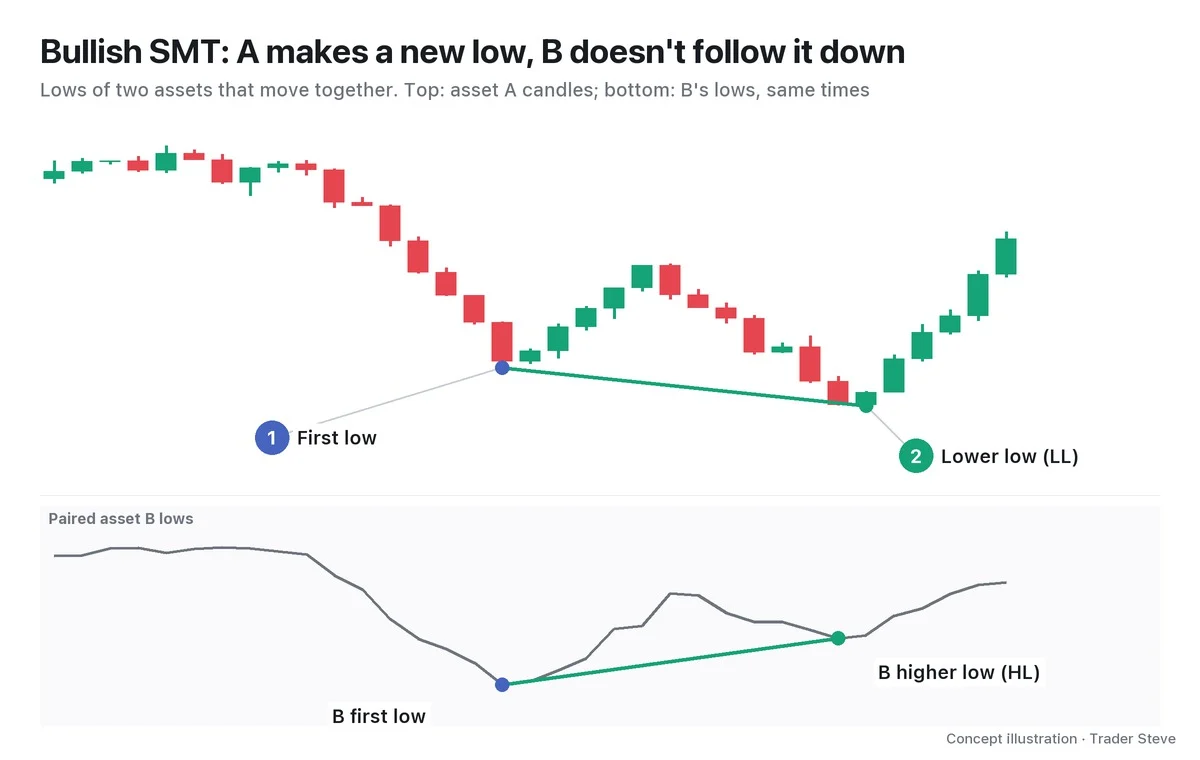
The bottom panel in these images is not RSI but the paired asset's price. The shape looks much like an oscillator divergence chart, but what sits in the panel is different. It's no exaggeration to say that this one point is the whole difference between the two concepts.
4. Why It Forms: Did the Push Fade, or Did Only One Side Move?
The two divergences also give different answers to "why did they come apart?"
Oscillator divergence means momentum faded within the same asset. Price made a higher high, but it got there more slowly.
SMT means the correlation between two assets that moved together has broken. ICT calls this a crack in correlation. In a bearish SMT, only one asset ran up through the stop orders above its prior high, that is, the liquidity there, while its pair never reached the same spot. You read it as buying pressure that came from one side only instead of spreading across the whole market.
I didn't use the name SMT on my live stream, but I have compared the structure of Bitcoin and Ethereum over the same period side by side like this.
"Ethereum, again, feels quite a bit different from Bitcoin. … When you draw the channel off the swing high and low points, this one has now escaped it — it got pushed down earlier and further than Bitcoin, right? So it broke out through this channel. But Bitcoin is still inside the channel. The two have somewhat different structures." — Trader Steve, live stream, Aug 20, 2026 (translated from Korean) · ▶ Watch the stream highlights (Korean audio)
Setting only the price structure of two assets against each other, with no indicator, is exactly how you look at SMT. Still, "the structures are different" doesn't by itself tell you which side is right. Part 3 comes back to this.
Here's a preview on a real chart.
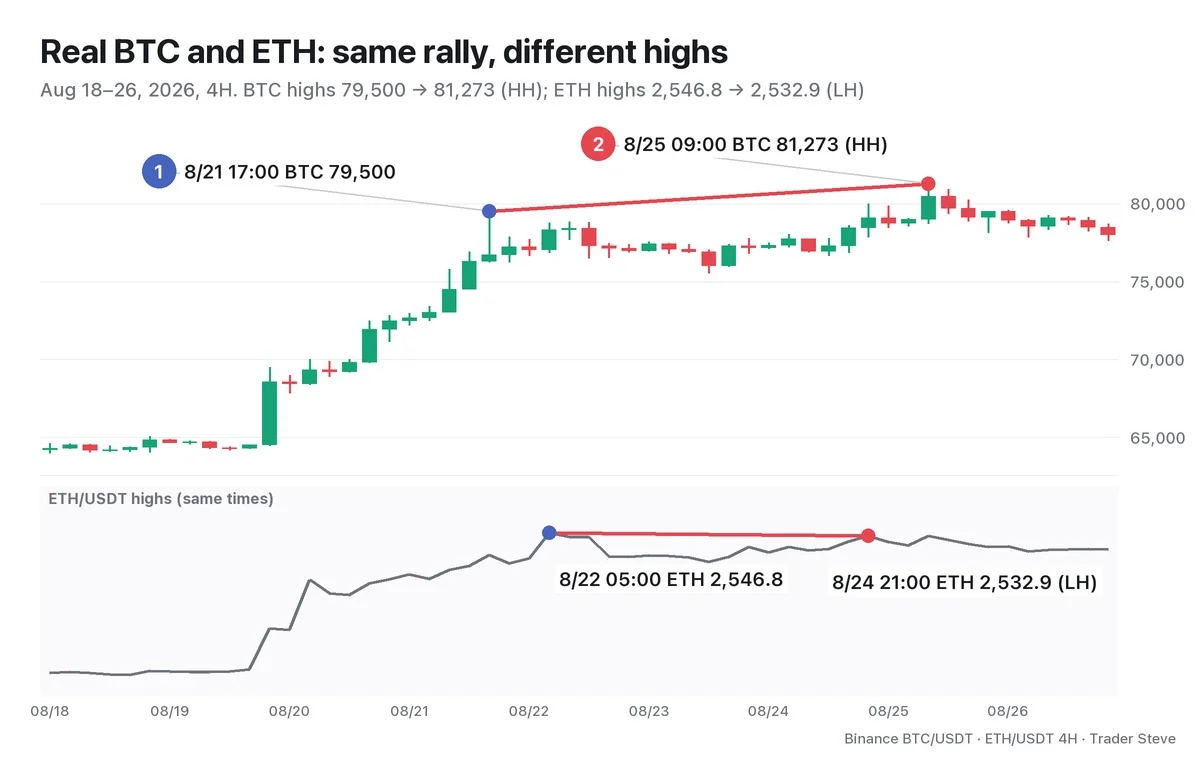
BTC raised its high from 79,500 on the Aug 21 17:00 candle to 81,273 on the Aug 25 09:00 candle. In the same rally, ETH's highs actually fell: 2,546.8 at 05:00 on Aug 22, then 2,532.9 at 21:00 on Aug 24. Even on the very candle where BTC hit 81,273, ETH's high was 2,532.5, below its first high. Notice, too, that the two assets' highs don't form on exactly the same candle. Part 2 covers how to pair swings that are offset like this.
At the same two BTC highs, RSI fell from 93.9 to 76.3, so an oscillator divergence was in place as well. Part 4 interprets this case, where both lenses lined up at one high, in detail.
5. At a Glance: Six Differences and One Thing in Common
| Aspect | Oscillator divergence | SMT divergence |
|---|---|---|
| What is compared | one asset's price vs. an indicator | two assets' price vs. price |
| Data needed | one chart | two charts at the same times and on the same timeframe |
| Indicator calculation | required (values shift slightly with the RSI period and warm-up) | none (raw highs and lows) |
| What it tells you | momentum is slowing | only one side swept the liquidity; the push didn't spread across the market |
| Main theory | classical technical analysis | ICT |
| Typical pairs | (no pair) | BTC↔ETH, Nasdaq (NQ)↔S&P 500 (ES) |
Pairs with an inverse correlation, which move in opposite directions, such as the US Dollar Index (DXY) and the euro–dollar (EURUSD), are compared after flipping one of them. Part 5 covers this mistake.
The two have as much in common as they have differences. Both connect two swings and look for one side that fails to follow at the second swing. And both are warnings only, not entry signals. After the warning, price can keep going in the same direction for a while, and if the lagging asset belatedly breaks its high, the SMT simply disappears. That's why the actual decision waits until you confirm a change in structure, such as a change of character (CHoCH). ICT-side details such as kill zones and sessions are covered separately in the ICT SMT Divergence topic (related lesson).
Key Takeaways
- Oscillator divergence is price vs. indicator within one asset; SMT is price vs. price between two assets.
- A bearish SMT compares highs (HH vs. LH); a bullish SMT compares lows (LL vs. HL).
- An oscillator tells you momentum is slowing; SMT tells you of a crack in correlation, where only one side swept the liquidity and its pair didn't follow.
- Both are warnings that connect two swings, not grounds for entry until a change in structure is confirmed.
In Part 2, we'll cover how to choose a pair, how to match offset swings, and the criteria for judging SMT, which can appear or disappear depending on which high you compare against.
Lining up two assets' charts to the same times and checking indicators by hand every time takes a lot of time. The Omnisight Report organizes comparisons like these for each market.
This lesson adapts the text, figures and live-stream quotes of the Trader Steve TA series for the web, translated from the original Korean. Check the text and figure captions for the timing and interpretation of each real example, and read conceptual diagrams and real charts separately.
Corrections: support@omnisight.report