What Is Stochastic Divergence? Meaning and Why It Forms
Historical examples for learning · not current prices or trade recommendations.
Contents
You have probably seen it before: price clearly makes a higher high, yet the stochastic at the bottom of the chart draws a lower high. That is stochastic divergence. This lesson uses four charts to show what the stochastic actually measures, and from there, why divergence forms and what it tells you.
All dates and times are Korea Standard Time (KST, UTC+9). A daily candle is dated by its 09:00 KST open, and intraday examples are timed by the open of the KST candle.
1. Recap: The Stochastic Measures "Where in the Range Did the Close Land?"
The stochastic oscillator is an indicator formalized by George Lane in the 1950s. It asks one question: "Between the highest high and the lowest low of the last 14 candles, how high up did this candle close, in percent?"
- Fast %K: (close - 14-candle low) ÷ (14-candle high - 14-candle low) × 100
- Percent K (%K): in the slow stochastic (14·3·3) used in this lesson, %K is the 3-candle average of fast %K.
- Percent D (%D): the 3-candle average of %K again, a line that runs one beat behind.
So a reading above 80 doesn't mean "it's about to turn." It means the close keeps landing near the top of the recent range, and below 20 means it keeps closing near the bottom. If you want the formula and settings from the start, I recommend reading Parts 1 and 2 of the Basics Oscillators topic (related lesson) first. Here I'll only follow why this formula matters for divergence.
2. The One-Line Definition: Price Makes a New High, %K Makes a Lower High
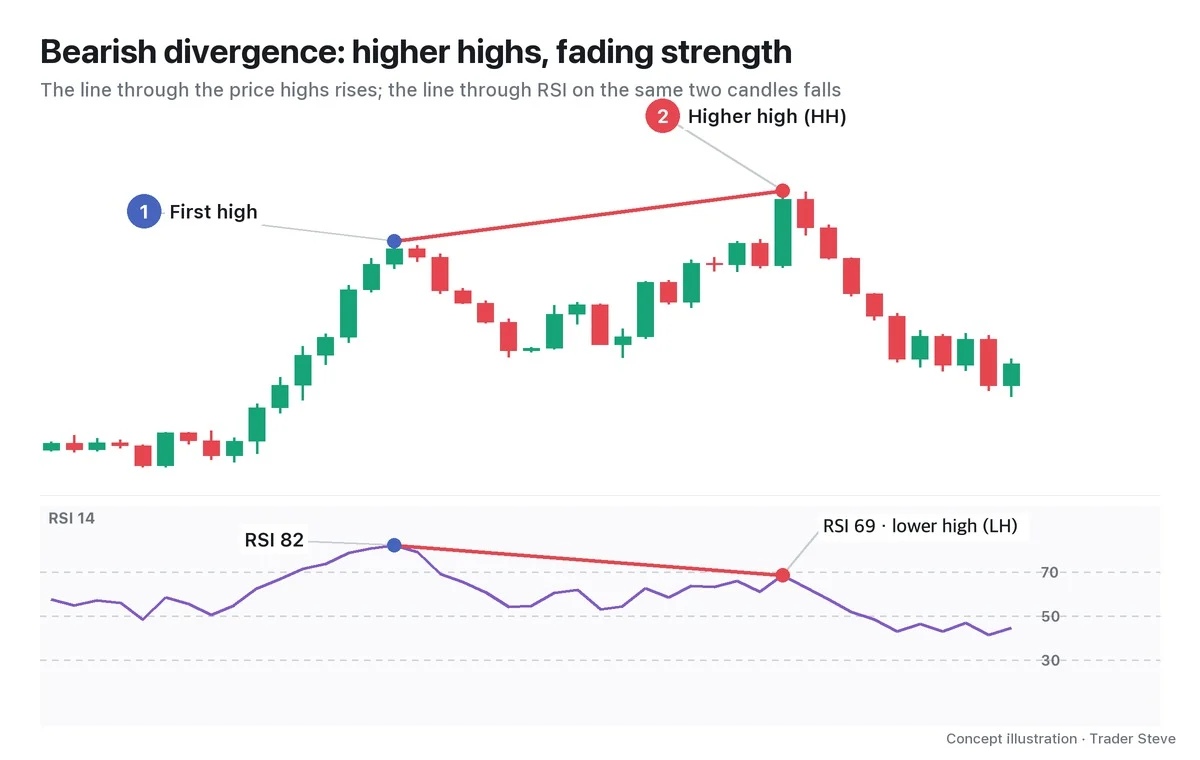
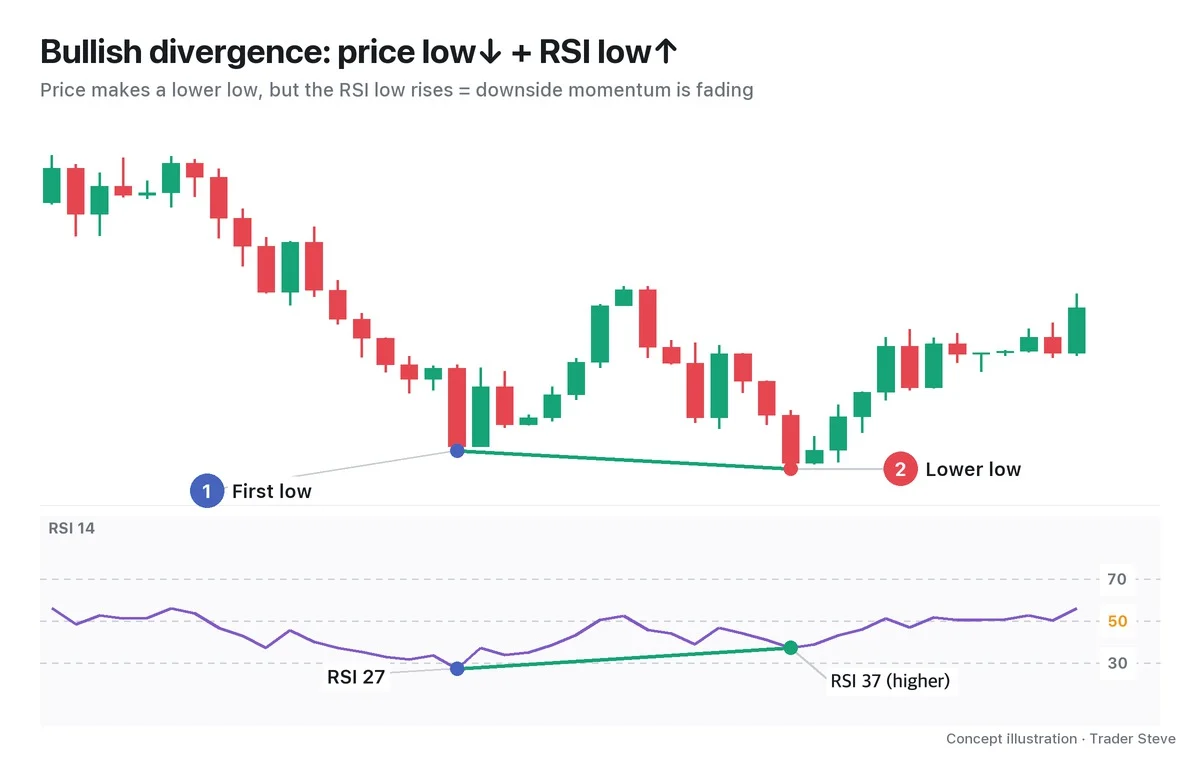
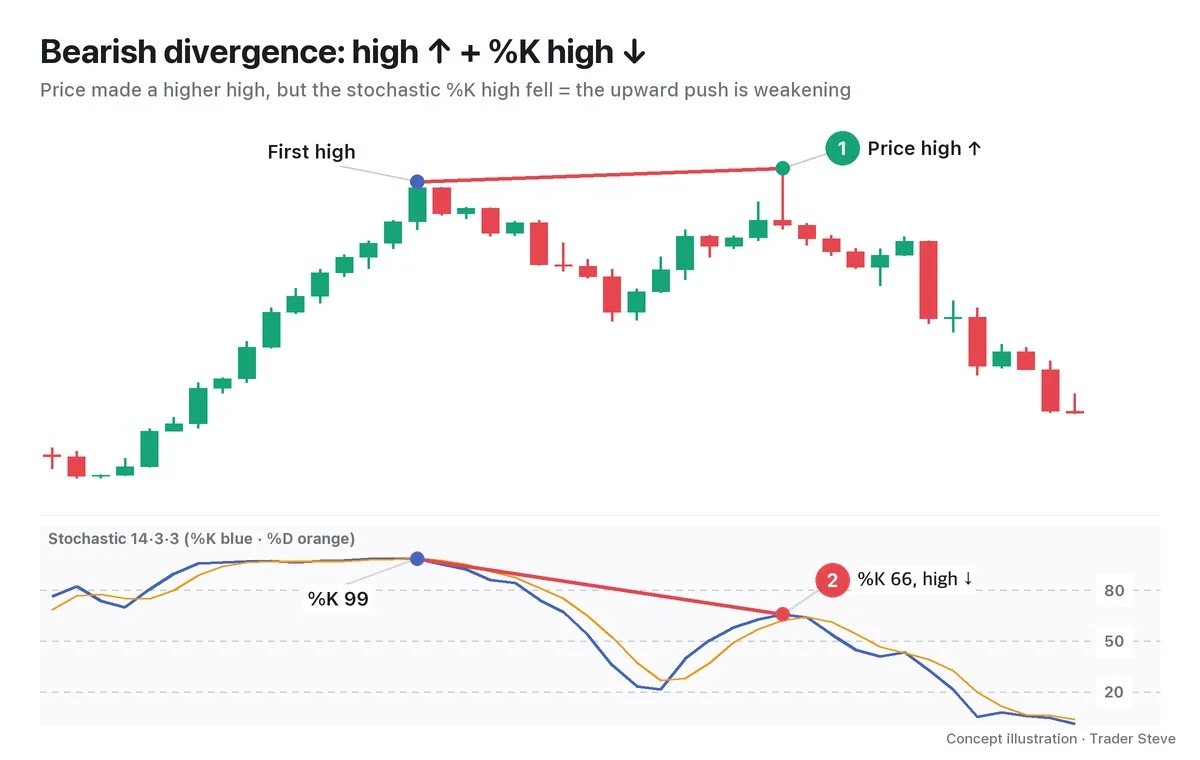
Stochastic divergence is when two price extremes and the %K values on those exact two candles point in opposite directions.
There are two types, depending on direction.
| Type | Price | %K | How to read it |
|---|---|---|---|
| Bearish divergence | higher high ↑ | lower high ↓ | the upward push is weakening |
| Bullish divergence | lower low ↓ | higher low ↑ | the downward push is weakening |
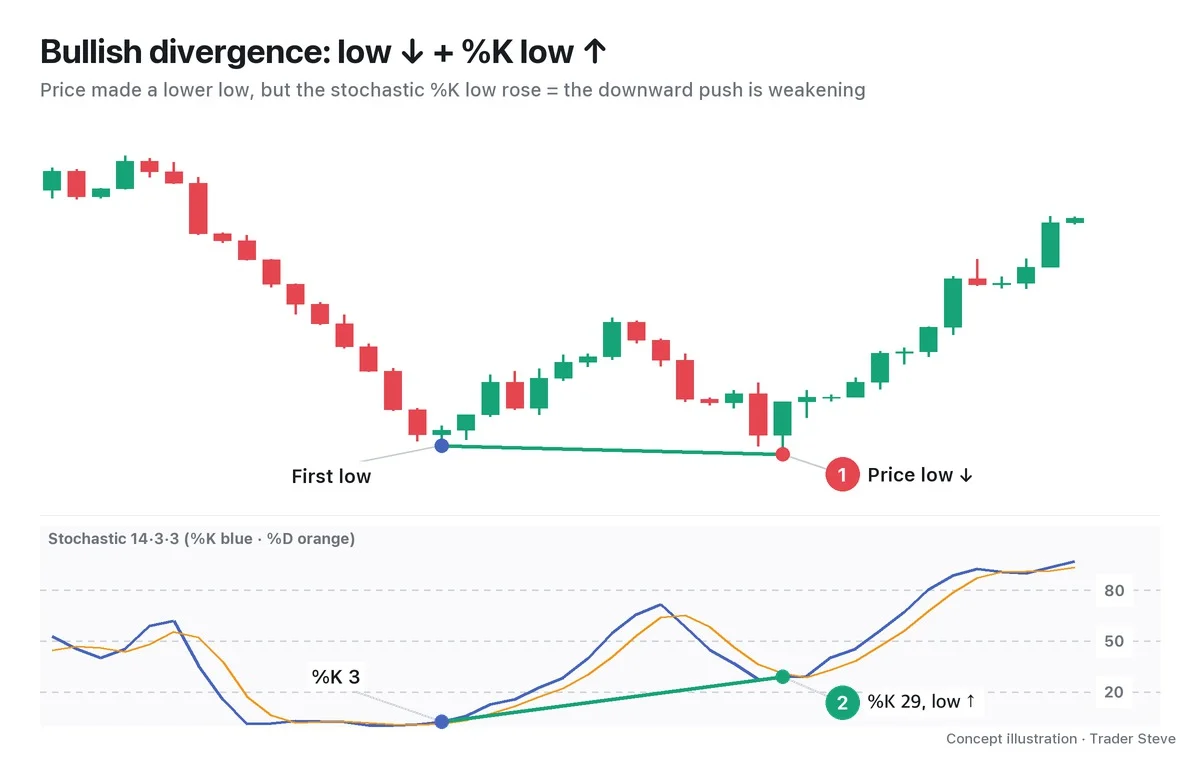
On the live stream, I mostly explain divergence with the Relative Strength Index (RSI). The indicator is different, but the principle — "price and momentum pull apart" — is the same. Here is how I put it while reading a Bitcoin (BTC) report together on the stream.
"The indicator of the strength pushing the rally up was actually lower. What does that mean? It's turning into divergence. The buying here has come down a lot compared with the buying here — it means a lot of people are taking profits." — Trader Steve, live stream, Aug 25, 2026 (translated from Korean) · ▶ Watch the stream highlights (Korean audio)
The general definition and types of divergence are covered in the Divergence Basics topic (related lesson). This topic focuses on what changes when you apply it to the stochastic.
3. Why It Forms: A New High, but the Close Can't Stay Near the Top of the Range
Stochastic divergence is easy to understand if you follow the formula. %K is "the position of the close within the range," so even if price prints a new high, %K won't rise unless the close lands near the top of that range.
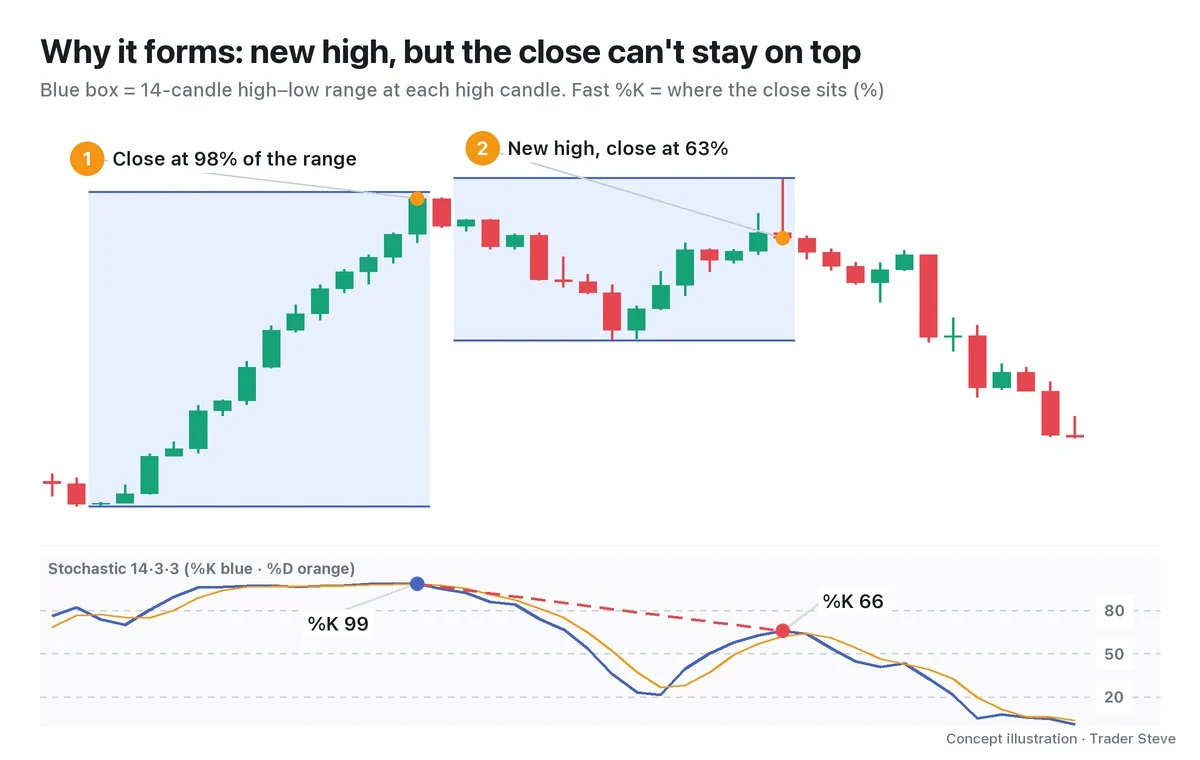
Let's compare the two moments in the chart.
- First high: at the end of a nonstop climb, the close landed at 98% of the 14-candle range — almost at the very top. %K in the panel also rises to 99.
- New high: the high was above the previous one, but the candle left a long upper wick, got pushed back down and closed at 63% of the range. %K stops at 66.
The 98% and 63% in the chart are fast %K exactly as calculated, while 99 and 66 in the panel are slow %K, the 3-candle average of those values, so the numbers differ slightly. The direction is the same.
A new high means someone is still willing to try higher. But a close that can't stay near the top of the range means that, at those higher prices, sellers pushed price back down before the candle finished. The high went up, but the buying pressure pushing it up was weaker than before, and divergence puts that difference into numbers.
This same property is also a weakness. Because the stochastic is sensitive to where the close lands, it swings hard on a single wick or a single candle, and even a short pullback can send it all the way to the opposite zone. That's why it produces divergence more often than RSI — and more false ones, too. The conditions that filter these out are covered one by one from Part 2 onward.
4. Why Watch It: A Warning Where the Trend Could Turn
The reason to watch divergence is simple: it flags in advance where a trend could turn.
"You have to watch divergence. Because if you want to find the spots where the trend turns in the short term, you have to look at divergence." — Trader Steve, live stream, Sep 13, 2026 (translated from Korean) · ▶ Watch the stream highlights (Korean audio)
But what this gives you is a warning: "a spot where it could turn", not "a confirmed reversal." A weaker push doesn't mean the direction changes right away, and it's common for price to keep going a long way while weakened. So when you actually use it, you don't look at divergence alone. You set a confirmation in advance (a %K/%D crossover, an exit from the 80 or 20 zone, a cross of the 50 line) together with an invalidation level (price moving beyond the second extreme).
5. On a Real BTC 4-Hour Chart
Here is a bearish divergence from the Bitcoin 4-hour chart in early July 2026.
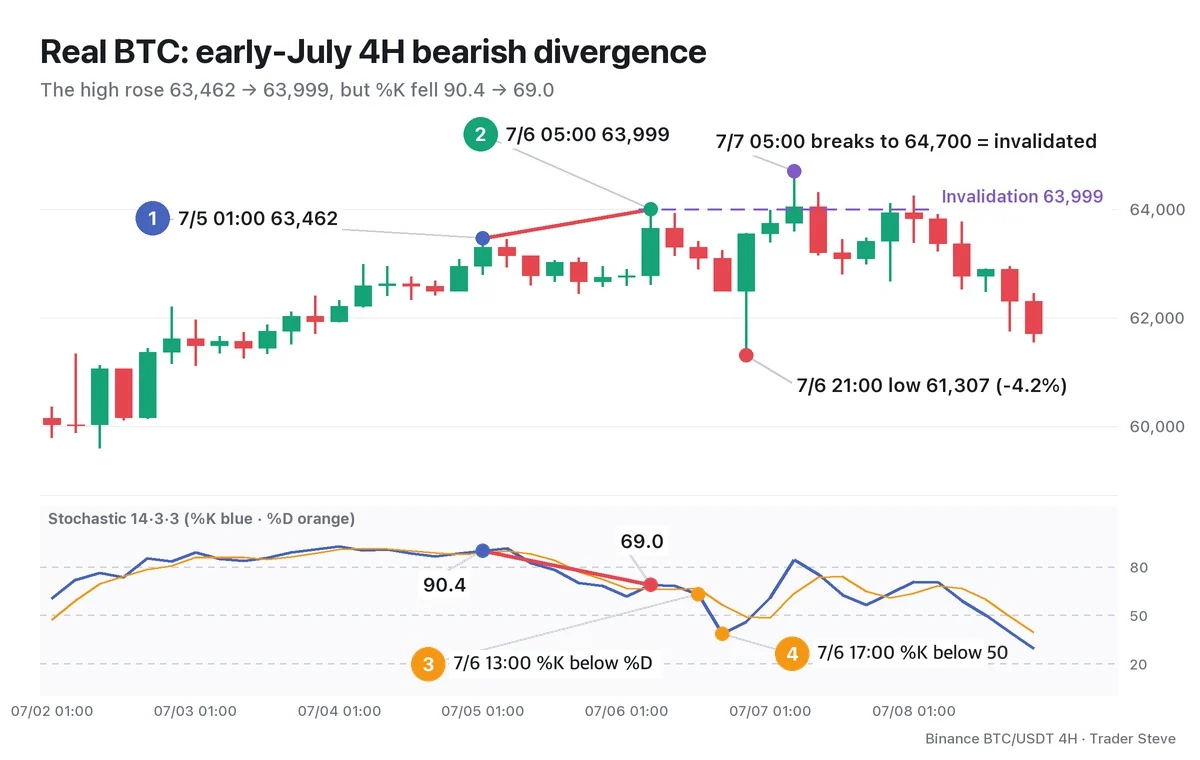
- ① First high: the Jul 5 01:00 candle, high 63,462. %K was 90.4, above 80. The high before it (Jul 4 05:00, 62,979.9) was lower, so this candle is the first high to compare against.
- ② Second high: the Jul 6 05:00 candle made a higher high at 63,999, but %K fell to 69.0. The first high above 80 and the second below 80 is a shape you see often in stochastic divergence.
- ③ Confirmation 1: on the Jul 6 13:00 candle, %K closed below %D (close 63,089.4).
- ④ Confirmation 2: on the Jul 6 17:00 candle, %K closed below 50 (close 62,483.8).
After that, price was pushed down to a low of 61,306.8 on the Jul 6 21:00 candle — about -4.2% from the second high of 63,999.
To be honest, that isn't the end of the story. The very next day, the Jul 7 05:00 candle hit a high of 64,700, above the second high of 63,999, and at that moment this divergence was invalidated. The drop after the signal was short and quickly erased. Divergence isn't a tool for predicting the future. It's a warning about the current state — "momentum has weakened" — and deciding in advance when that warning ends is part of the same package.
Key Takeaways
- Stochastic %K measures, on a 0–100 scale, where the close landed within the range of the last 14 candles.
- Bearish divergence is price high ↑ + %K high ↓; bullish divergence is price low ↓ + %K low ↑.
- When price prints a new extreme but the close can't land near the end of the range, %K fails to follow and divergence forms.
- It is only a warning of a spot where the trend could turn; watch it together with a confirmation and an invalidation level.
In Part 2, we'll cover the steps for finding and drawing stochastic divergence on a chart, the 80/20 zone condition, and whether to use the %K or the %D line.
Checking all of this by hand for every market takes real time. An analysis that lays out divergence alongside structure is available in the Omnisight Report below.
This lesson adapts the text, figures and live-stream quotes of the Trader Steve TA series for the web, translated from the original Korean. Check the text and figure captions for the timing and interpretation of each real example, and read conceptual diagrams and real charts separately.
Corrections: support@omnisight.report