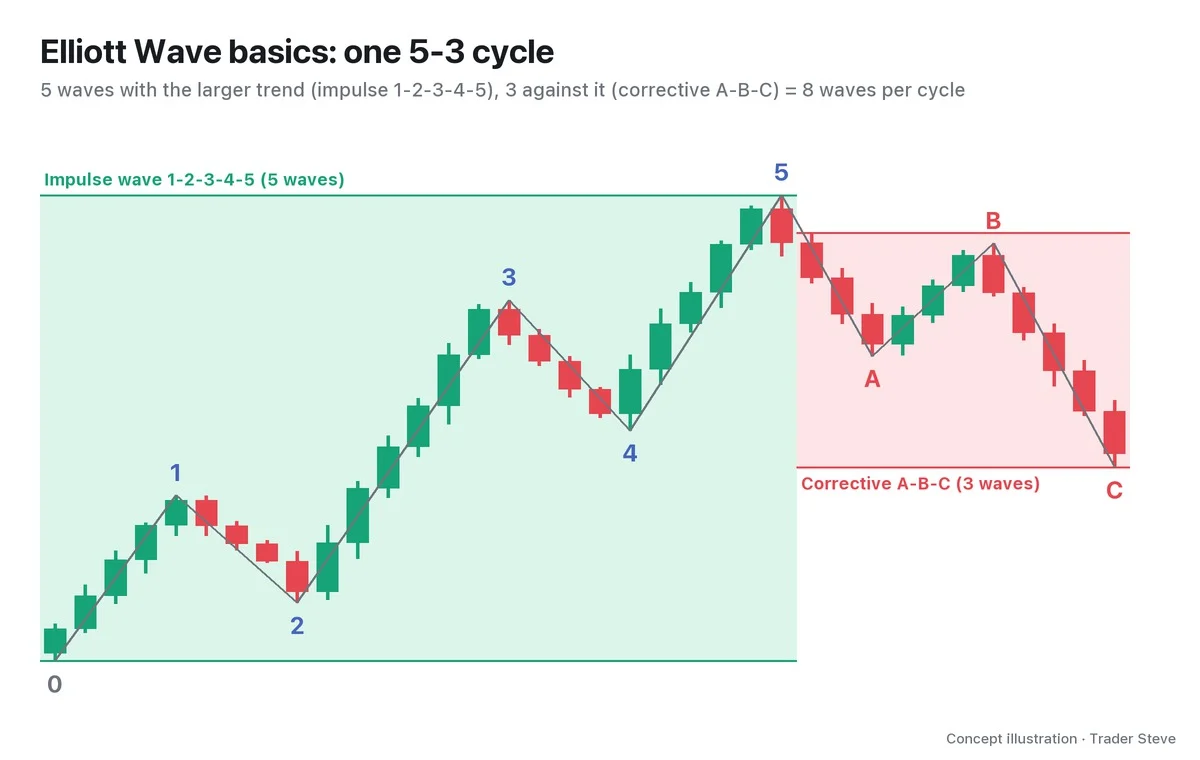
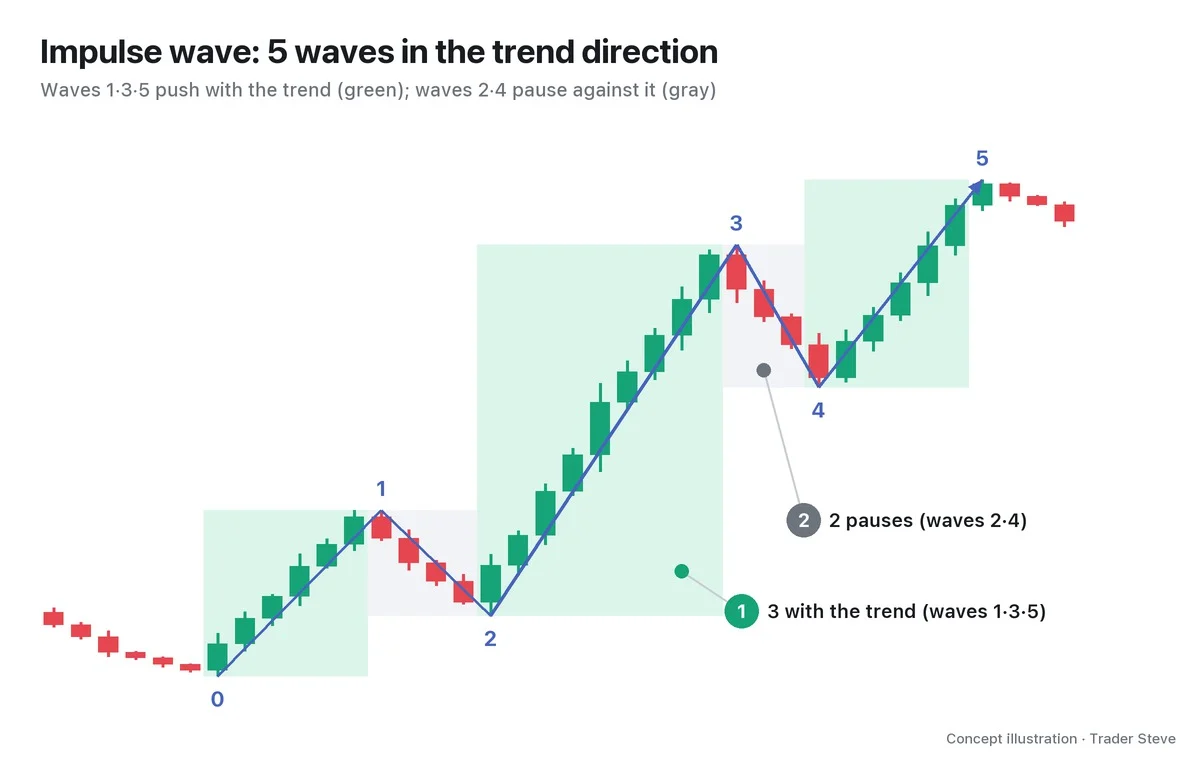
What Is the Guideline of Alternation? Why Waves 2 and 4 Differ
Historical examples for learning · not current prices or trade recommendations.
Contents
Once you count a chart with Elliott Wave and wave 2 is over, the next question comes naturally: "So how will wave 4 play out?" The best-known guide for that question is the guideline of alternation. This lesson shows how to use the shape of wave 2 to sketch the shape of wave 4 in advance. I go through the definition, the two families of corrections, why alternation happens, and a real Bitcoin daily chart, in that order.
All dates and times are Korea Standard Time (KST, UTC+9). A daily candle is dated by its 09:00 KST open, and the time shown for an intraday candle is the time that candle opens. The actual intraday time of a high or low is stated separately.
1. The One-Line Definition: Waves 2 and 4 Look Different
The guideline of alternation describes the tendency for wave 2 and wave 4 of the same impulse wave to take different shapes. It is one of the guidelines laid out in A. J. Frost and Robert Prechter's Elliott Wave Principle, and its core fits in one sentence.
If wave 2 was a sharp correction, expect wave 4 to be a sideways correction; if wave 2 was a sideways correction, expect wave 4 to be sharp.
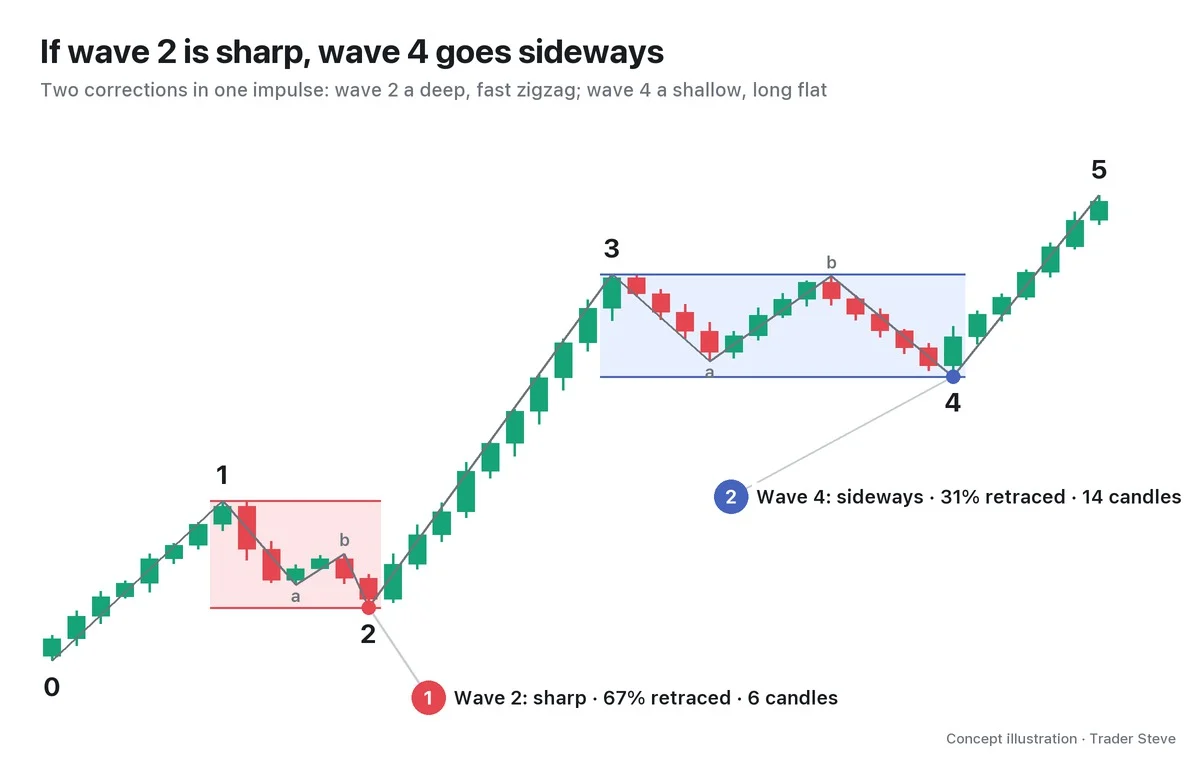
The red box is wave 2 and the blue box is wave 4. Wave 2 fell short and deep in an a-b-c. Wave 4 built a b leg that climbed back near the top of wave 3 and stayed sideways for a long time. Both are "corrections," but they differ in depth, in duration and in shape.
The reverse pairing exists too.
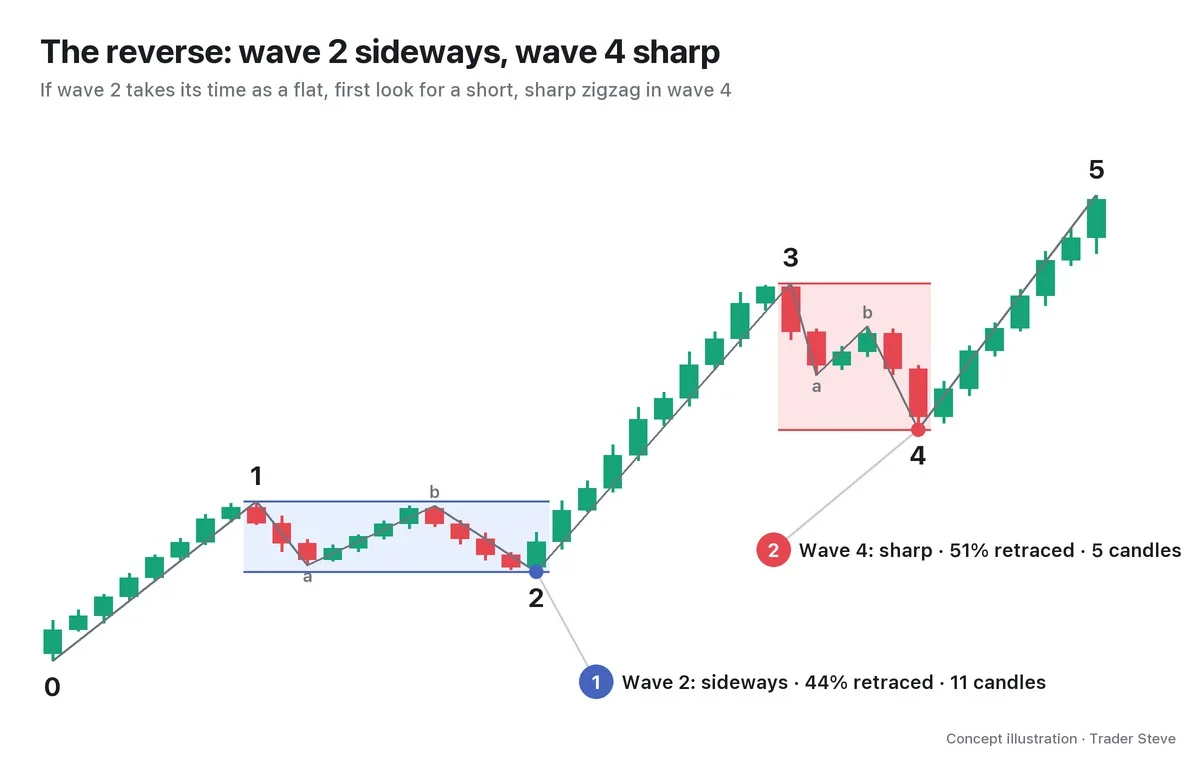
"Alternation" here doesn't mean price going up and down. It means the character of the correction switching back and forth. That's why the guideline of alternation tells you first what shape wave 4 might take, rather than "where wave 4 will end." The basics of labeling waves are covered in Elliott Wave Basics (related lesson).
2. Sharp vs. Sideways: The Two Families of Corrections
To talk about alternation, you need to be able to sort corrections into two families.
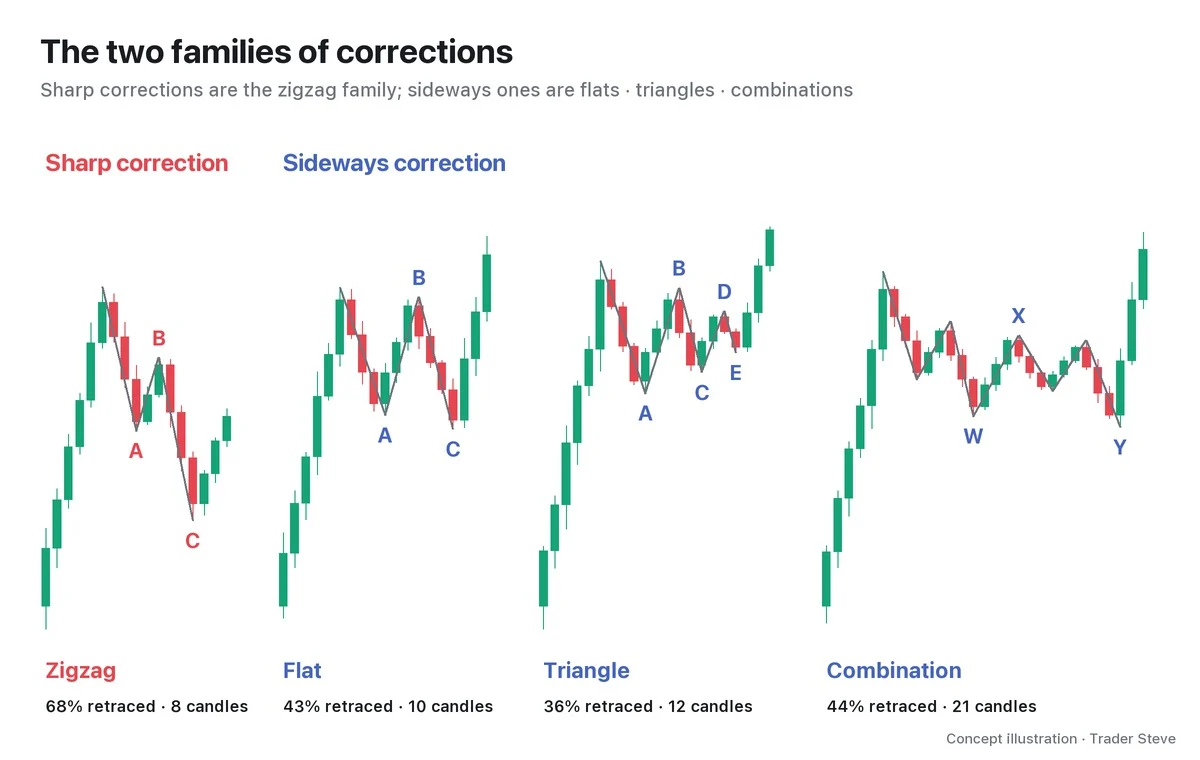
| Family | Typical shapes | Traits |
|---|---|---|
| Sharp correction | Zigzag (single, double, triple) | Falls deep and fast. Doesn't threaten the prior high again |
| Sideways correction | Flat, triangle, combination (WXY) | Shallow and long, moving up and down sideways. Often revisits the area near the prior high |
When you apply the guideline of alternation, simply telling "which family is this correction in?" is enough to start with. The structure of each shape is covered in Elliott Wave Zigzags (related lesson)·flat·triangle·combination.
Note that triangles almost never appear in the wave 2 position; they mostly show up as wave 4, wave B or the final X wave. That's why the most common alternation pairing in practice is a zigzag in wave 2 and a flat or triangle in wave 4.
3. Why They Look Different: Fear in Wave 2, Boredom in Wave 4
Alternation is explained by the fact that the two corrections sit in different places in market psychology.
- Where wave 2 appears: right after wave 1 has just rallied. Most traders still see wave 1 as "a bounce inside a downtrend." Once they feel the bounce is over, they rush to sell, and those who bought the low also get out quickly to protect their gains. So wave 2 often retraces fast and deep.
- Where wave 4 appears: after wave 3 has rallied hard. Now the uptrend is obvious to everyone. Those who made money in wave 3 take some profit, but little size gets dumped by people doubting the trend. Would-be buyers wait for "a little cheaper." So rather than collapsing deeply, wave 4 more often drags on, shallow and sideways.
In short, wave 2 is a correction driven by fear, and wave 4 one driven by profit-taking and boredom. These different characters of each wave are covered in more detail in Elliott Wave Personality (related lesson).
I don't put Elliott Wave at the center of every trade. But when I sketch a scenario for the big-picture move, I think the theory has clear uses.
"It's not that I don't look at Elliott Wave, at wave theory. I do look at it. I use it as a reference. And where Elliott shines is when you try to sketch out a forecast scenario for the big-picture move — I think Elliott Wave is one of the few theories, almost the only one, that even tries to predict the future." — Trader Steve, live stream, Aug 20, 2026 (translated from Korean) · ▶ Watch the stream highlights (Korean audio)
The guideline of alternation works in the same spirit. If you write down the shape of wave 4 when wave 2 ends, you can make plans like "wave 4 may run long and sideways, so don't rush."
4. A Guideline, Not a Rule
One distinction is essential here. Elliott Wave has three cardinal rules and, separately, guidelines.
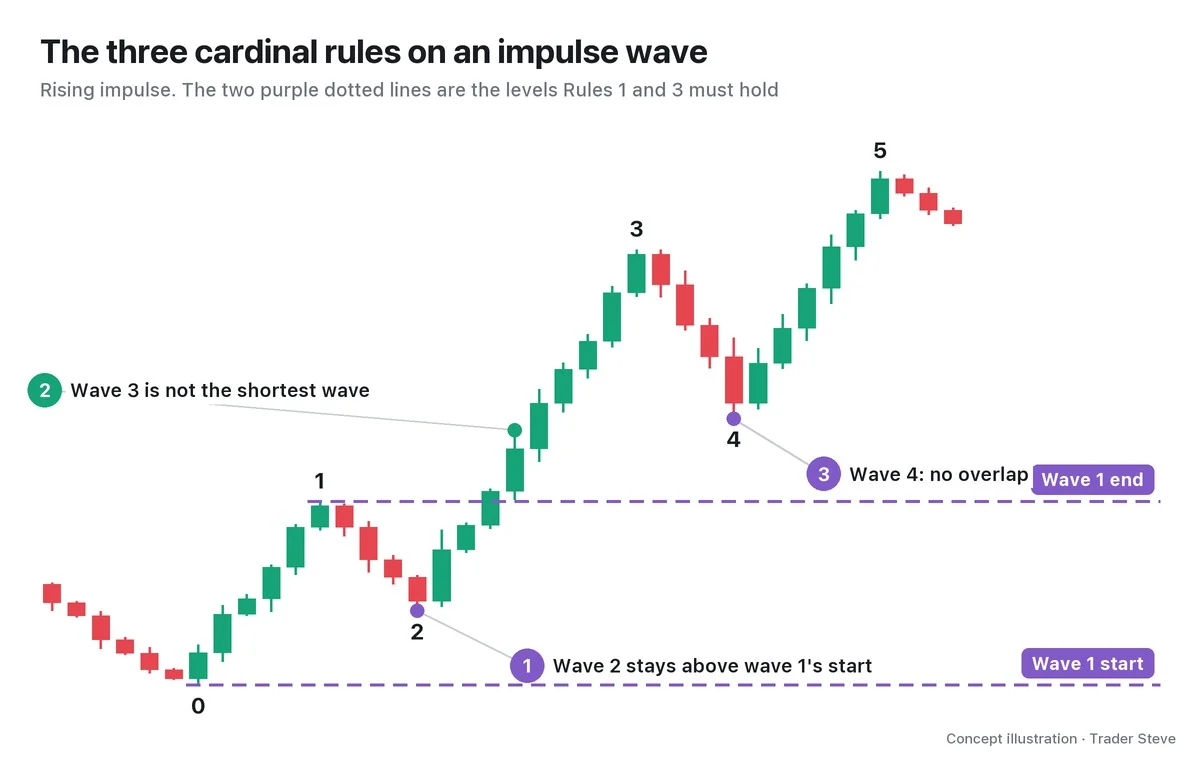
- The three cardinal rules: wave 2 never goes below the start of wave 1. Wave 3 is never the shortest of waves 1, 3 and 5. Wave 4 never overlaps the price territory around wave 1's high. Break even one, and you throw that wave count out (see Elliott Wave Rules and Guidelines, elliott/rules-guidelines).
- The guideline of alternation: a guideline that says "there is a tendency." It's common for waves 2 and 4 to both be sharp, or both to drift sideways. A mismatch doesn't make the count wrong.
What alternation tells you stops at "what will be different." It doesn't tell you when, or at what price, wave 4 will end. You find where it ends by stacking other tools such as Fibonacci retracement, channels and support zones. Your stop-loss reference always comes from the rules side (the count is invalid if wave 4 goes below wave 1's high).
Alternation can also show up in more than shape: in depth (deep ↔ shallow), time (short ↔ long) and complexity (simple ↔ complex). All four don't have to change at once.
5. On a Real Bitcoin Daily Chart
Let's look at a case of near-textbook alternation. This is one possible count of the Bitcoin daily chart after the November 2022 low, read as an impulse wave.
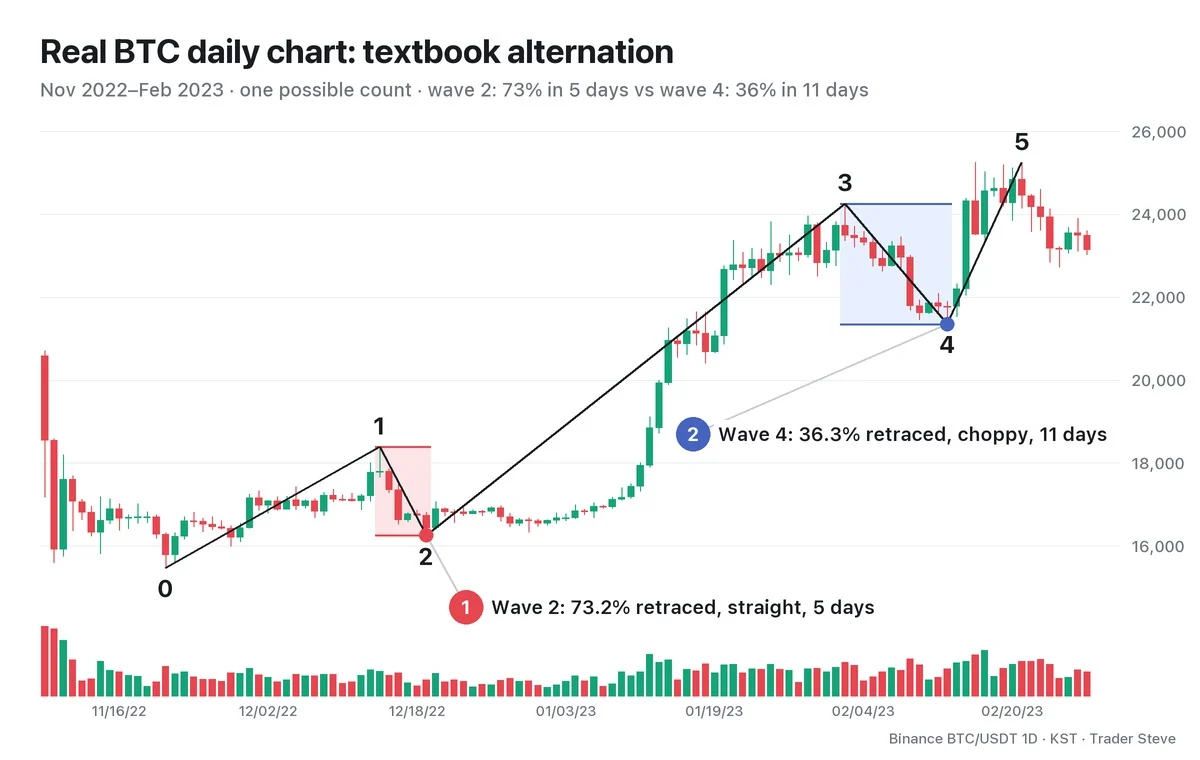
| Wave end | Date | Price |
|---|---|---|
| 0 (start) | Nov 21, 2022 | 15,476 |
| 1 | Dec 14, 2022 | 18,388 |
| 2 | Dec 19, 2022 | 16,256 |
| 3 | Feb 2, 2023 | 24,255 |
| 4 | Feb 13, 2023 | 21,351 |
| 5 | Feb 21, 2023 | 25,250 |
- Wave 2: retraced 73.2% of the wave 1 rally in just 5 days. A sharp correction that came down almost in one go, with no bounce in between.
- Wave 4: retraced only 36.3% of the wave 3 rally, but moved up and down for 11 days in three legs: down, bounce, down. A sideways correction that ran shallow and long.
- Rule check: the wave 2 low (16,256) is above point 0 (15,476). Wave 3's length (7,999) is about 2.7x wave 1's (2,912), making it the longest. The wave 4 low (21,351) is also above the wave 1 high (18,388). All three pass.
In depth, in time and in shape, waves 2 and 4 were opposites.
That said, this count was made in hindsight, and in real time alternation is often far less clean than this (Part 5).
Key Takeaways
- The guideline of alternation is the tendency for wave 2 and wave 4 of the same impulse wave to take different shapes.
- Sort corrections into two families: sharp corrections (the zigzag family) and sideways corrections (flats, triangles, combinations).
- Wave 2 tends to come fast and deep amid fear; wave 4 tends to come shallow and long amid profit-taking and boredom.
- It's a guideline, not a rule. It only helps you anticipate wave 4's "shape"; it doesn't tell you the price where it ends.
In Part 2, we'll cover how to separate sharp corrections from sideways ones with numbers, along four axes: depth, time, shape and complexity.
If measuring the depth and time of every wave and writing up scenarios by hand for each market is hard to keep up with, the report below may help.
This lesson adapts the text, figures and live-stream quotes of the Trader Steve TA series for the web, translated from the original Korean. Check the text and figure captions for the timing and interpretation of each real example, and read conceptual diagrams and real charts separately.
Corrections: support@omnisight.report