What Is Elliott Wave Theory? The 5-3 Structure and Why It Forms
Historical examples for learning · not current prices or trade recommendations.
Contents
Price rarely moves in a straight line. It advances, pauses, and advances again. Elliott Wave theory (EWT) puts numbers on that rhythm. This lesson uses charts to explain the core 5-3 structure: what it means, why it forms, and what it looks like on a real chart.
All dates and times are Korea Standard Time (KST, UTC+9). A daily candle is dated by its 09:00 KST open, and the time shown for an intraday candle is the time that candle opens. The actual intraday time of a high or low is stated separately.
1. The One-Line Definition: Five Waves Forward, Three Waves Back
Elliott Wave is the observation that the market traces five waves in the direction of the larger trend and three waves against it.
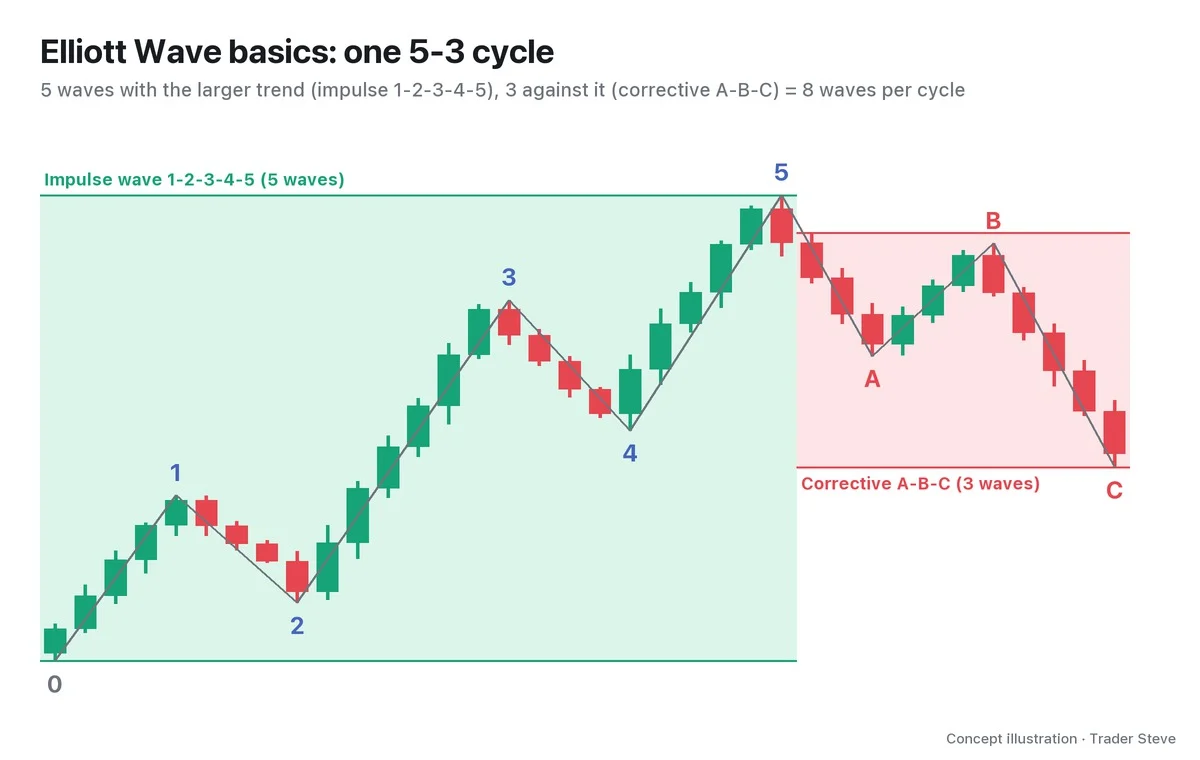
- Motive wave: the five waves that move in the direction of the larger trend. There are two types, the impulse wave and the diagonal. The figures in this lesson show impulse waves, labeled with the numbers 1-2-3-4-5.
- Corrective wave: the three waves that move the opposite way after the impulse ends, labeled with the letters A-B-C.
- 5-3 pattern: 5 impulse waves + 3 corrective waves = 8 waves, which together form one complete cycle.
The figure shows an uptrend. In a downtrend, simply flip it upside down.
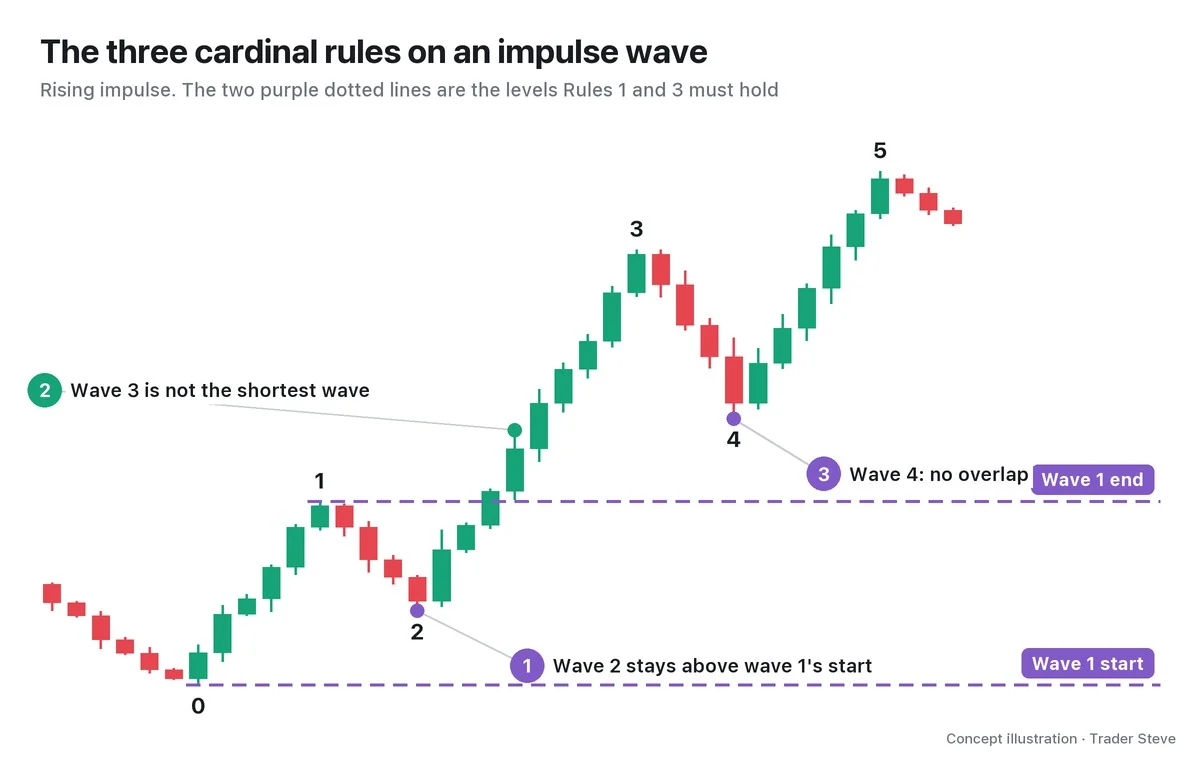
Three conditions are checked whenever you number the waves. Wave 2 never goes below the start of wave 1; wave 3 is never the shortest of waves 1, 3 and 5; and wave 4 never drops into wave 1's price territory. These are the three cardinal rules, and the reasons behind them are covered in Elliott Wave Rules and Guidelines (related lesson).
2. Where It Came From: A Theory Built on Dow Theory
Ralph Nelson Elliott (R. N. Elliott) developed the theory in the 1930s by studying stock indexes, and published it in 1938 as The Wave Principle. The notation used today took hold after Frost and Prechter's Elliott Wave Principle (1978) became the standard textbook.
Underneath it sits Dow Theory: "higher highs and higher lows make an uptrend; lower highs and lower lows make a downtrend" (how to define a trend with highs and lows is covered in basics/swing-trend). Elliott took the sequence of those highs and lows and numbered it, trying to read not just the trend but "which leg of the advance are we in?"
"It's no exaggeration to say there's no trading method that falls outside structure theory — what people call Dow Theory. Even something like Elliott Wave, where you pull a view out of pure imagination by drawing lines up and down, is built on Dow Theory. Take the most extreme case within Dow Theory, and that's Elliott." — Trader Steve, live stream, Aug 27, 2026 (translated from Korean) · ▶ Watch the stream highlights (Korean audio)
I don't use Elliott Wave as the main basis for my trades. But I do think it is useful as a map for sketching "where in the bigger trend might we be right now?"
3. Why 5-3: The Rhythm of Money and Crowd Psychology
The usual explanation for five waves up and three waves of rest is crowd psychology.
- Wave 1: most people are skeptical, and a few buy early.
- Wave 2: doubt and profit-taking push price back, but not all the way to the starting point.
- Wave 3: more people pile in, and it is often the strongest wave.
- Wave 4: early buyers take profits and the market pauses.
- Wave 5: latecomers who finally became convinced jump on. Price goes higher, but momentum tends to fade.
- A-B-C: price drops in A, bounces in B in a way that makes people think "is it going again?", then drops once more in C.
"You really can't ignore what's called wave structure. Because rises and falls always come out as ABC. … Price moves in waves, repeating rises and falls. This isn't just a belief — the players who actually move price only make money if they move it this way." — Trader Steve, live stream, Aug 20, 2026 (translated from Korean) · ▶ Watch the stream highlights (Korean audio)
Here, "ABC" is broader than the corrective A-B-C: it means "one move in a single direction made of three legs." In formal terms, a move with the larger trend is a 5-wave impulse, and a move against it is an A-B-C correction. In a downtrend, the declines are 1-2-3-4-5 and the bounces are A-B-C.
The order of cause and effect matters. Waves don't move price — money moves price, and waves are the footprints that money leaves behind.
"Price only goes up when money pushes it up. It doesn't go up because it's following some Elliott Wave. Price only rises when someone pushes it higher, buying at ever higher prices." — Trader Steve, live stream, Oct 23, 2026 (translated from Korean) · ▶ Watch the stream highlights (Korean audio)
"It's wave 3, so it will go up" gets the order backward. A wave-3 shape is simply what's left behind when money willing to pay higher prices comes in.
4. Actionary and Reactionary Waves, Plus a First Look at Wave Degrees
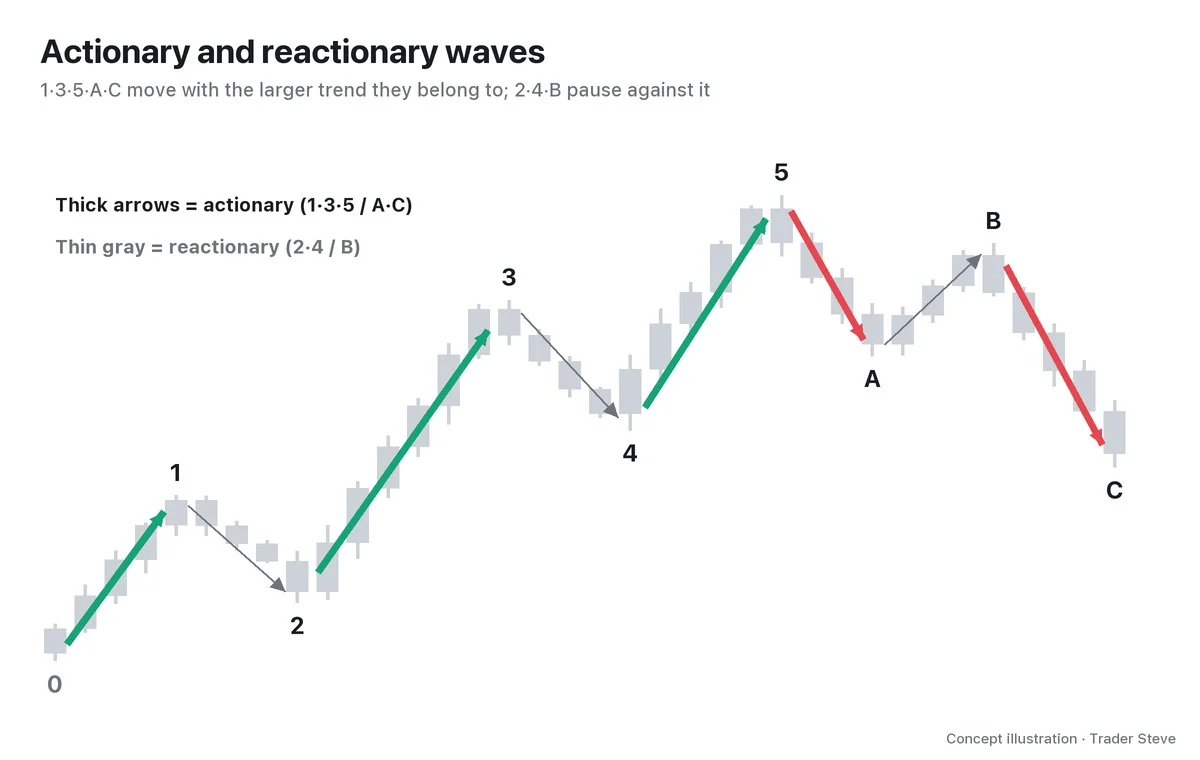
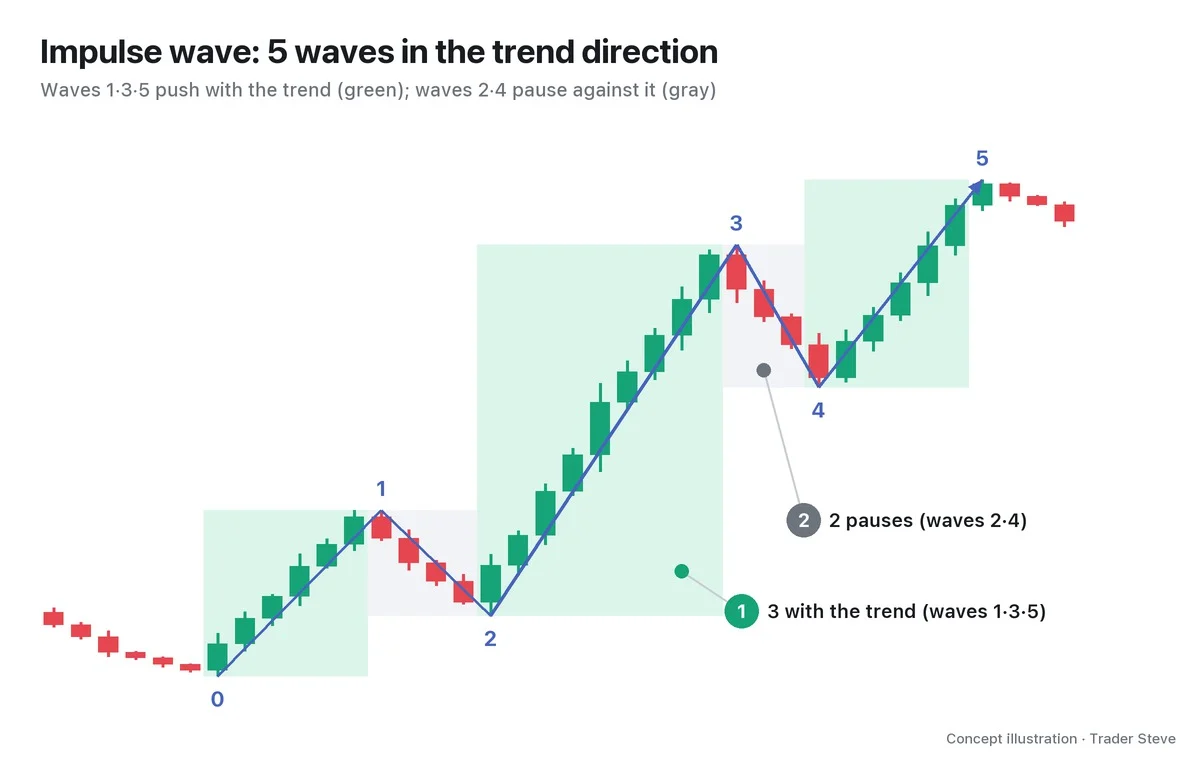
- Actionary wave: moves in the same direction as the trend one degree larger that it belongs to. Waves 1, 3 and 5, and waves A and C.
- Reactionary wave: pauses against that trend. Waves 2 and 4, and wave B.
A and C are actionary even though they move down, because the whole A-B-C is one "larger correction" and A and C move in its direction.
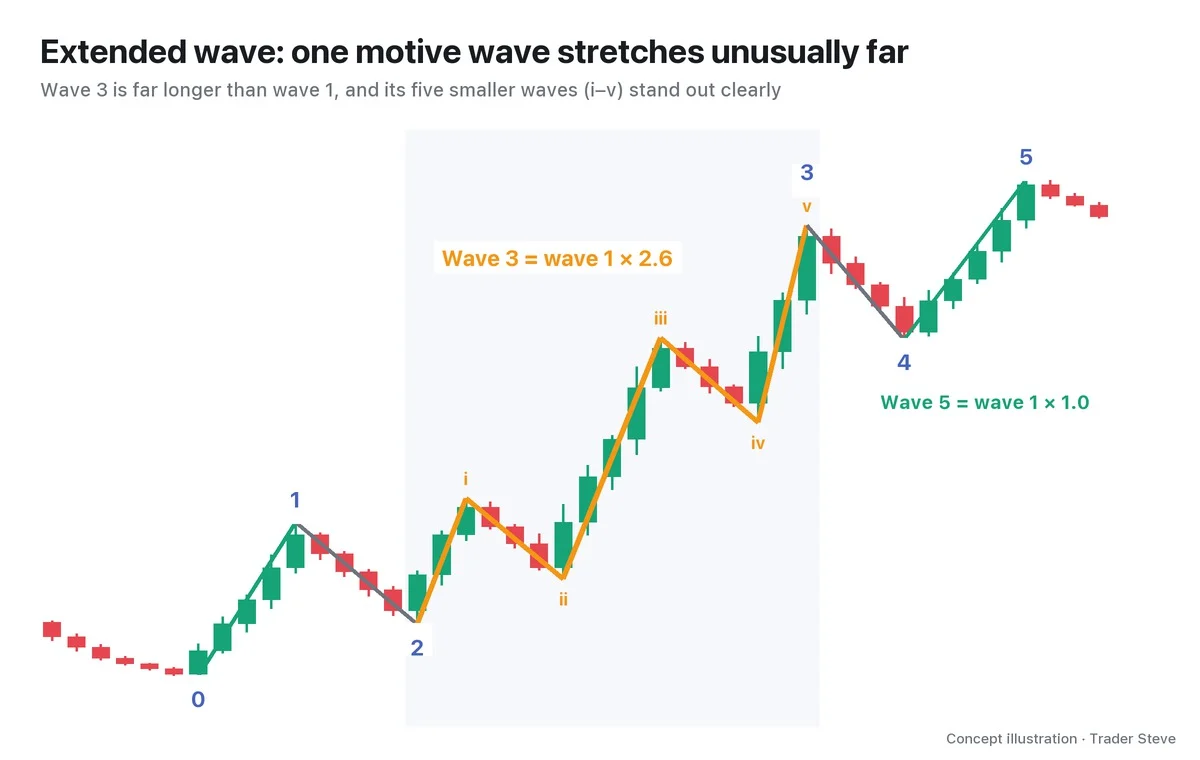
This distinction leads into wave degree. Small 5-3 cycles link together to form a 5-3 one degree larger.
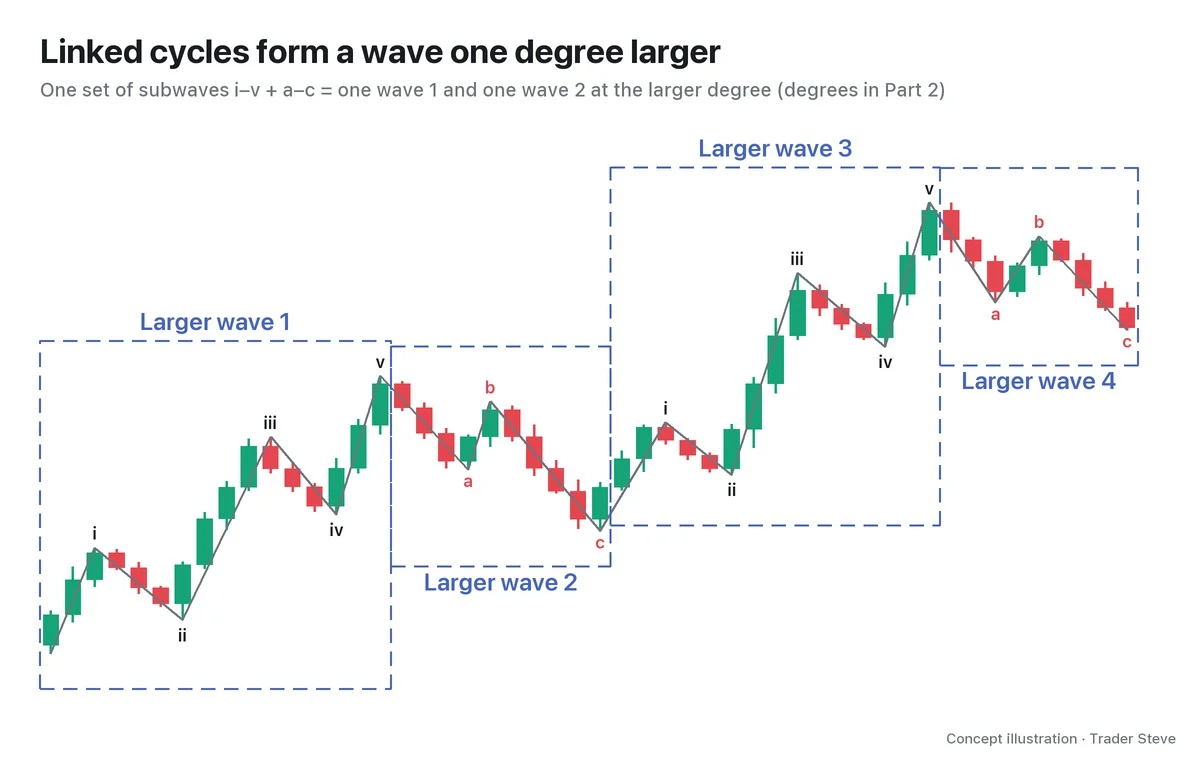
The way small waves resemble large ones is called fractal (self-similar) behavior. That is why "it's wave 3 right now" can point to a completely different place depending on the scale you're looking at. Notation by degree and the rules for how waves subdivide are covered in Part 2.
5. A Real Chart: The 5-3 on the Ethereum Daily Chart
You can find this shape on real charts, too. Below is one possible count applied to the Ethereum daily chart from Jun to Oct 2026.
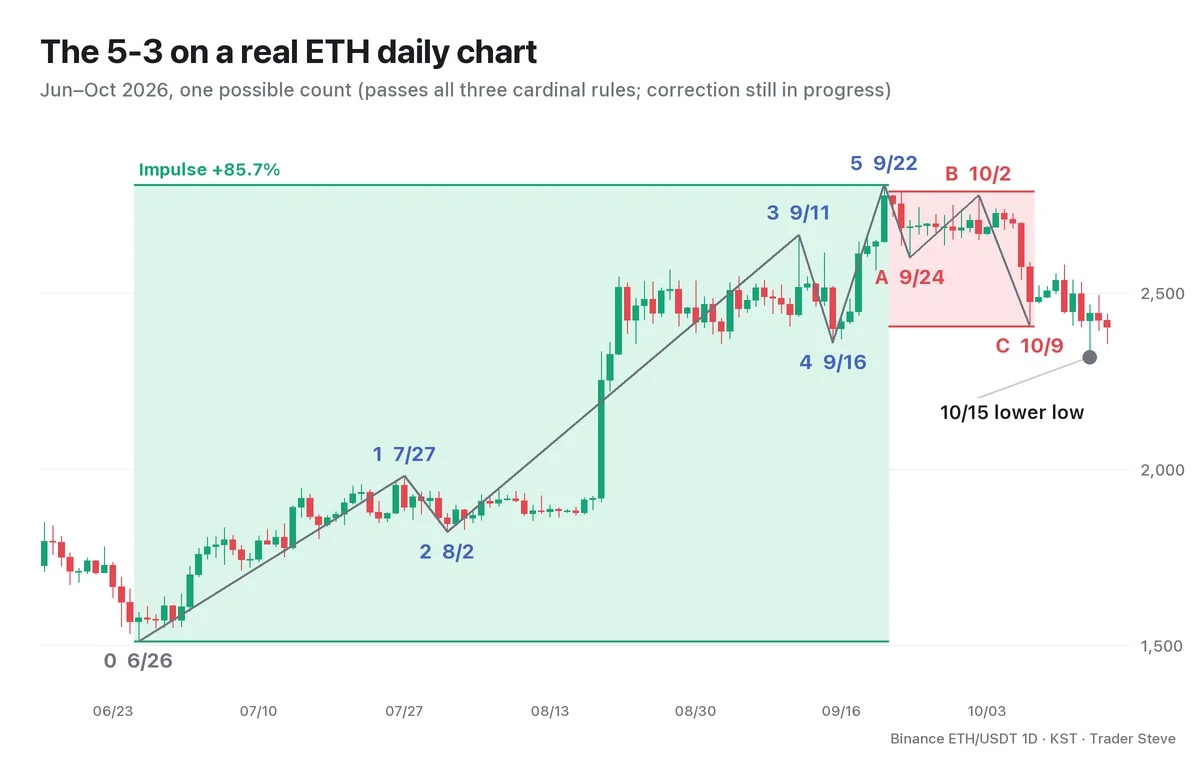
Each count point was set by finding the highest high and lowest low of each segment on the 1-hour chart.
| Wave | End time (KST) | Price | What I checked |
|---|---|---|---|
| 0 → 1 | Jul 27, 15:00 | 1,981.2 | Wave 1 length 469.2 |
| 2 | Aug 2, 03:00 | 1,822.1 | Retraced only 0.339 of wave 1; above the start (1,512.0) |
| 3 | Sep 11, 23:00 | 2,666.0 | Length 843.9 = 1.80x wave 1; the longest wave |
| 4 | Sep 16, 03:00 | 2,358.9 | Retraced 0.364 of wave 3; above wave 1's high (1,981.2) |
| 5 | Sep 22, 05:00 | 2,807.3 | Length 448.5 |
| A · B · C | 9/24 · 10/2 · 10/9 | 2,600.2 · 2,777.3 · 2,406.1 | B bounced 0.855 of A; C is 1.79x the length of A |
Checked against the three cardinal rules, it passes all three.
But this is an interpretation. Other counts that respect the rules can be drawn too (Part 4 compares them), and because Oct 15 printed a low below C, there is no way to know yet whether the correction is over. A wave count is a tool for organizing "where might we be right now," not a signal that confirms the next move.
Key Takeaways
- Elliott Wave treats 5 impulse waves (1-2-3-4-5) in the direction of the larger trend + 3 corrective waves (A-B-C) against it = 8 waves as one cycle.
- It numbers the sequence of highs and lows from Dow Theory. Waves are not the cause; they are the footprints money leaves behind.
- Waves 1·3·5·A·C are actionary; waves 2·4·B are reactionary.
- Small 5-3 cycles combine into larger 5-3 cycles (wave degree, fractal).
- A count on a real chart is one interpretation, not a confirmed signal.
Impulse waves are covered in detail in Elliott Wave Impulse Waves (related lesson). In Part 2, we'll cover how to actually count the 5-3 and how wave degrees work (smaller waves inside larger ones).
Doing the count and checking the rules by hand on every chart takes time. The Omnisight Report includes Elliott Wave as one of several perspectives and lays it out for each market.
This lesson adapts the text, figures and live-stream quotes of the Trader Steve TA series for the web, translated from the original Korean. Check the text and figure captions for the timing and interpretation of each real example, and read conceptual diagrams and real charts separately.
Corrections: support@omnisight.report