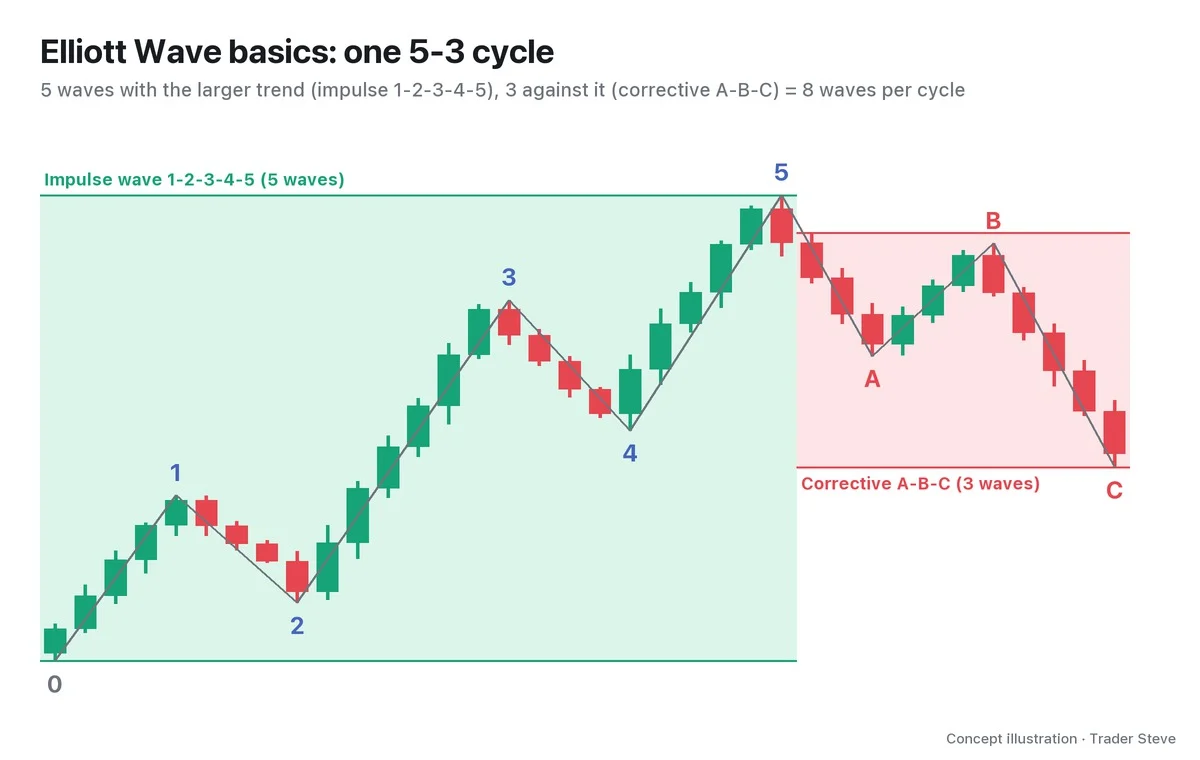
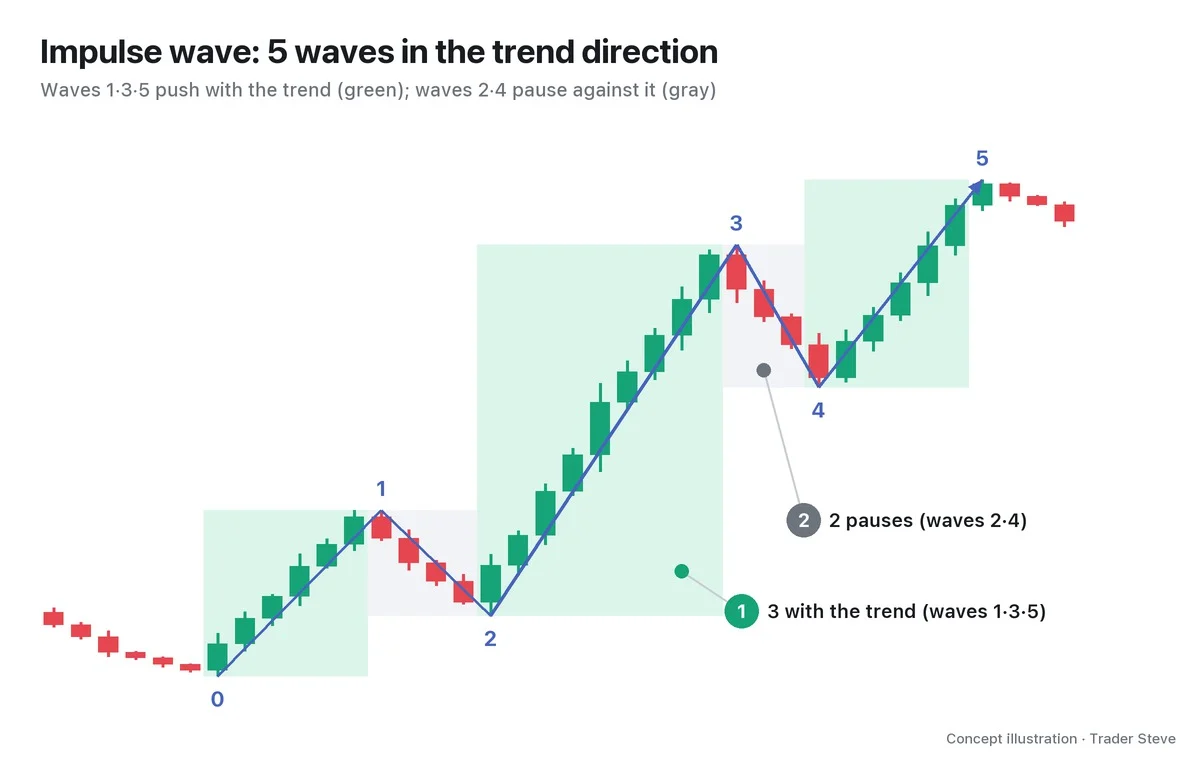
What Is Elliott Wave Channeling? Using Parallel Lines to Frame Wave Ends
Historical examples for learning · not current prices or trade recommendations.
Contents
In the previous topic, Elliott Wave Alternation (related lesson), I covered what shape waves 2 and 4 are likely to take. Once you have a guess at the shape, the next question is "so how far will it go?" The tool for that is channeling. This lesson uses diagrams and a real Bitcoin (BTC) chart to show how two parallel lines let you sketch in advance where the next wave may end, and the three jobs a channel does for you.
All dates and times are Korea Standard Time (KST, UTC+9). A daily candle is dated by its 09:00 KST open, and the time shown for an intraday candle is the time that candle opens. The actual intraday time of a high or low is stated separately.
1. The One-Line Definition: Impulse Waves Travel Between Two Parallel Lines
Frost and Prechter explain that an impulse wave tends to move between two parallel lines. That corridor is the trend channel, and drawing it to estimate where the next wave will end is called channeling.
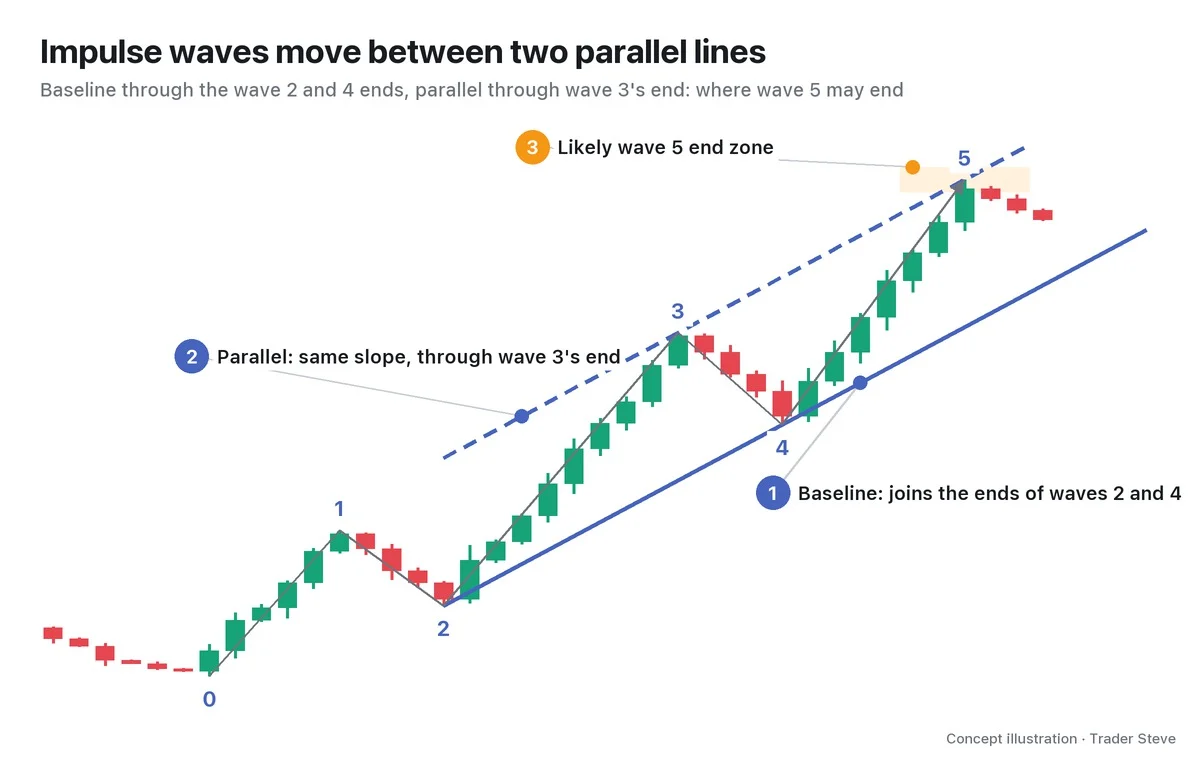
A channel is made of two lines.
- Baseline: a line joining the ends of two waves that move in the same direction. For example, joining the end of wave 2 and the end of wave 4 gives you the "2-4 line."
- Parallel line: the baseline copied at the same slope and placed on the end of the wave on the opposite side. For a 2-4 line, it goes through the end of wave 3.
The space between the two lines is the channel, and it gives you a range where a wave that hasn't finished yet could end. You are not calling a single price; you are setting a range in advance.
2. Why Parallel Lines: A Trend That Climbs at a Steady Rhythm
An uptrend is a move that raises the highs and the lows together ("Swings and Trend," basics/swing-trend). When the pushes and the pauses come at a similar rhythm, the line through the lows and the line through the highs end up with almost the same slope. That is a parallel channel.
"Things like Elliott Wave are all built on Dow Theory. If you pick out the extreme cases within Dow Theory, that's Elliott. … Parallel channels, too — obviously they're built on Dow Theory." — Trader Steve, live stream, Aug 27, 2026 (translated from Korean) · ▶ Watch the stream highlights (Korean audio)
Elliott Wave and parallel channels share the same roots. So wrapping an impulse wave in a channel is close to reading the same trend in two languages. Conversely, if the two lines are not parallel and instead narrow or widen, you are not looking at a channel; suspect a diagonal (see Elliott Wave Diagonals, elliott/diagonals) or a triangle (see Elliott Wave Triangles, elliott/triangle).
3. Three Jobs a Channel Does
Channeling is not something you draw once and leave. You redraw the lines each time a wave ends, and each time they answer a different question.
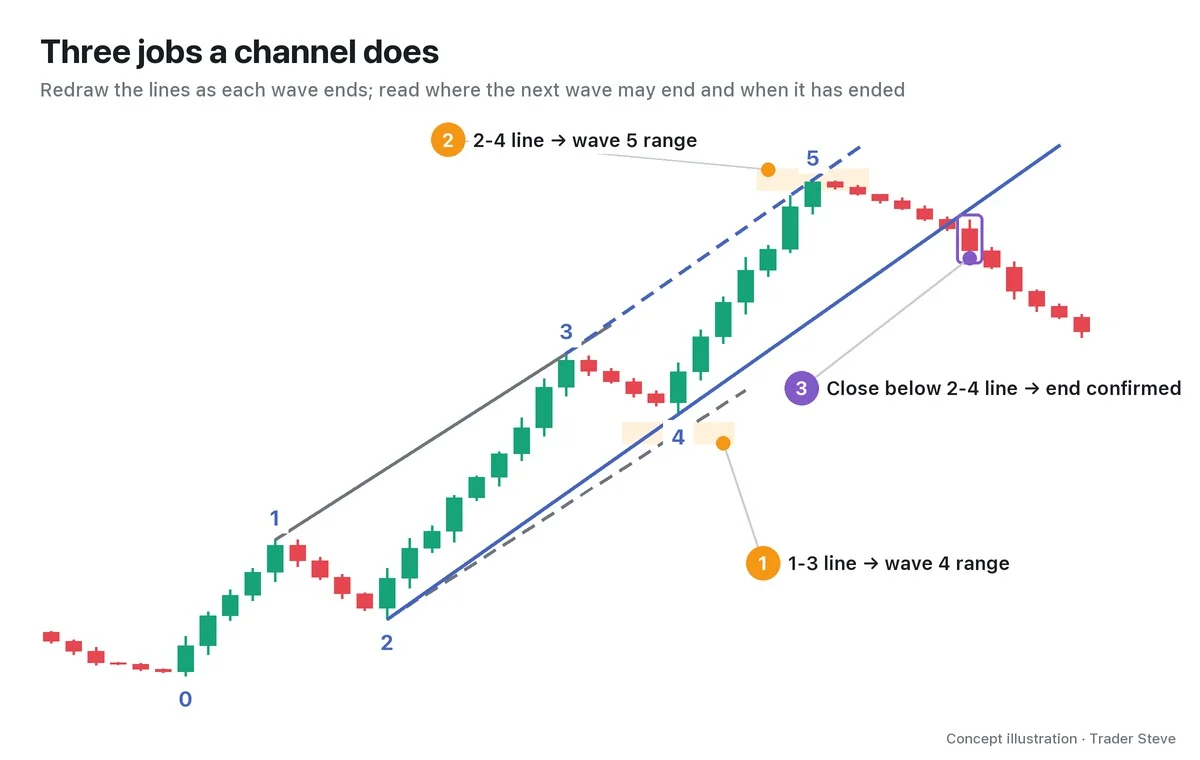
| When | Line you draw | Question it answers |
|---|---|---|
| After wave 3 ends | the 1-3 line through the ends of 1 and 3 + a parallel through the end of 2 | Where might wave 4 stop? |
| After wave 4 ends | the 2-4 line through the ends of 2 and 4 + a parallel through the end of 3 | Where might wave 5 end? |
| After wave 5 prints | the same 2-4 line | Has the impulse really ended? |
The third job matters most. In this topic, a candle that closes at least 0.4% below the 2-4 line counts as a "break of the 2-4 line," and I use it as confirmation that the impulse has ended. A wick that pokes through and comes back doesn't count. The break only confirms the end of this impulse; it does not confirm that the larger trend has reversed.
You will also meet names like the base channel, which joins the ends of 0 and 2, and the throw-over, where wave 5 briefly pushes past the parallel line and comes back. Part 2 covers the order and the rules for drawing them.
That said, a channel is not a machine for predicting the future.
"When you're trying to sketch a forecast scenario for the big-picture move, I think Elliott Wave is one of the few theories — almost the only one, really — that even tries to forecast the future." — Trader Steve, live stream, Aug 20, 2026 (translated from Korean) · ▶ Watch the stream highlights (Korean audio)
I see Elliott Wave as "at least a tool that lets you sketch the future," and not much more. What makes a channel useful within that is that it gives you a range and also tells you when you're wrong. If wave 4 cuts well through the wave 2 parallel, recheck the count; if wave 5 turns well short of the parallel, read it as a warning that the move is losing strength ("Truncation," elliott/truncation). Wave counts can differ from person to person, but once the wave points are fixed, anyone who draws the lines will put them in the same place.
4. How It Differs From Basic Trendlines and Channels
The parallel channel itself is the same tool covered in Basics Trendlines and Channels (related lesson). The difference is which points you draw from, and when you redraw.
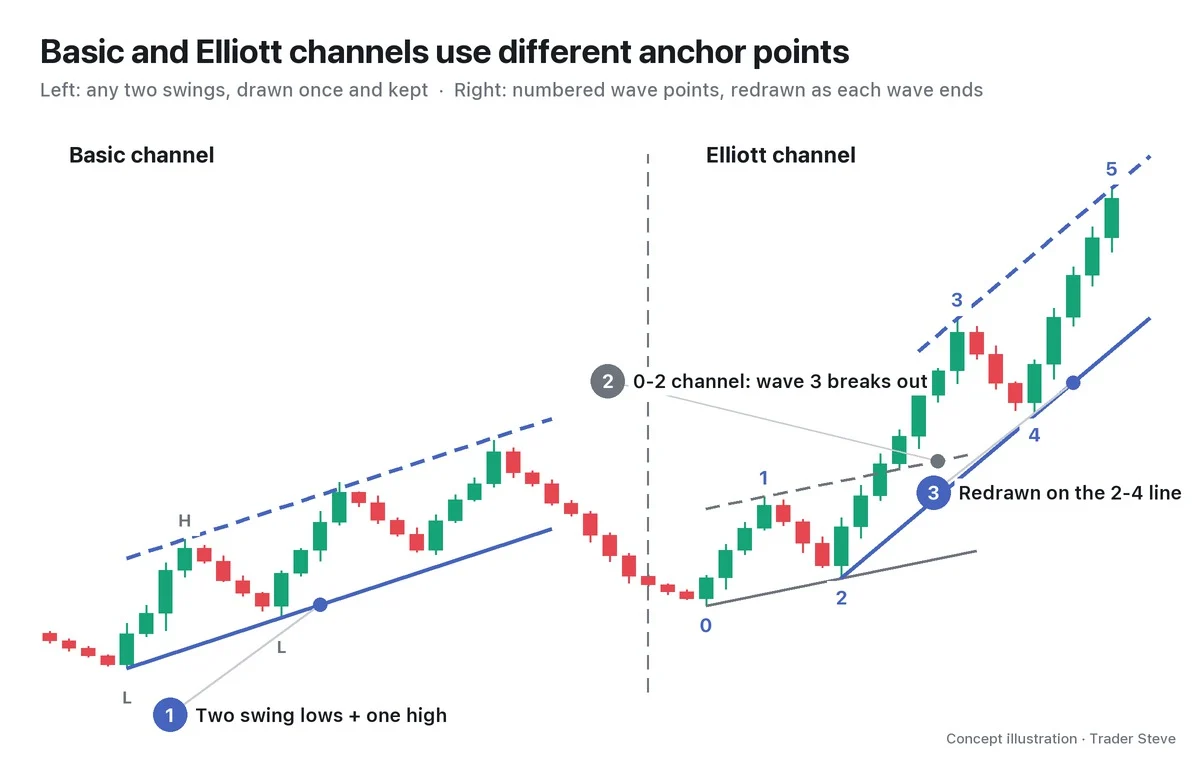
- Basic channel: join two prominent swing lows and place a parallel on the high between them. You keep the channel once it's drawn and watch whether price respects the lines.
- Elliott channel: draw only from points that carry a wave number, and redraw each time a wave ends. The 0-2 channel is just a frame for the start of wave 3; once wave 3 ends you switch to the 1-3 line, and once wave 4 ends, to the 2-4 line.
So an Elliott channel is a series of pictures that keeps changing while the waves unfold. When an old line breaks, that isn't a failure; it's time to draw the new one.
5. A First Look on a Real BTC Chart
Let's check it once on a real chart. Below is one possible count applied to the Bitcoin 4-hour chart for Aug 2025 (times in KST). Different people can count the waves differently.
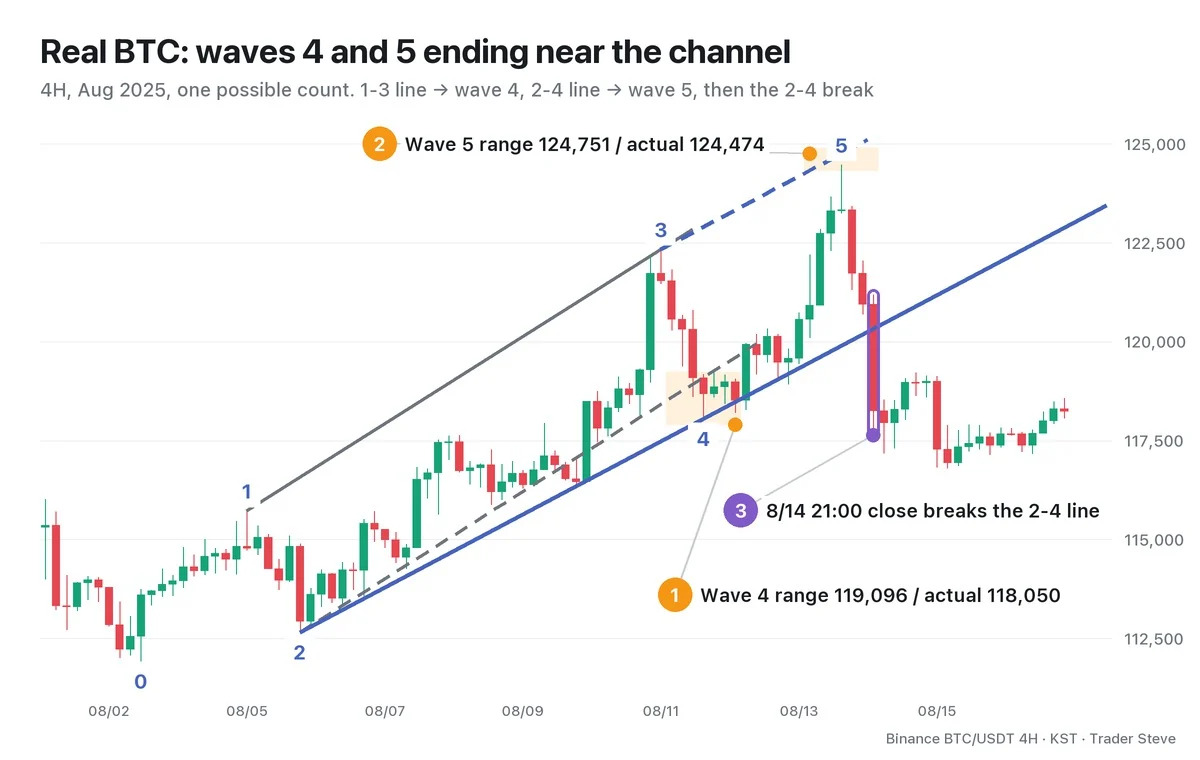
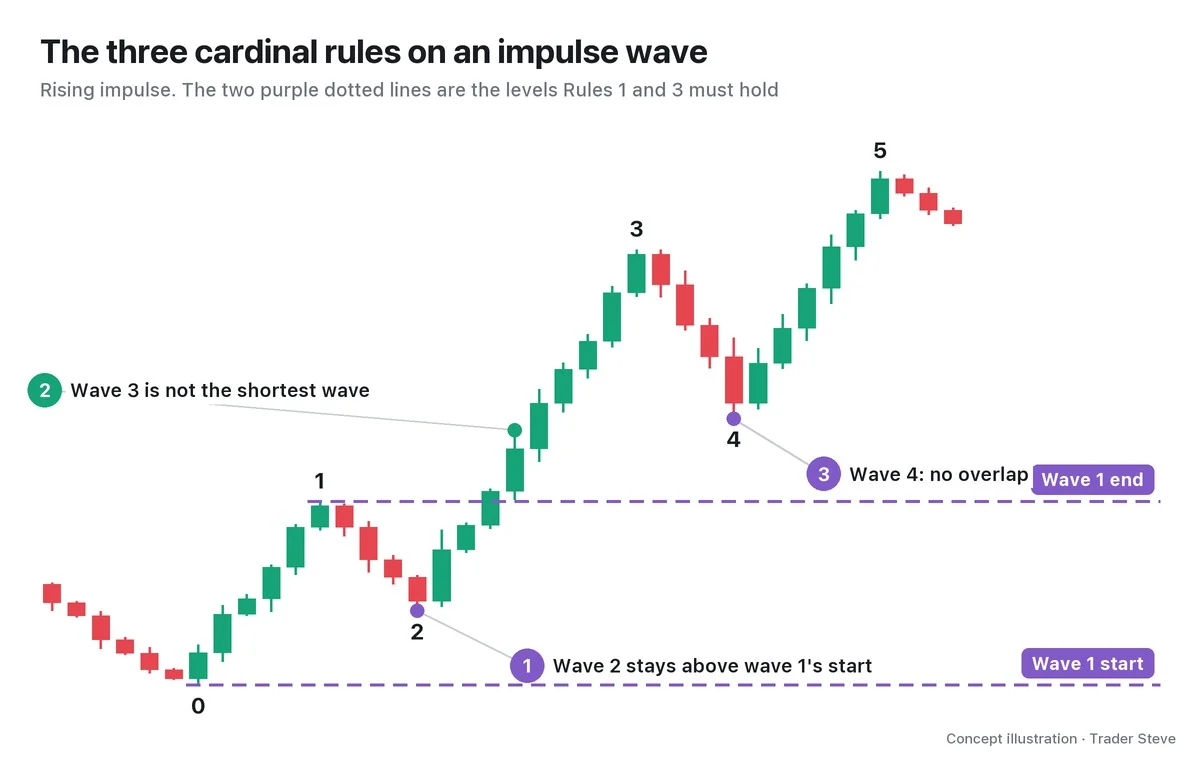
Point 0 is 111,920 at 09:00 on Aug 3, and point 5 is 124,474 at 09:00 on Aug 14. First, all three cardinal rules hold: the wave 2 low is above 0, wave 3 (9,685) is longer than wave 1 (3,800) and wave 5 (6,424), and the wave 4 low of 118,050 stopped above the end of wave 1 at 115,720. Drawing the channels in order gives this:
- After wave 3 ends, draw the 1-3 line and place a parallel on the end of wave 2. Its value at the time of wave 4 is 119,096. The actual wave 4 stopped at 118,050, 0.88% below it.
- After wave 4 ends, draw the 2-4 line and place a parallel on the end of wave 3. Its value at the time of wave 5 is 124,751. The actual wave 5 high was 124,474, a 0.22% difference.
- Three candles after the wave 5 high, the 21:00 candle on Aug 14 closed at 118,257. That is 1.72% below the 2-4 line at that point (120,324). Later, the 01:00 candle on Aug 16 fell to 116,804, below the wave 4 low.
In this stretch, a few lines pointed to where waves 4 and 5 would end to within 1%, and the line also told you when the move had ended. Of course, it isn't always this clean. Part 4 covers real cases where price overshoots or falls short of the parallel line.
Key Takeaways
- Channeling uses two lines — a baseline + a parallel line — to sketch in advance the range where the next wave may end.
- Parallel lines work because of the Dow Theory trend, which raises highs and lows at the same rhythm.
- The 1-3 line shows where wave 4 may end and the 2-4 line where wave 5 may end; a close below the 2-4 line after wave 5 confirms that the impulse has ended.
- Draw only from numbered wave points and redraw each time a wave ends. It is not a tool for calling the exact spot; it gives you a range and a confirmation rule.
In Part 2, we'll cover the actual order for drawing the 0-2, 1-3 and 2-4 lines, a checklist, and channels for zigzag corrections.
Related reading: the 5-3 structure and wave degrees in "Elliott Wave Basics" (related lesson), the shape of an impulse wave in Elliott Wave Impulse Waves (related lesson), and how to draw an ordinary parallel channel in Basics Trendlines and Channels (related lesson).
If redrawing wave counts and channels by hand for one market after another feels like a chore, the Omnisight Report below organizes that work for each market.
This lesson adapts the text, figures and live-stream quotes of the Trader Steve TA series for the web, translated from the original Korean. Check the text and figure captions for the timing and interpretation of each real example, and read conceptual diagrams and real charts separately.
Corrections: support@omnisight.report