What Is a Combination? The WXY Complex Correction and Why It Forms
Historical examples for learning · not current prices or trade recommendations.
Contents
You enter thinking the correction ended with a single ABC, and then price turns over once more and drags sideways for a long while. In Elliott Wave, this shape — two or three corrections strung together — is called a combination (also known as a complex correction). This lesson uses diagrams to show what a combination is, why it forms, and what it looks like on a chart.
All dates and times are Korea Standard Time (KST, UTC+9). A daily candle is dated by its 09:00 KST open, and the time shown for an intraday candle is the time that candle opens. The actual intraday time of a high or low is stated separately.
1. The One-Line Definition: Correction + X + Correction
A combination is a long, sideways correction made of two or three simple corrective patterns (zigzag, flat, triangle) joined by a connecting wave, X.
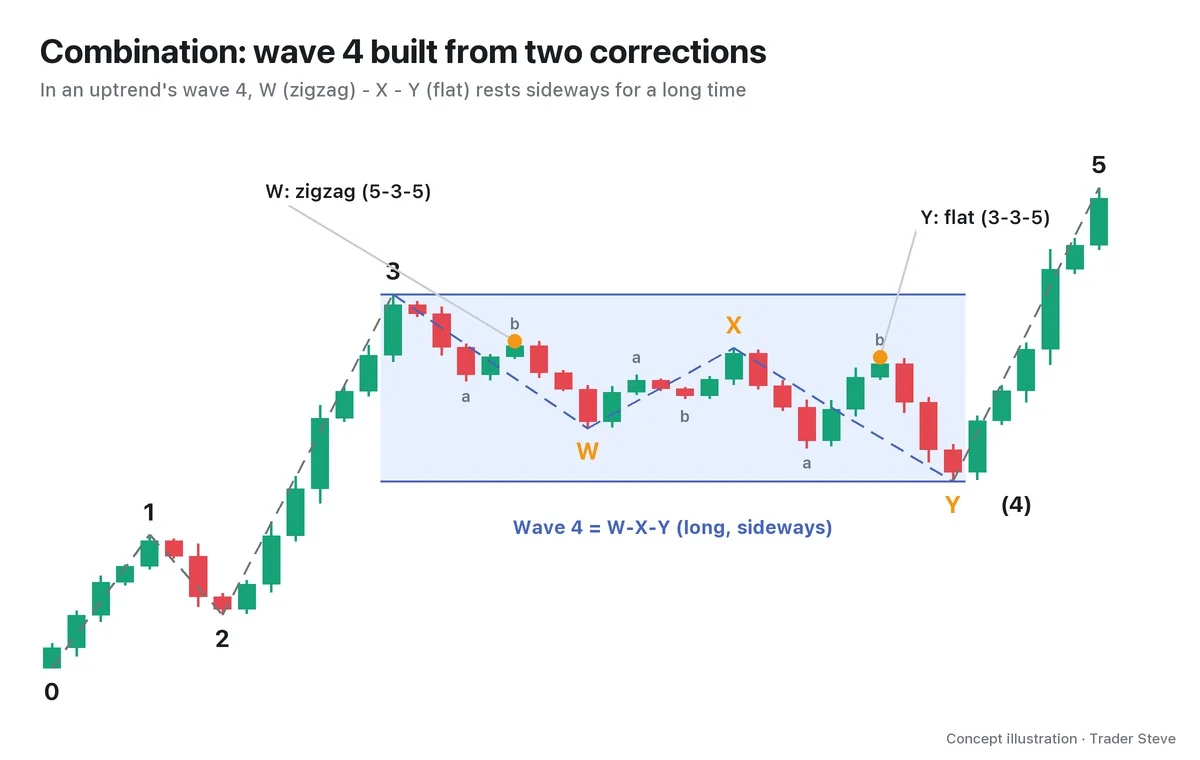
The names may be unfamiliar, but the makeup is simple.
| Name | Label | Makeup |
|---|---|---|
| Double three | W-X-Y | 2 corrections + 1 X |
| Triple three | W-X-Y-X-Z | 3 corrections + 2 Xs |
| Connecting wave (X wave) | X | a correction in the opposite direction that links two corrections (any size; usually a zigzag) |
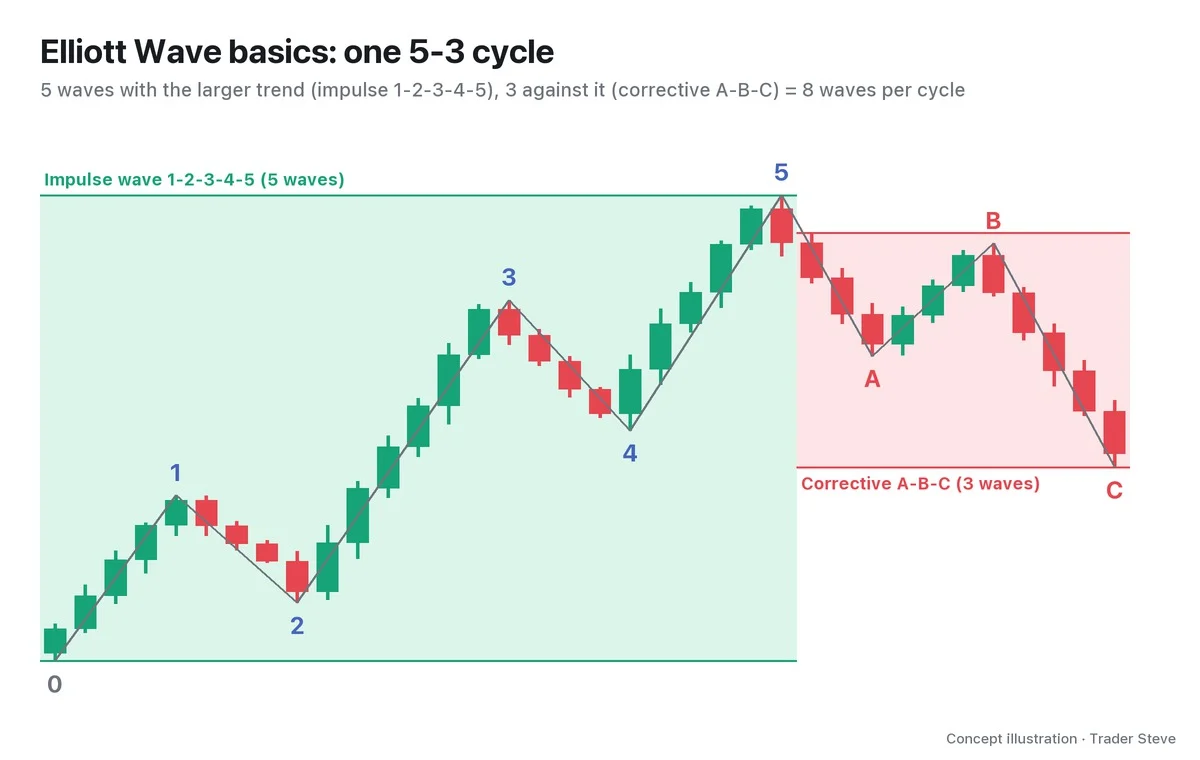
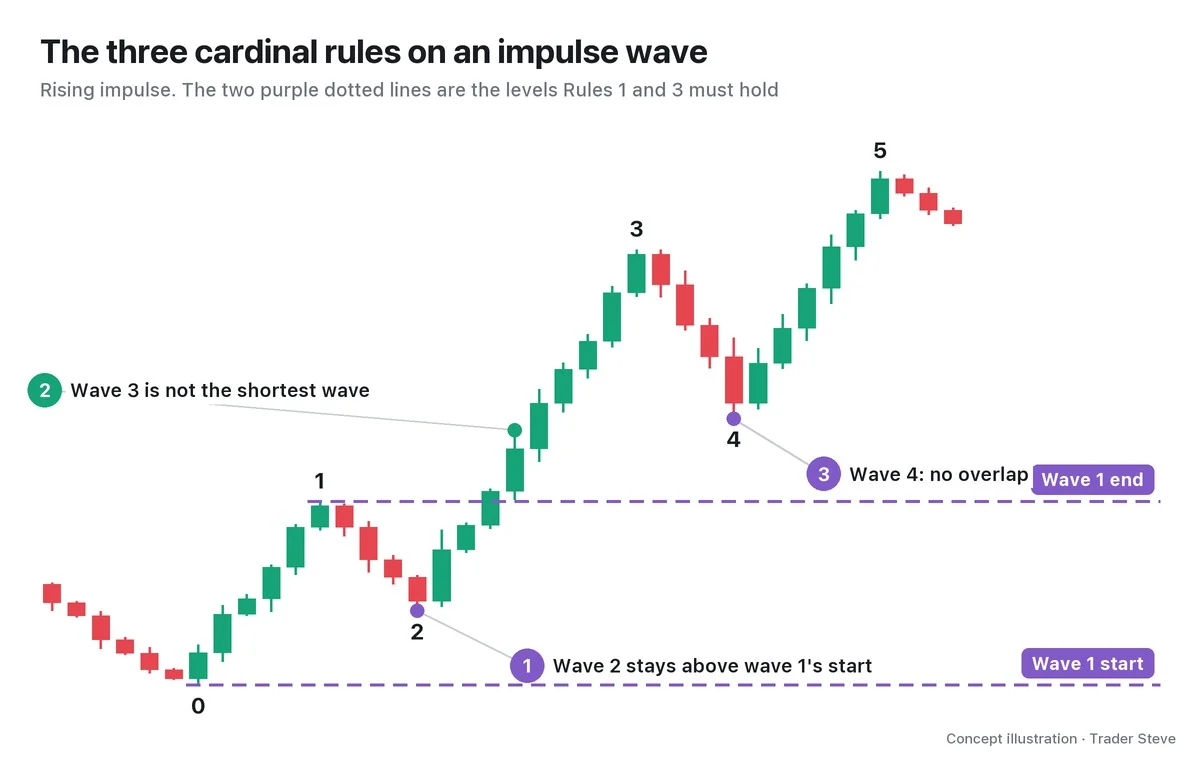
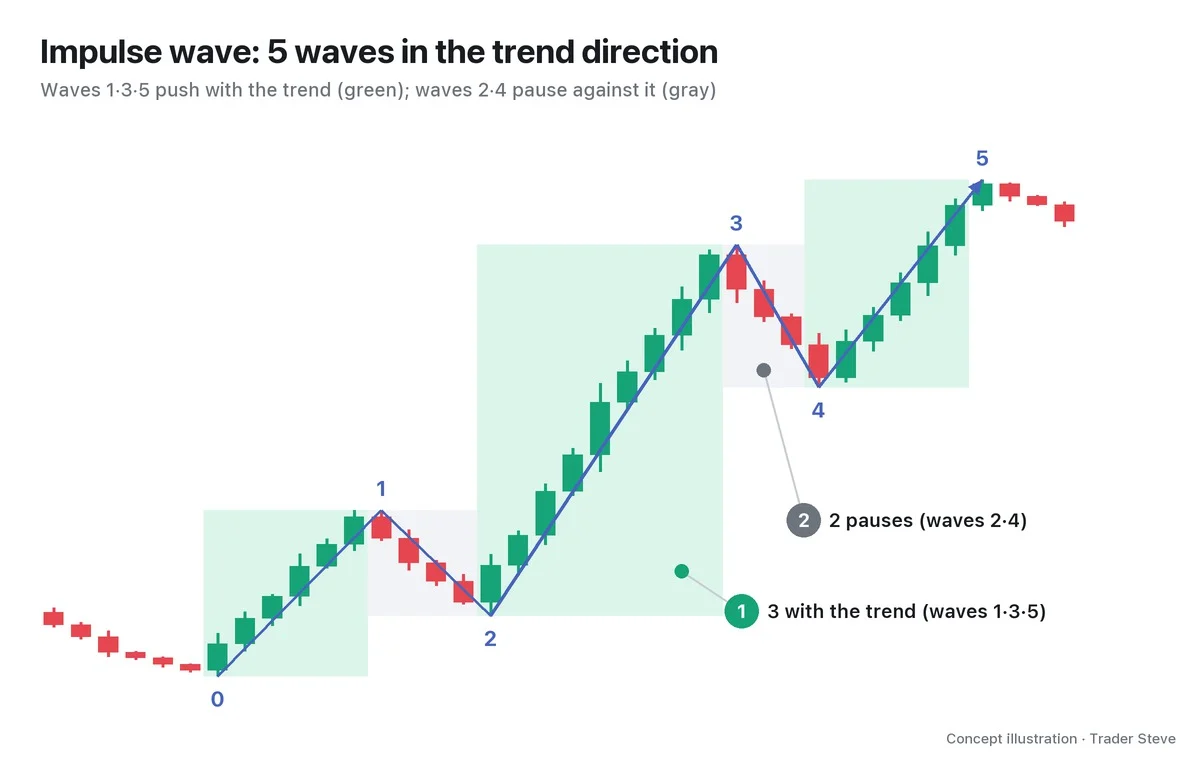
The key point to remember is that W, X, Y and Z are all corrective waves. Each one subdivides into the "3" side of the 5-3 structure from the Elliott Wave Basics lessons — A-B-C, or A-B-C-D-E if it is a triangle. X is no exception. X moves opposite to W, but it is not a trend wave; it is a correction in its own right. There is no fixed limit on its size — the Xs in Part 4 retrace 62.7–95.2% of W. If you see a five-wave impulse structure inside, suspect a different count rather than a combination.
In Figure 1, wave 3 rose in just 7 candles, while wave 4, built as W-X-Y, moved sideways for 23 candles. Price doesn't fall much, but time stretches out — that is the first impression a combination gives.
2. Why It Forms: The Price Target Is Met, but Not the Time
A correction is where the prior trend takes a rest. But resting takes two things: price (how far it retraces) and time (how long it rests).
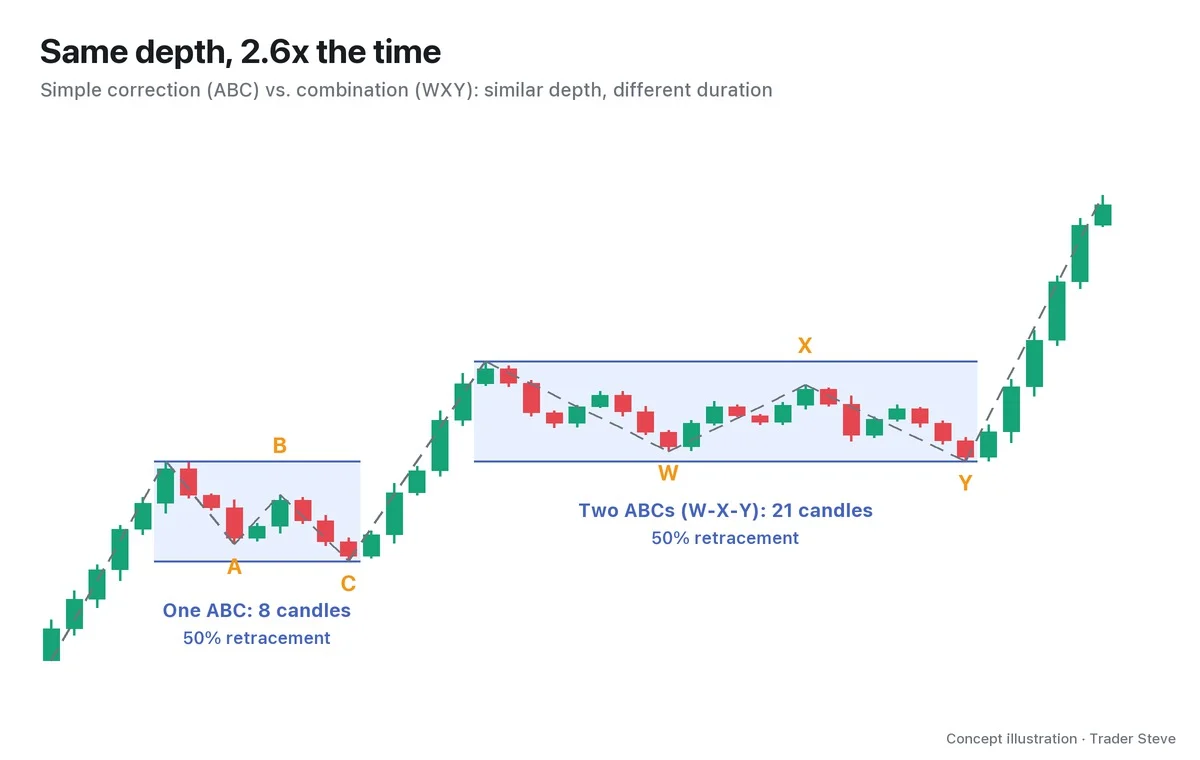
Combinations are usually explained in two ways.
- The price target is met early, but not enough time has passed: the first ABC retraced deeply enough, but the market hasn't rested long enough to resume the prior trend. Instead of going deeper, it buys time with "one more ABC."
- Buyers and sellers are deadlocked, and the momentum to push the trend again hasn't built up yet: when neither the side trying to lift price nor the side pressing it down has a decisive blow, price swings up and down inside the same range and drifts sideways.
The next quote describes a general scenario in which price can fall again after a bounce. It is not a definition of a same-direction W and Y with an X between them.
"Say (the decline) came out impulsively and that trend has fully played out. Then an ABC comes, and after that it drops again in another ABC — that's the structure I'm looking at." — Trader Steve, live stream, Aug 26, 2026 (translated from Korean) · ▶ Watch the stream highlights (Korean audio)
Here the first ABC is a bounce and the second ABC is a decline, so they point in opposite directions. Don't take it as grounds for the definition of a combination; read it only in the sense that one bounce is not enough to conclude the trend has resumed. What to remember about combinations themselves is this: if you're convinced the trend has resumed the moment the first ABC ends, you're easily shaken out by the X that follows.
3. Double Three and Triple Three
Combinations are split into two kinds by the number of corrections joined together. W-X-Y is a double three; W-X-Y-X-Z is a triple three. There are at most three corrections, and nothing comes after Z.
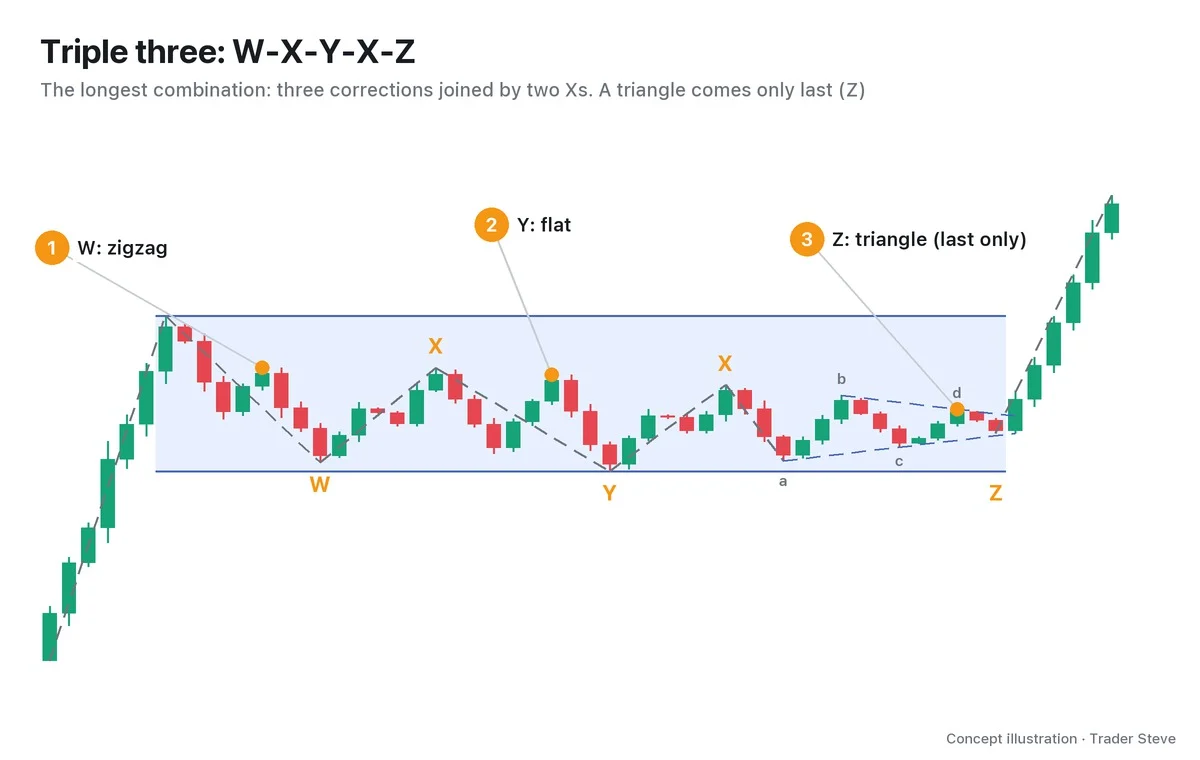
There are also a few principles for the building blocks.
- A triangle used as a component correction comes only in the last component (Y or Z). That's because a triangle usually acts as the final pause just before a big move.
- A zigzag usually appears only once. A pattern made only of zigzags is classified separately as a "double or triple zigzag" (see the Elliott Wave Zigzags lessons).
- What separates a double zigzag from a combination is the overall slope. A double zigzag drops steeply and deeply in one direction; a combination drags time out sideways.
Part 2 covers the specific labeling rules and a checklist in detail.
4. Where It Shows Up Most: Waves 4 and B, and Bear-Market Bounces
Combinations appear mainly in wave 4 and wave B positions. Wave 2 often ends quickly as a sharp zigzag, and in contrast wave 4 tends to rest sideways for a long time. This relationship ties into the guideline of alternation (see the Elliott Wave Alternation lessons).
Bounces in a bear market often take this shape too. After a big drop, the bounce rises once in an ABC, slips a little, then rises again in another ABC. Many people feel this is where "it bottomed and turned around," but structurally it may be a correction that spends time going sideways.
"Where Elliott really shines is when you sketch out a forecast scenario for the big-picture move. I think Elliott Wave is one of the few theories — almost the only one — that at least tries to predict the future." — Trader Steve, live stream, Aug 20, 2026 (translated from Korean) · ▶ Watch the stream highlights (Korean audio)
That is also why you learn combinations. The goal isn't to guess the correct label; it is to prepare one more scenario in advance: "it may end with the first ABC, but another ABC may be attached."
5. On a Real Chart: W-X-Y on the ETH Daily Chart
Let's put W-X-Y labels on a real Ethereum (ETH) daily chart. What follows is one possible count.
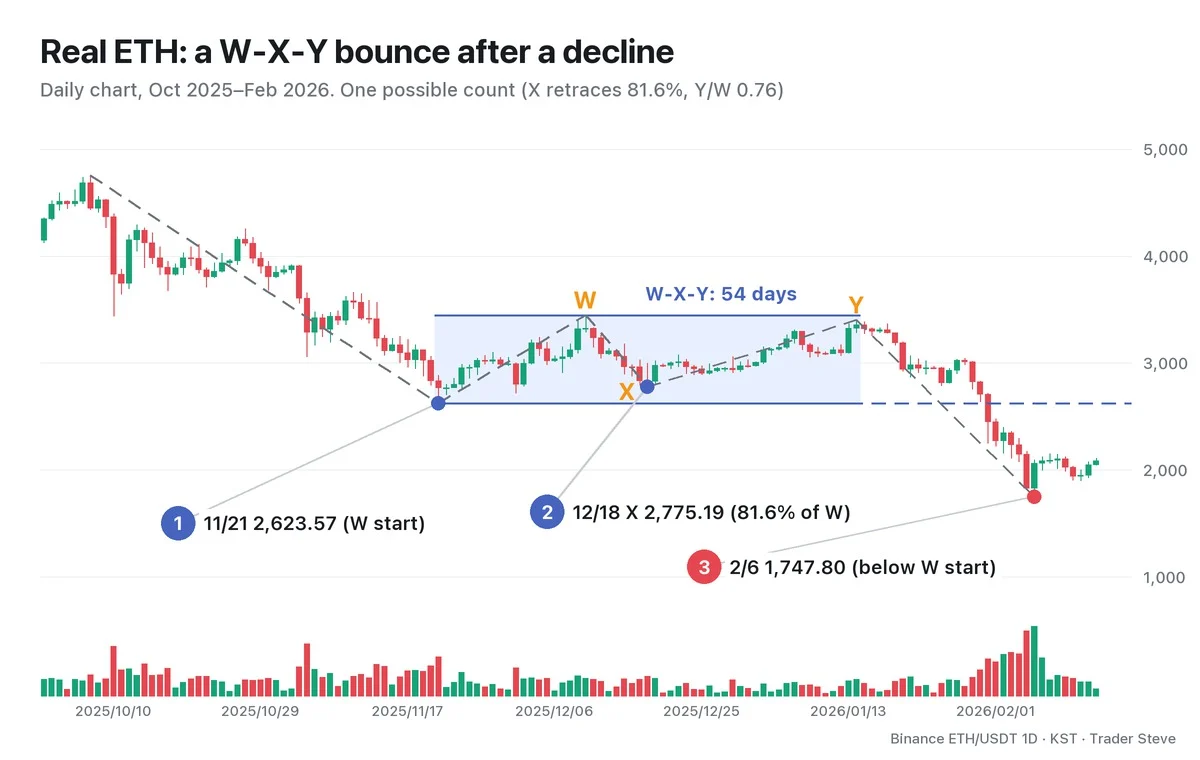
- Prior decline: from the Oct 7, 2025 high of 4,755.00 to the Nov 21 low of 2,623.57, price fell 44.8% in 45 days. This low is where W starts.
- W: bounced to 3,447.44 on Dec 10, retracing 38.7% of the prior decline.
- X: slid to 2,775.19 on Dec 18, retracing as much as 81.6% of W. It was deep enough for people to say "the bounce is over," but it did not go below W's starting point.
- Y: rose again to 3,402.89 on Jan 14, 2026. Y was 0.76x as long as W and did not get past W's high.
From the start of W to the end of Y took 54 days. It used more time than the prior decline (45 days), yet price never left the 2,600–3,400 range. Afterward, the Jan 31 close fell below W's starting point (2,623.57), and on Feb 6 price dropped to 1,747.80 — another 33.4% below W's start.
Keep in mind that these labels were placed after everything had played out. While it was unfolding, there was no way to know where Y would end, or whether another X would attach and extend it into a W-X-Y-X-Z. Most combinations are confirmed only after they end. That's why in practice you use it as a scenario candidate: "if the trend doesn't resume after the ABC, this could be an X."
Key Takeaways
- A combination is a long, sideways correction that joins two or three simple corrections (zigzag, flat, triangle) with a connecting wave, X.
- A double three is W-X-Y and a triple three is W-X-Y-X-Z. There are at most three corrections, and a triangle used as a component comes only last.
- When the retracement depth has been met but the time hasn't, the market buys time with "one more ABC."
- It shows up often in waves 4 and B and in bear-market bounces.
- You can't confirm it while it is unfolding. The key is not to assume that the end of the first ABC = the end of the correction.
In Part 2, we'll cover the rules for drawing W-X-Y and W-X-Y-X-Z, an X-wave checklist, and how to tell a combination from a double zigzag.
Counting this structure by hand for every asset takes real time. The Omnisight Report, which lays out Elliott Wave scenarios alongside other theories for each asset, is worth a look.
This lesson adapts the text, figures and live-stream quotes of the Trader Steve TA series for the web, translated from the original Korean. Check the text and figure captions for the timing and interpretation of each real example, and read conceptual diagrams and real charts separately.
Corrections: support@omnisight.report