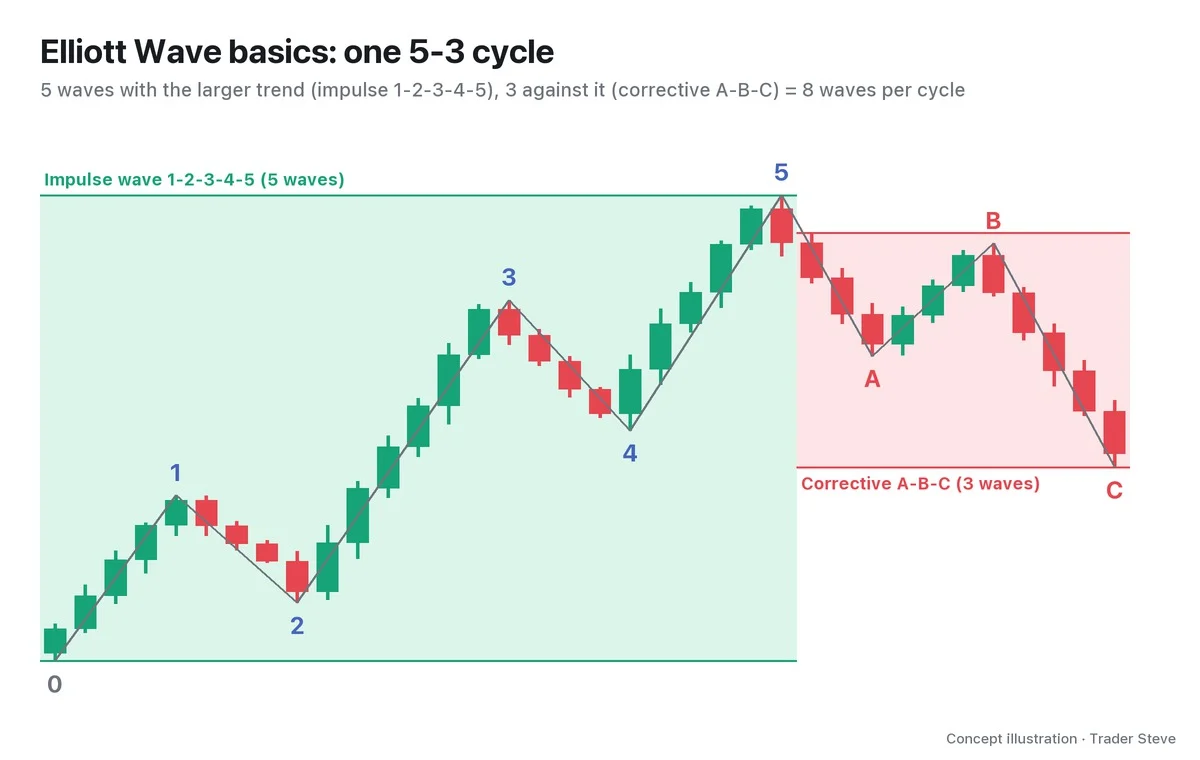
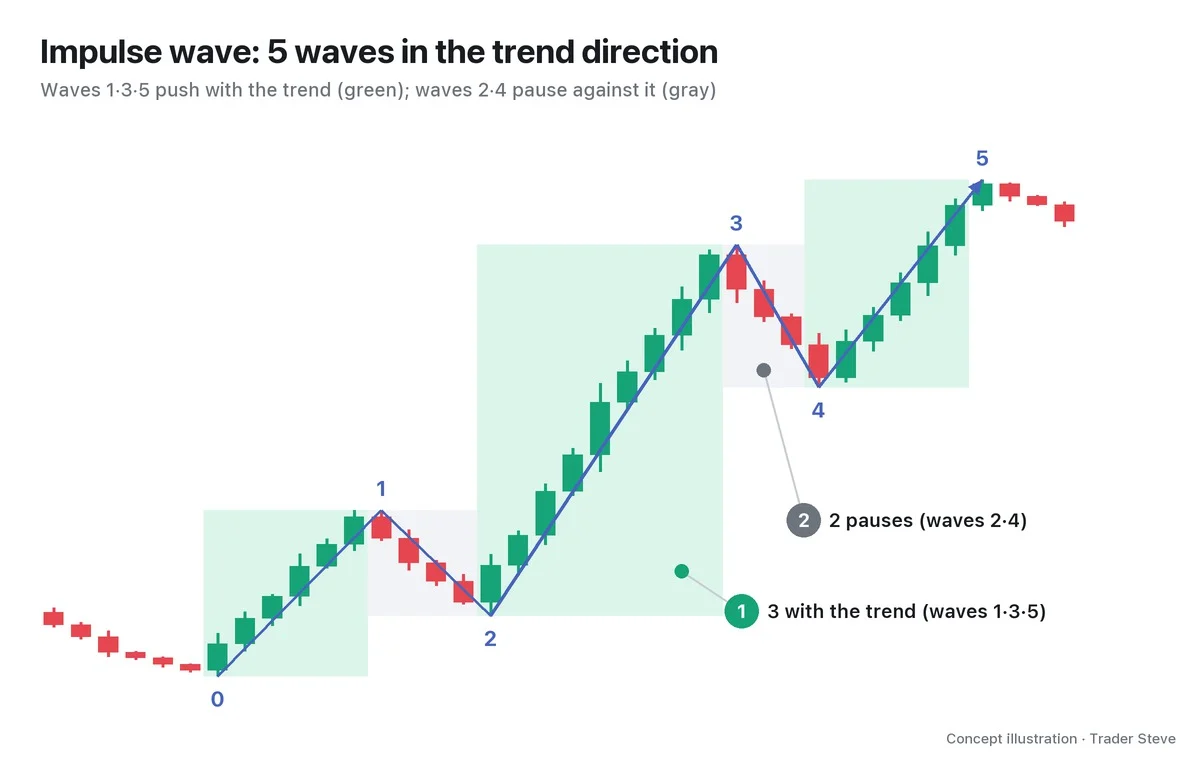
What Is a Diagonal? The Wedge-Shaped 5-Wave Pattern and Why It Forms
Historical examples for learning · not current prices or trade recommendations.
Contents
Have you ever watched a rally where each push higher gains a little less than the one before, and each pullback digs back into the price range of the previous wave? In Elliott Wave theory, that shape is called a diagonal (also known as a diagonal triangle). This lesson uses diagrams and a real Bitcoin chart to explain what a diagonal is, how ending and leading diagonals differ, and why the shape forms.
All dates and times are Korea Standard Time (KST, UTC+9). A daily candle is dated by its 09:00 KST open, and the time shown for an intraday candle is the time that candle opens. The actual intraday time of a high or low is stated separately.
1. The One-Line Definition: Five Waves That Overlap Between Two Lines
A diagonal is a five-wave move that advances between two trendlines while its waves overlap one another. Korean-language books also call it a "diagonal triangle."
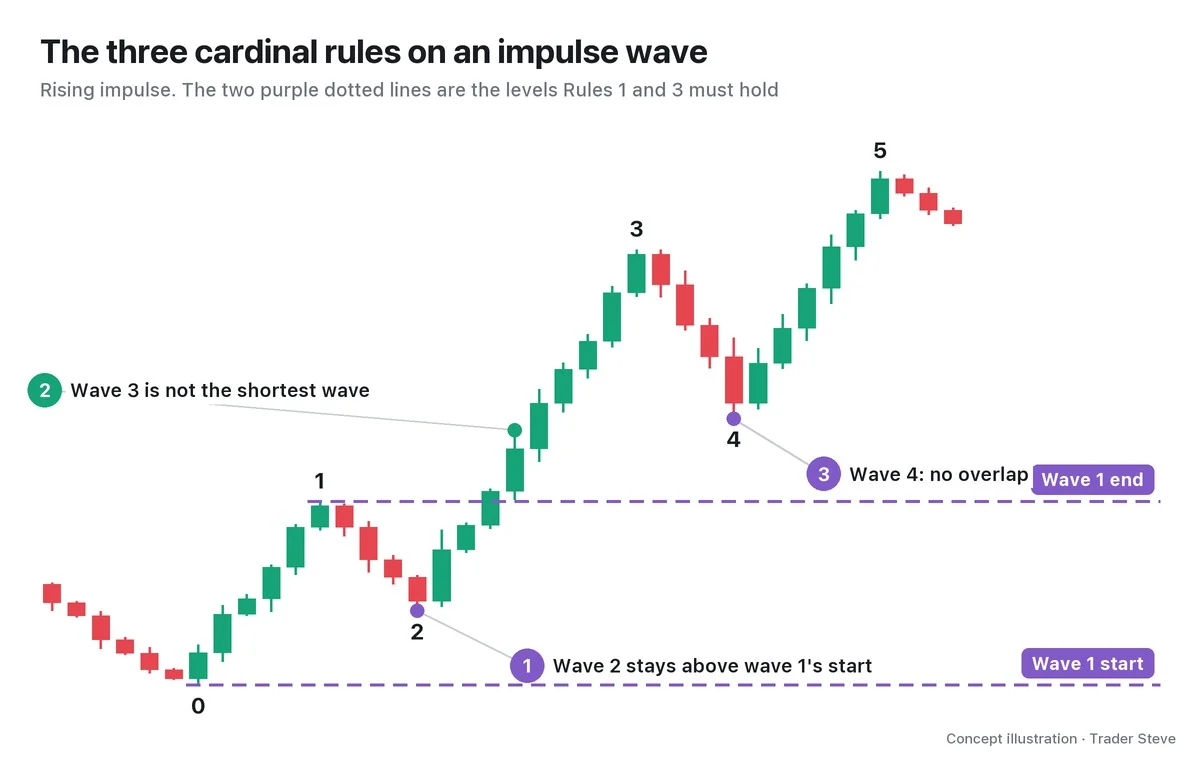
The key word is overlap. An impulse wave has a cardinal rule that "wave 4 does not enter the price territory of wave 1," and the diagonal is the only five-wave pattern in which that rule is relaxed. The other two cardinal rules (wave 2 never moves beyond the start of wave 1, and wave 3 is never the shortest) still hold.
The line connecting the ends of waves 1 and 3 is the 1-3 line, and the line connecting the ends of waves 2 and 4 is the 2-4 line. Most diagonals are contracting, with the two lines converging; occasionally you'll see an expanding one, where the lines spread apart (Part 2 shows how to tell them apart).
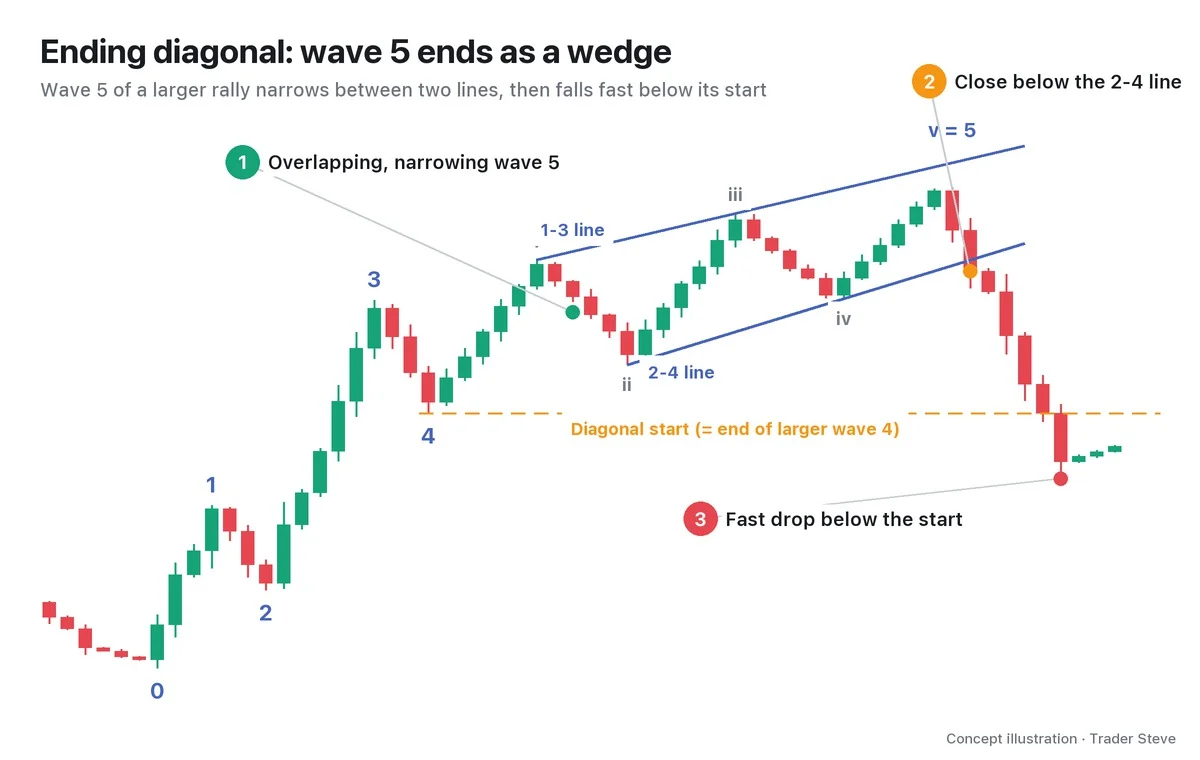
This is the most common form: a rising contracting ending diagonal. After the larger waves 0–4, wave 5 narrows between the two lines, and once the 2-4 line breaks, price quickly retraces below the start (the end of the larger wave 4).
2. Two Types: Ending Diagonals and Leading Diagonals
A diagonal is named by where it appears.
| Type | Where it appears | Meaning | Subwaves | Afterward |
|---|---|---|---|---|
| Ending diagonal (ED) | Wave 5 of an impulse, wave C of an ABC correction | The end of a trend | 3-3-3-3-3 | A fast, sharp retracement toward the start |
| Leading diagonal (LD) | Wave 1 of an impulse, wave A of a zigzag | The start of a trend | 5-3-5-3-5 | A deep wave 2, then a long wave 3 |
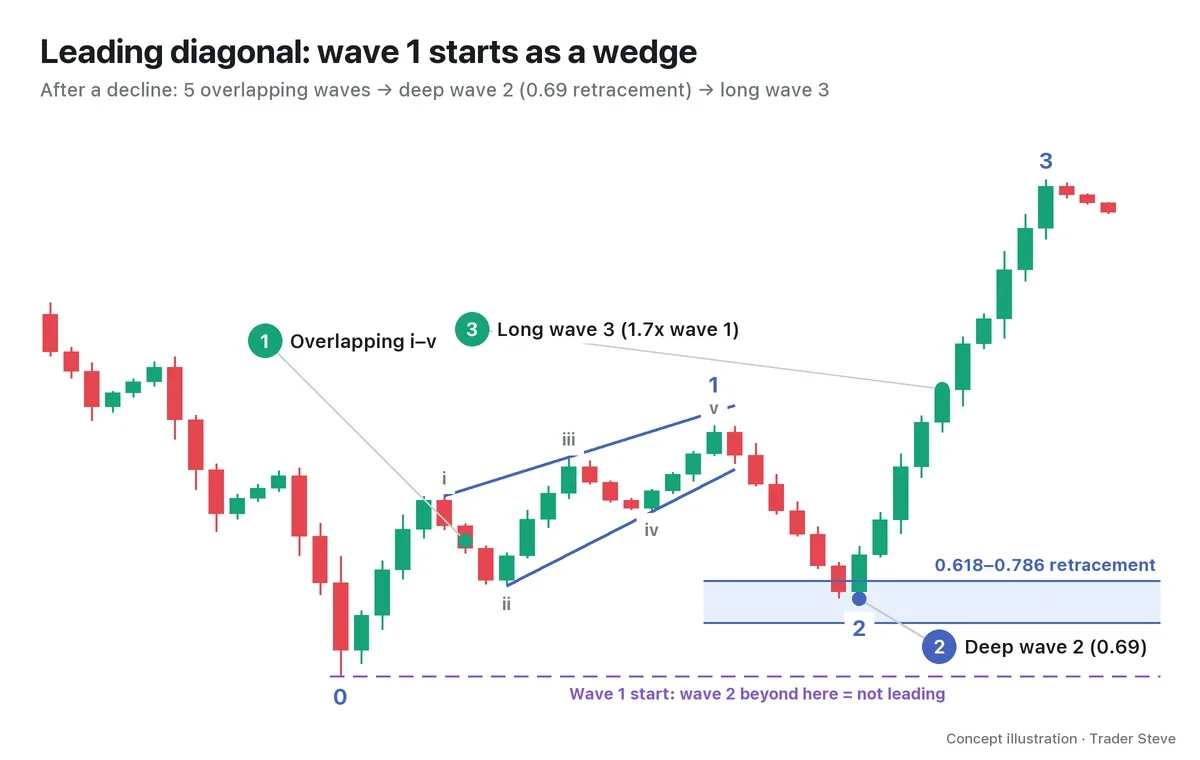
A leading diagonal is the opposite: the first leg of a new trend. From a bottom, wave 1 climbs in a wedge shape, and then wave 2 often comes down deep before wave 3 extends a long way. Some analysts also accept leading diagonals whose subwaves count 3-3-3-3-3.
3. Why It Forms: A Trend Running Out of Steam
An ending diagonal appears when the preceding move has gone too far, too fast, and is running out of strength. Price still makes higher highs and higher lows, but by smaller and smaller amounts.
In chart-pattern terms, the same shape is called a wedge. On the live stream, I call it a "wedge" too, and once explained it this way while looking at a Nasdaq index chart:
"It goes up, then corrects; goes up, then corrects; goes up, then corrects… Look, the size of each rise and correction — the amplitude — keeps shrinking. Technically, you'd say it's drawing a wedge, but honestly that's just giving it a name. What's the essence? The amount by which the highs and lows are rising keeps getting smaller. It's not managing to push up much." — Trader Steve, live stream, Oct 19, 2026 (translated from Korean) · ▶ Watch this moment (Short, Korean audio)
What matters more than the name is why it rises less. In the same stream, I explained the reason in terms of money.
"It's raising both the highs and the lows, but it's getting to a point where it can't raise them by much. Why? … Because there isn't enough money. … If you put in more money and sweep the offers higher, price goes up. If there isn't enough money to sweep them cleanly, it only goes up a little. And when there's no more money to push it higher, the selling starts. Then it goes down." — Trader Steve, live stream, Oct 19, 2026 (translated from Korean) · ▶ Watch this moment (Short, Korean audio)
When it takes more and more money to push price one more step higher and new money doesn't keep up, the advances shrink and the pullbacks dig into the previous wave.
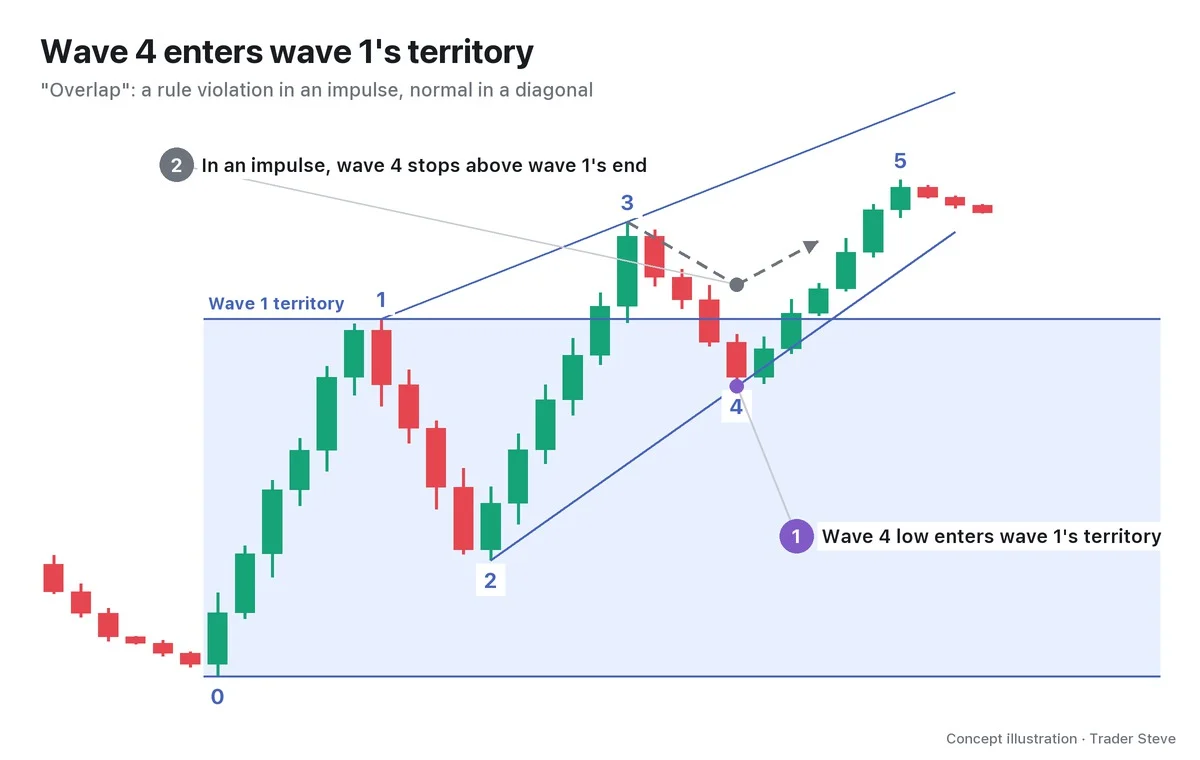
In an impulse wave with strength to spare, wave 4 stops above the end of wave 1. This overlap is the easiest way to tell an impulse wave from a diagonal. In effect, a diagonal is the shape left behind by a trend that is losing strength.
4. What Comes After: A Fast Retracement, or a Deep Wave 2
When an ending diagonal ends, price usually retraces quickly and sharply. By the textbook, it often returns to the price where the diagonal began, in less time than the diagonal took to form. The reasoning is that the price range was built with so much effort that there is little size underneath to support it.
When a 3x leveraged semiconductor exchange-traded fund (SOXL) was climbing in a wedge, I said this:
"It's been grinding up steadily over the past week or so, and when it gets dragged up in a wedge like this, a correction is bound to come. The only difference is whether it dips briefly around here or dips a bit deeper — either way, the correction is definitely coming." — Trader Steve, live stream, Aug 20, 2026 (translated from Korean) · ▶ Watch the stream highlights (Korean audio)
How deep, though, is not fixed. Price may go all the way back to the start, or it may fall short.
After a leading diagonal, wave 2 often retraces deeply, around 0.618–0.786, making you wonder "is it already over?" before wave 3 extends a long way. If wave 2 moves beyond the start of the diagonal, drop the leading-diagonal reading.
5. A Real Bitcoin 4-Hour Chart
In April 2026, the Bitcoin 4-hour chart had a stretch that can be counted as a rising contracting diagonal (this is one possible count).
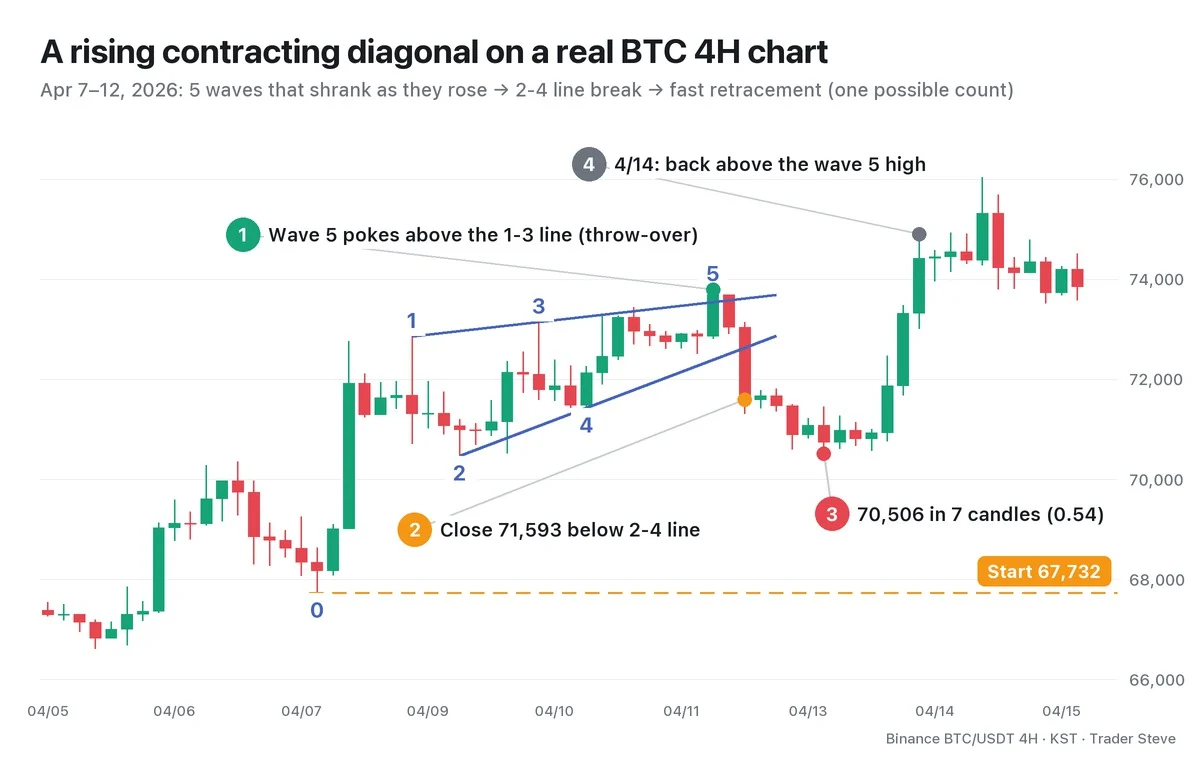
From the 67,732 low of the 21:00 candle on Apr 7 to the 73,790 high of the 01:00 candle on Apr 12, the five waves measured 5,125 → 2,391 → 2,679 → 1,718.9 → 2,363.9. Wave 3 shrank to 0.523x wave 1, wave 5 to 0.882x wave 3, and wave 4 to 0.719x wave 2, so the two lines converged. Wave 4's low of 71,426.1 dropped below wave 1's end at 72,857, creating the overlap.
Wave 5 poked slightly above the 1-3 line (73,541) and came back inside (①), and 2 candles later the 09:00 candle on Apr 12 closed at 71,593.2, below the 2-4 line (72,626.3) (②). Price then fell to 70,505.9 within 7 candles, retracing 0.542 of the diagonal's length (③). That's fast compared with the 25 candles it took to form.
But price never reached the 67,732 start, and on the 05:00 candle of Apr 14 it climbed back above the wave 5 high of 73,790 (④). If price keeps rising past the end of wave 5, you drop the count that says "the larger trend ends here." What this diagonal ended was only one small leg of the rally.
That's why you don't confirm a diagonal on shape alone. Five overlapping, narrowing waves are only a candidate: a close through the 2-4 line confirms completion, and a move back beyond the end of wave 5 is the invalidation level (entry and stop planning is in Part 3).
Key Takeaways
- A diagonal is a five-wave move that advances between two trendlines while its waves overlap, and it is the only five-wave pattern in which wave 4 is allowed to enter wave 1's territory.
- An ending diagonal (ED) signals the end of a trend from the wave 5 or wave C position; a leading diagonal (LD) signals the start of a trend from the wave 1 or wave A position.
- Its shape, with gains that keep shrinking, is what a trend losing strength leaves behind, and it is the same shape as the chart-pattern wedge.
- A fast retracement is common after an ending diagonal, and a deep wave 2 followed by a long wave 3 after a leading diagonal, but the depth is not fixed.
- The shape is only a candidate. Confirm it with a close through the 2-4 line, and drop the count if price moves back beyond the end of wave 5.
In Part 2, we'll cover how to tell contracting and expanding diagonals apart using ratios, the order for drawing the 1-3 and 2-4 lines, and the throw-over.
Related reading: the three cardinal rules in Elliott Wave Rules and Guidelines (related lesson), the five-wave pattern that doesn't overlap in Elliott Wave Impulse Waves (related lesson), and the basics of drawing two lines in Basics Trendlines and Channels (related lesson).
If counting waves, drawing lines and checking ratios by hand for market after market feels like a chore, the Omnisight Report below does that work for each market.
This lesson adapts the text, figures and live-stream quotes of the Trader Steve TA series for the web, translated from the original Korean. Check the text and figure captions for the timing and interpretation of each real example, and read conceptual diagrams and real charts separately.
Corrections: support@omnisight.report