What Is an Extended Wave? What It Means and Why Wave 3 Runs So Long
Historical examples for learning · not current prices or trade recommendations.
Contents
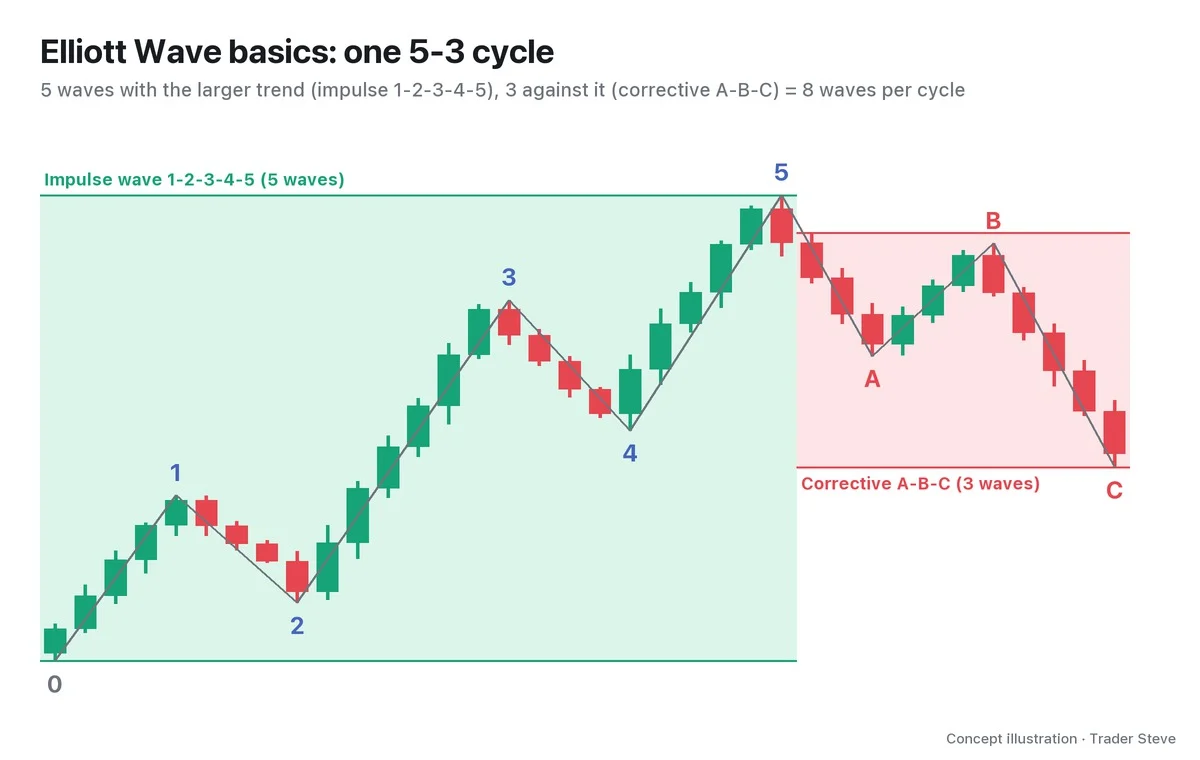
When you count Elliott Wave impulses, you will often find that one of the five waves runs visibly farther than the other two that move with the trend. In Elliott Wave this is called an extended wave, or extension. This lesson uses diagrams and a real Bitcoin (BTC) chart to explain what an extended wave is, where it shows up, and why people say wave 3 in particular tends to run long.
All dates and times are Korea Standard Time (KST, UTC+9). A daily candle is dated by its 09:00 KST open, and the time shown for an intraday candle is the time that candle opens. The actual intraday time of a high or low is stated separately.
1. The One-Line Definition: One Motive Wave Stretches Unusually Far
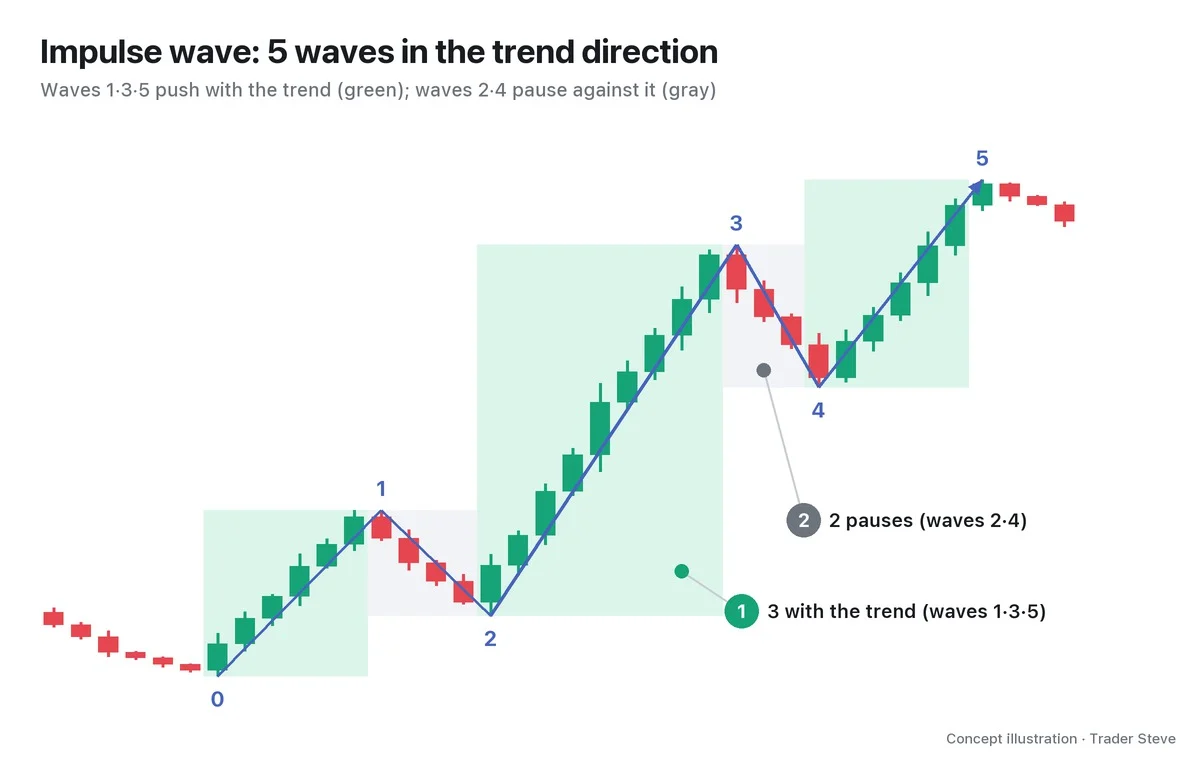
An impulse wave is made of waves 1, 3 and 5, which move in the trend direction, and waves 2 and 4, which pause. Waves 1, 3 and 5 each unfold as a motive structure. Motive wave is the broader category that covers both impulse waves and diagonals; this lesson deals with extensions of waves 1, 3 and 5 inside an impulse wave.
An extended wave is one motive wave that stretches unusually far, with the five smaller waves inside it showing as clearly as larger waves would.
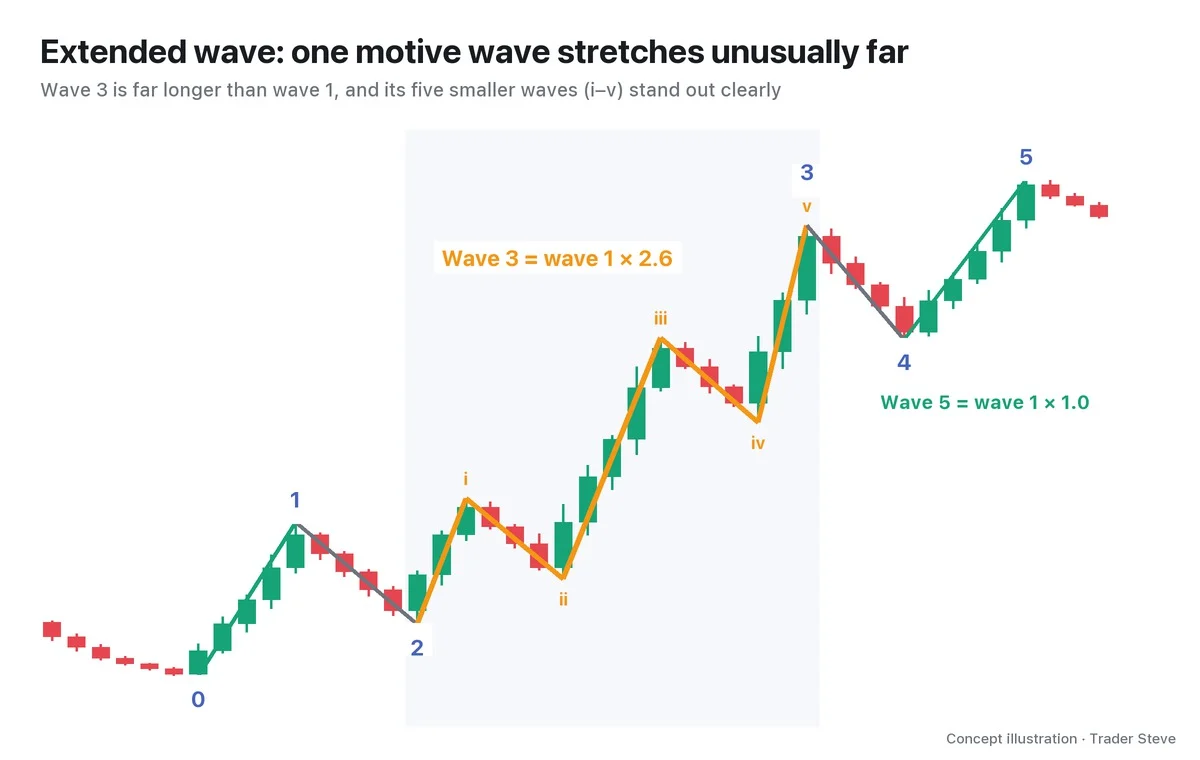
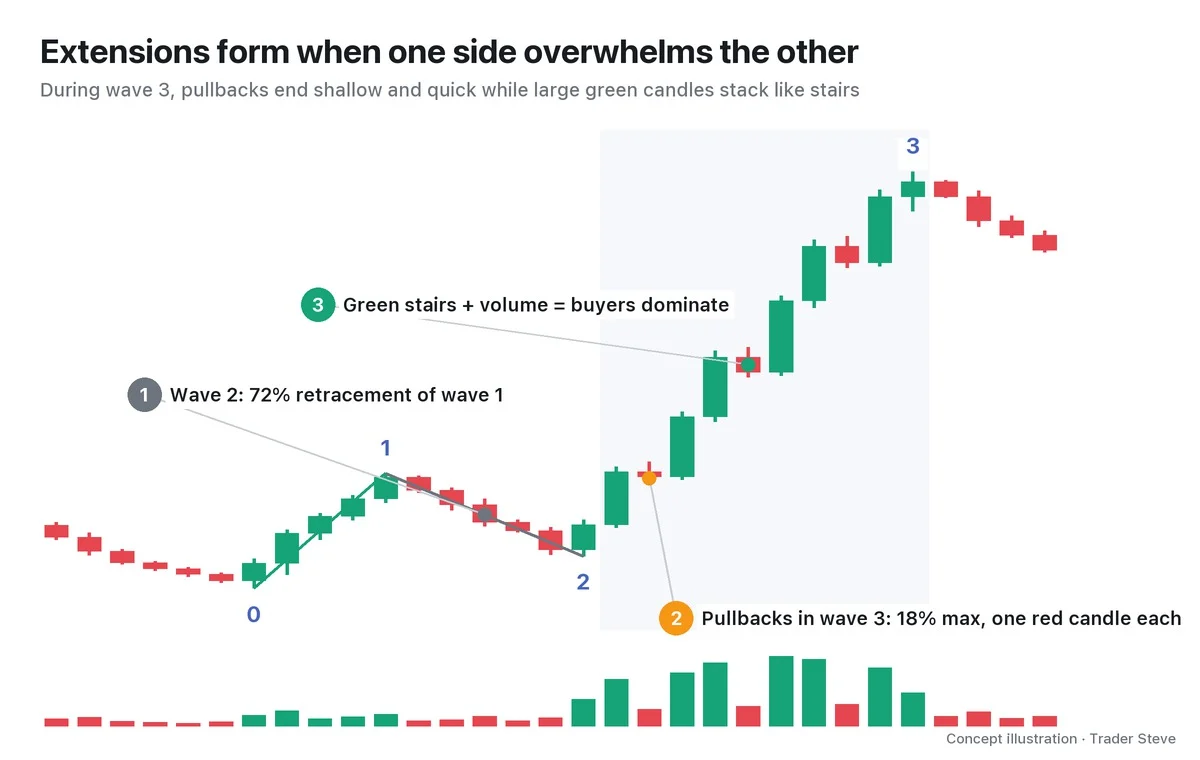
In the diagram, 0 to 1 is wave 1 and 2 to 3 is wave 3. Look closely at the wave 3 section (the shaded background) and you will see a small impulse inside it: up (i), pause (ii), a big push up (iii), pause (iv), and a final push up (v). Waves one degree lower like these are called subwaves, and to keep them apart from the larger degree they are written in lowercase Roman numerals: i, ii, iii, iv, v.
That is why, when an extension forms, the whole move can look like nine swings instead of five. How to read this "nine-wave count" is covered in Part 2.
2. Where It Forms: Wave 1, Wave 3 and Wave 5 Extensions
An extension can form in any of the three motive waves, but not equally often.
| Type | How common | Characteristics |
|---|---|---|
| Wave 1 extension | Rare | The first wave of the trend is the longest. Waves 3 and 5 that follow are relatively short and similar |
| Wave 3 extension | Known as the most common | The body of the trend stretches out. Waves 1 and 5 tend to come out similar in length |
| Wave 5 extension | Often cited in markets that overheat easily, such as crypto and commodities | The last wave stretches out. It tends to coincide with late-stage overheating |
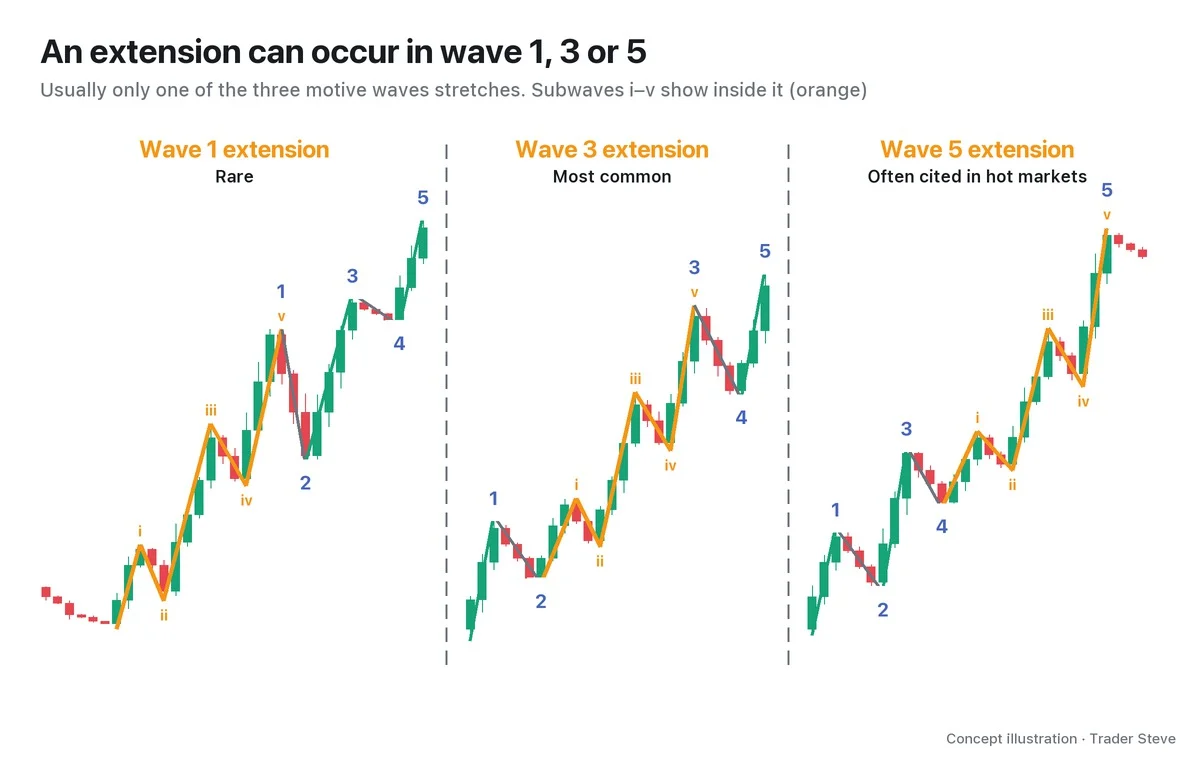
The three diagrams share one thing: only one wave stretches. Elliott Wave has a guideline that usually only one of waves 1, 3 and 5 extends ("only one wave extends"). So if wave 3 has stretched out, the other two, waves 1 and 5, tend to come out similar in length (wave equality). Using this relationship to judge where the extension is continues in Parts 2 and 3.
3. Why It Forms: When One Side Overwhelms the Other
A motive wave that stretches far is usually a stretch where one side overwhelms the other. Normally, once price rises a little, profit-taking comes in, and price pauses to form retracements like waves 2 and 4. But when buyers vastly outnumber sellers, pullbacks end shallow and quick, and price climbs like a staircase without resting.
On a live stream, talking about how US stocks rose without a break after COVID, I put it this way:
"It's really a pure impulse, exactly by the book. It never once encroached on the previous high, it just kept going up, endlessly, endlessly." — Trader Steve, live stream, Aug 25, 2026 (translated from Korean) · ▶ Watch the stream highlights (Korean audio)
There are reasons pressure piles up on one side like this. Sometimes large amounts of capital flow in at once; in highly leveraged markets like crypto futures, forced liquidations can also cascade. For example, as price rises, short (sell) positions get stopped out or liquidated, and those positions are closed with market buy orders. That buying pushes price higher still and hits the next liquidation price, and so on. This chain is a short squeeze. When chained orders like these kick in, a motive wave can stretch far beyond the textbook ratios. Part 4 checks the numbers on a Bitcoin case where exactly that happened.
In short, an extension leaves behind shallow, short pullbacks, back-to-back large candles and rising volume. These are only signs that an extension may be underway, though, not a signal of how far it will go.
4. What "Wave 3 Is the Longest" Really Means
When you first learn Elliott Wave, you often hear that "wave 3 is the longest." Wave 3 extensions are known to be the most common, so it isn't wrong, but strictly speaking it is a tendency.
"By Elliott's standard you get 1, 2, 3, 4, 5, and 1 through 3 are the confirmed part, while 4 and 5 are kind of a bonus stage, right? This wave 3, the body that's supposed to be the longest, that's wave-theory talk, and it's not necessarily so." — Trader Steve, live stream, Oct 23, 2026 (translated from Korean) · ▶ Watch the stream highlights (Korean audio)
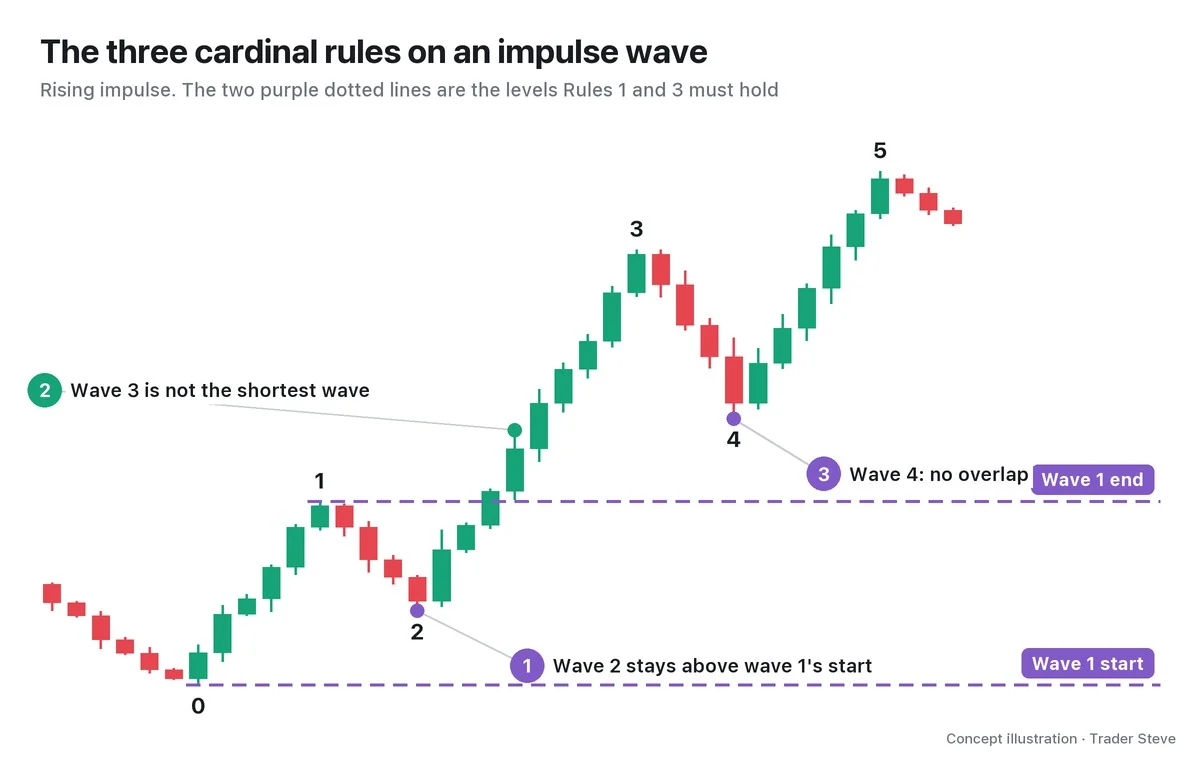
Among Elliott's cardinal rules, the only one on this point is that wave 3 cannot be the shortest. "Wave 3 is the longest" is a guideline layered on top of it. So an impulse wave where wave 1 or wave 5 is the longest is a perfectly valid count. Miss this difference and you may throw out a sound count just because wave 3 is short, or wait for a "long wave 3" that never comes. The full set of rules is in Elliott Wave Rules and Guidelines (related lesson).
5. Real BTC 12-Hour Chart: A Borderline Case Just Short of the Wave 3 Extension Threshold
Let's see what a wave 3 extension looks like on a real chart. This is a decline on the Bitcoin 12-hour chart in May 2026.
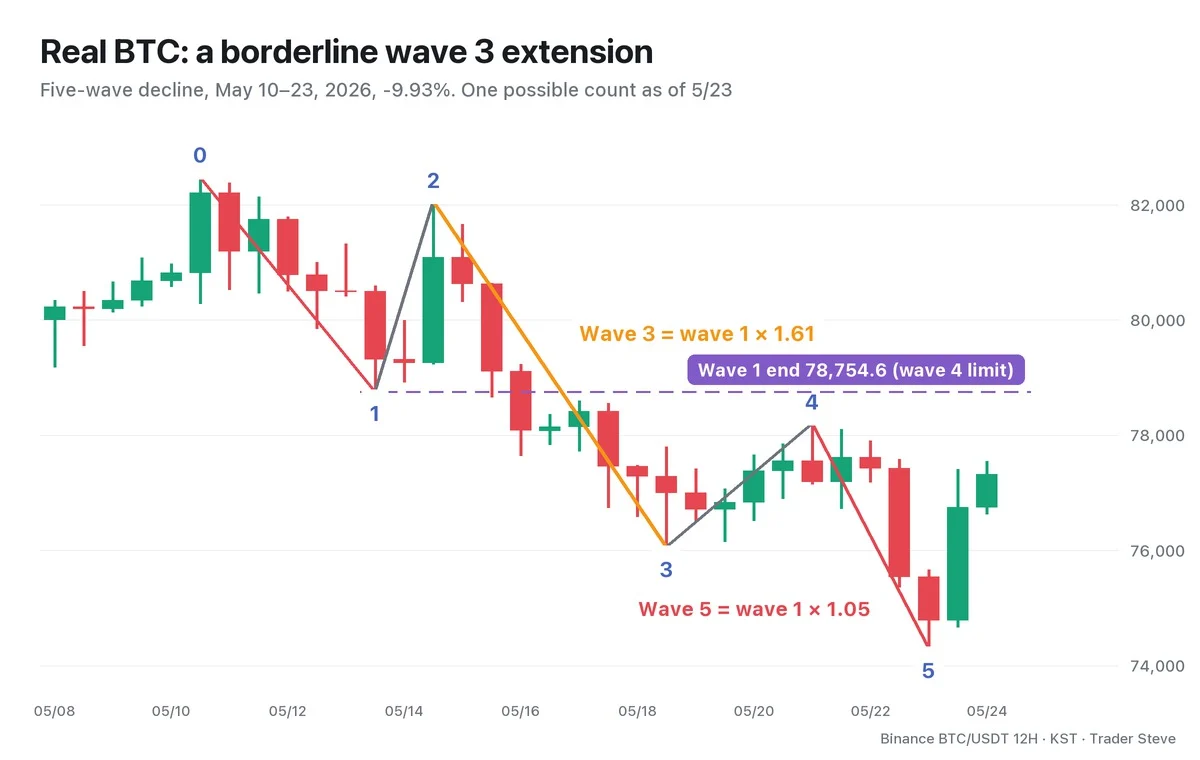
Taking the May 10, 21:00 KST high of $82,479.3 as 0, the count goes like this:
- Wave 1: down to $78,754.6, a length of $3,724.7
- Wave 3: from the wave 2 high of $82,048.1 down to $76,051.0, a length of $5,997.1 → 1.61x wave 1
- Wave 5: from the wave 4 high of $78,200.0 down to $74,289.6, a length of $3,910.4 → 1.05x wave 1
Of the three motive waves, wave 3 is the longest, and waves 1 and 5 came out almost the same length. It is exactly the tendency described earlier: "when wave 3 extends, waves 1 and 5 become similar." The end of wave 3 was only $29.4 away from the price you get by subtracting 1.618x wave 1's length from the wave 2 high ($76,021.6). Strictly speaking, it is a borderline case that fell just short of 1.618 times; the criteria for judging an extension and the typical ratios are laid out in Part 2.
The purple dotted line marks the end of wave 1 ($78,754.6). In a falling impulse wave, the wave 4 bounce must not rise above this line. The actual wave 4 high was $78,200.0, stopping $554.6 below it, and the count passed all three cardinal rules. The total decline was 9.93%.
Keep in mind, though, that this is one count based only on data through May 23. Part 4 widens the chart to show how this count was later redone. An extension is confirmed only after it ends.
Key Takeaways
- An extended wave is one motive wave (wave 1, 3 or 5) that stretches unusually far, with subwaves i–v inside it clearly visible.
- It can form in wave 1, 3 or 5, but usually only one stretches, and wave 3 extensions are known to be the most common.
- It stretches when one side overwhelms the other and pullbacks are shallow and short. Chained orders such as forced liquidations and short squeezes can stretch it further.
- "Wave 3 is the longest" is a tendency; the only rule is that "wave 3 cannot be the shortest."
- In the real BTC 12-hour decline in May, wave 3 = wave 1 × 1.61 and wave 5 = wave 1 × 1.05: a borderline case that fell just short of the 1.618x working threshold for a wave 3 extension.
In Part 2, we'll cover the criteria for finding an extended wave on a chart, the nine-wave count, and the structure where an extension forms inside another extension. If the basic structure of an impulse wave is new to you, start with Elliott Wave Impulse Waves (related lesson) and this lesson will read more easily. And if measuring wave lengths and ratios by hand for every market gets tedious, the Omnisight Report below lays out the Elliott Wave count for you.
This lesson adapts the text, figures and live-stream quotes of the Trader Steve TA series for the web, translated from the original Korean. Check the text and figure captions for the timing and interpretation of each real example, and read conceptual diagrams and real charts separately.
Corrections: support@omnisight.report