Elliott Wave Fibonacci Ratios: What They Mean and How They Work
Historical examples for learning · not current prices or trade recommendations.
Contents
As you work through an Elliott Wave count, one question always follows: "Where is this wave likely to end?" The tool traders reach for most often here is the Fibonacci ratio. This lesson uses diagrams to explain what it means — and why it works — to use the length of a wave that has already finished to measure, in advance, the "candidate zones" where the next wave could end.
All dates and times are Korea Standard Time (KST, UTC+9). A daily candle is dated by its 09:00 KST open, and the time shown for an intraday candle is the time that candle opens. The actual intraday time of a high or low is stated separately.
1. The One-Line Definition: Waves Tend to Line Up in Similar Ratios
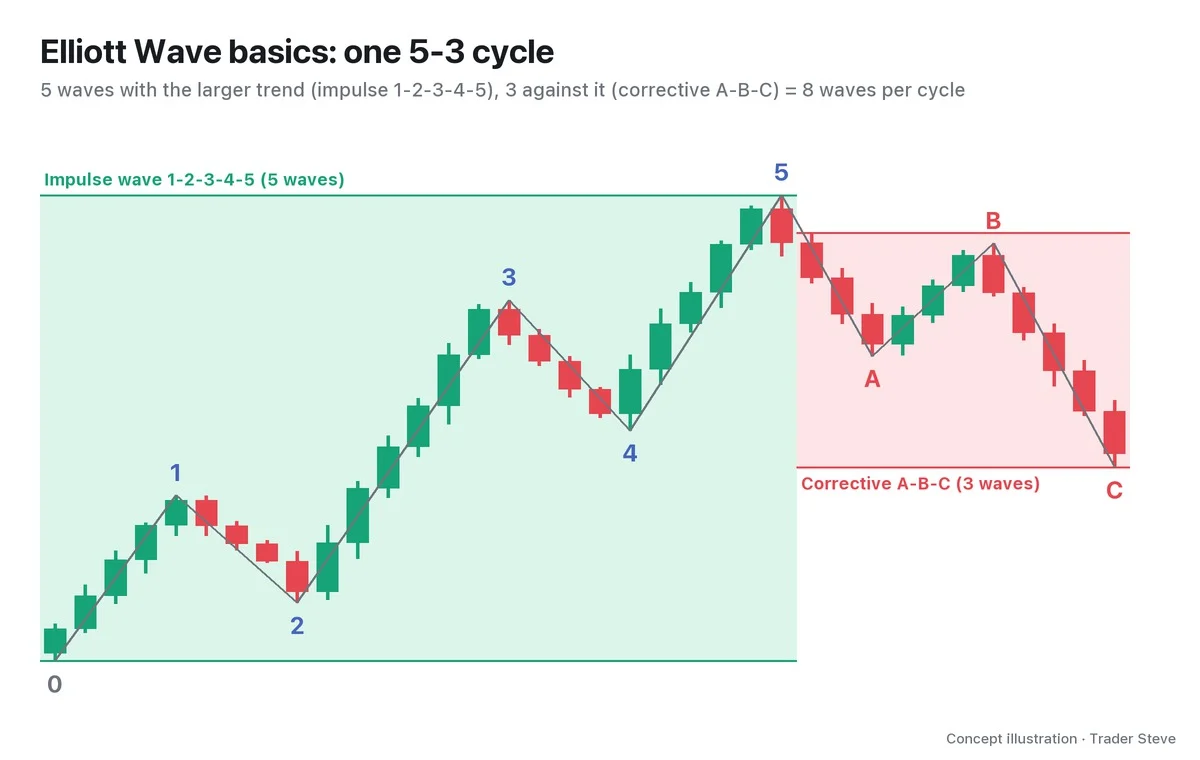
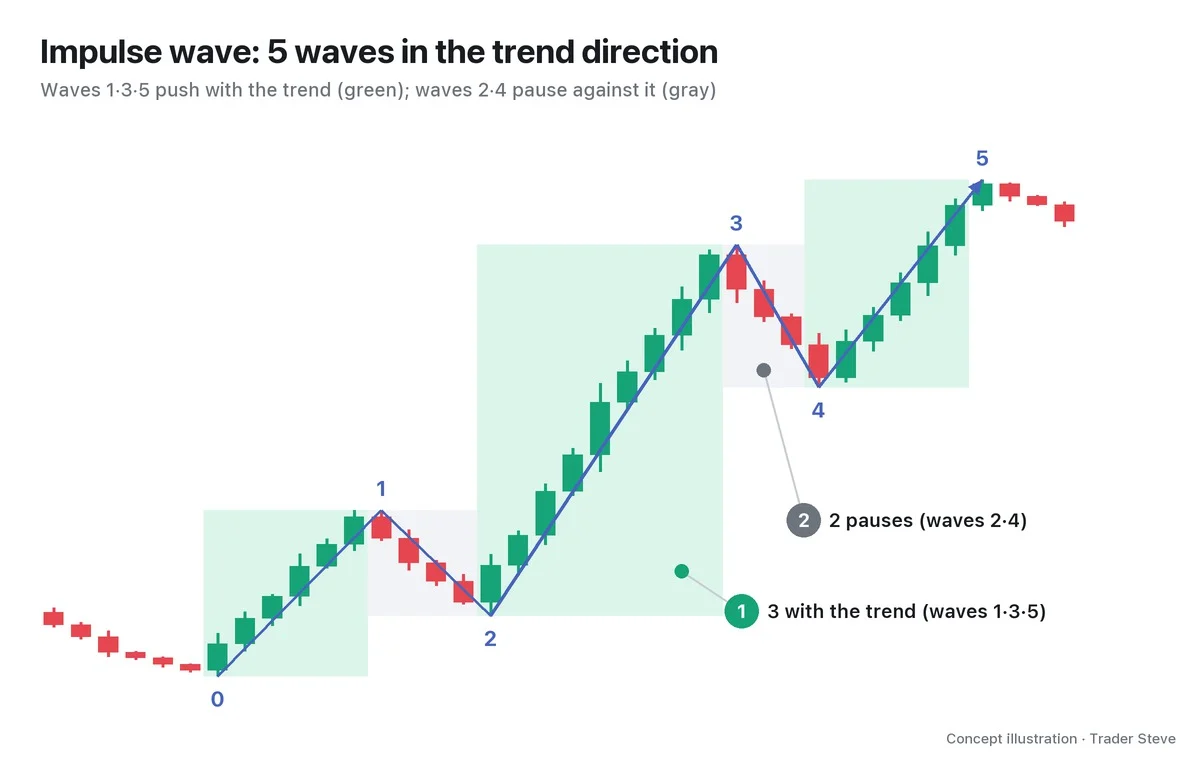
In Elliott Wave theory, a rising impulse wave is five waves — waves 1, 3 and 5 go up while waves 2 and 4 pause — and a corrective wave is made of three waves, A, B and C (the 5-3 structure is covered in elliott/basics). When you compare the lengths and depths of these waves with each other, they often line up near Fibonacci ratios such as 0.382, 0.618, 1 and 1.618. These are the Fibonacci ratios of Elliott Wave.
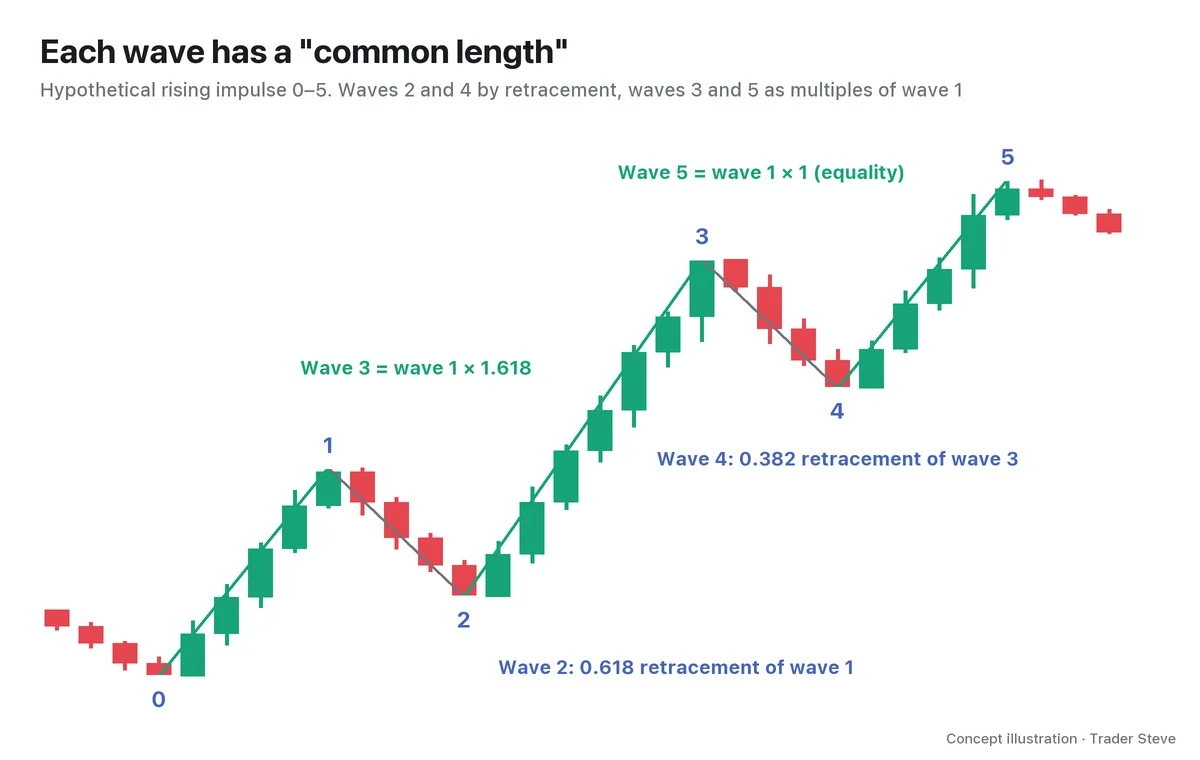
The key words are "often line up." This is not a law that says a wave must end at these ratios. It is a tendency: waves have often ended near them. The math behind the ratios — 0.618 being the reciprocal of 1.618, for example — is covered in Basics Fibonacci (related lesson).
2. Two Ways to Measure: Retracement and Projection
There are two ways to measure a wave ratio.
- Fibonacci retracement: measures how much of the previous wave has been given back, inside that wave. Wave 2 (retracing wave 1), wave 4 (retracing wave 3) and wave B (retracing wave A) belong here.
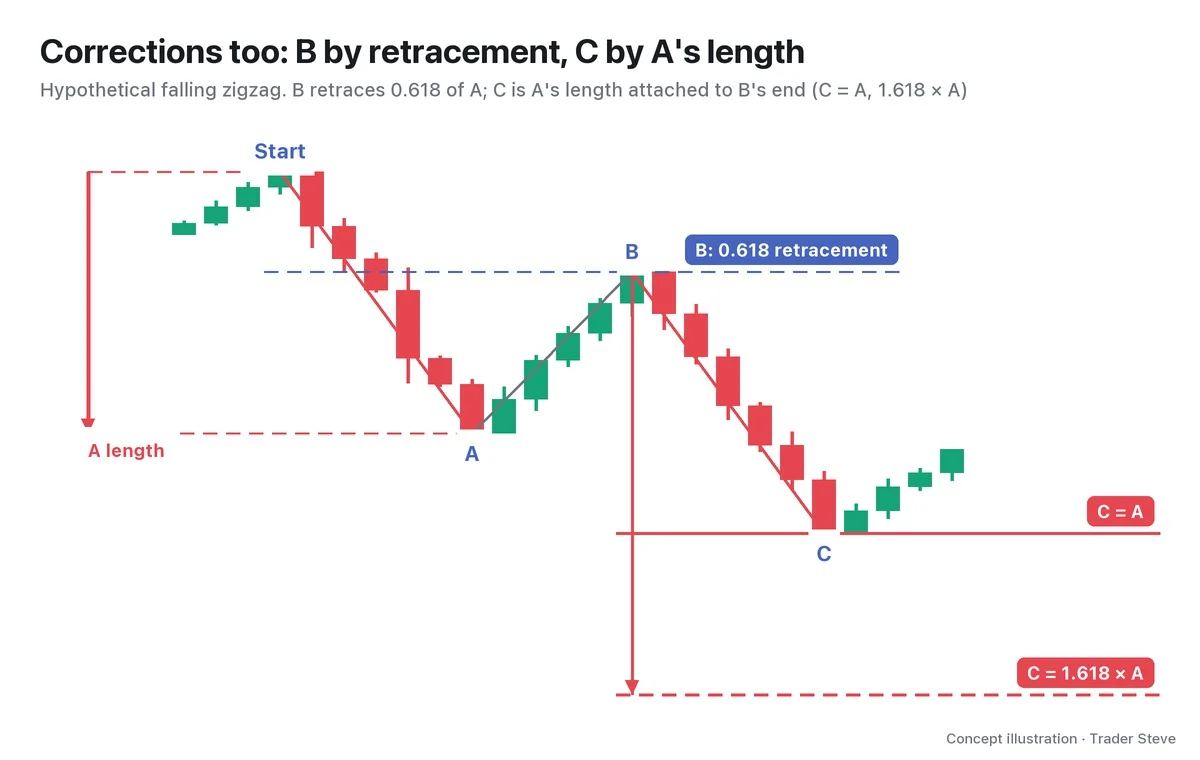
- Fibonacci projection: takes another wave's length × a ratio and attaches it to a new starting point. For example: wave 3 = point 2 + 1.618 × the length of wave 1; wave 5 = point 4 + 1 × the length of wave 1; wave C = point B − 1 × the length of wave A.
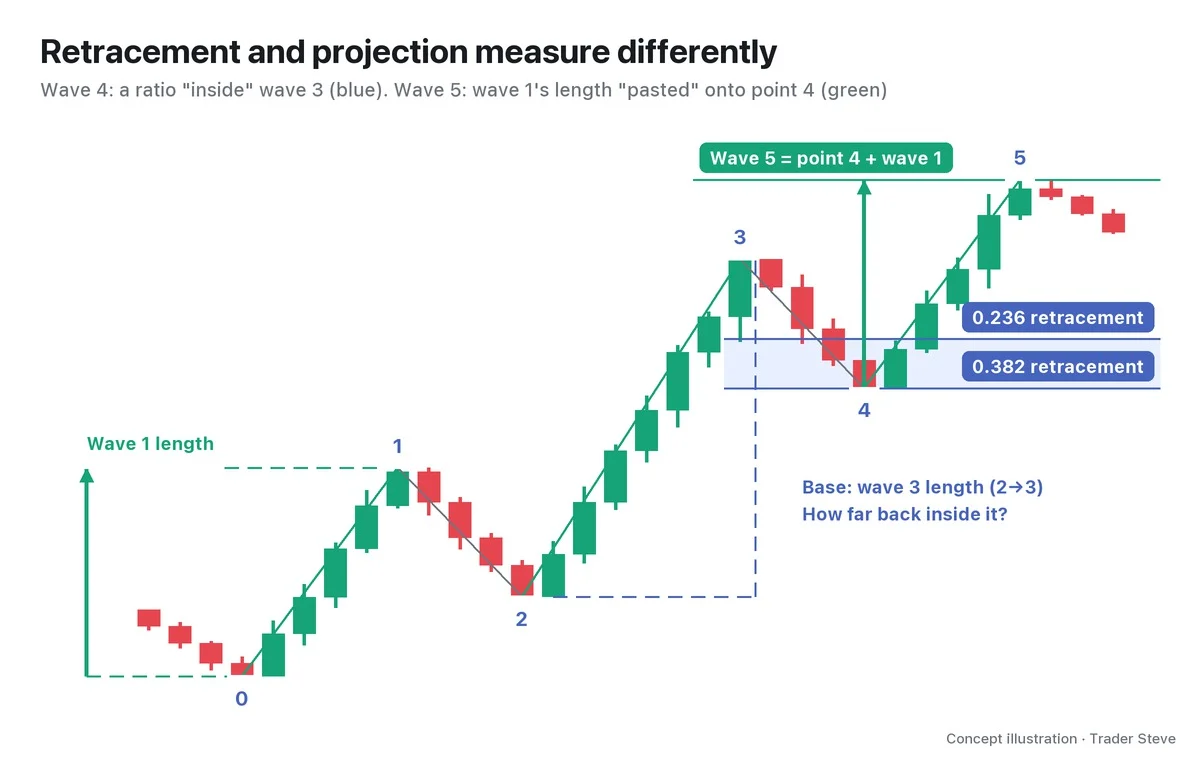
A retracement takes a single pass of the Fibonacci tool over the wave just before it. With a projection, the crucial point is that the wave you measure and the starting point you attach it to are different, so mark with an arrow where you measured the length and where you attached it, and you won't mix them up. Projections are often lumped together with the Fibonacci extension and simply called "extensions."
One term to separate before moving on. An extended wave is the name for one of waves 1, 3 or 5 that stretches unusually long; a Fibonacci extension is the name of a tool for measuring ratios. The names sound alike, but they mean different things (extended waves are covered in elliott/extension).
3. Typical Ratios by Wave at a Glance
Narrowed down to the typical values that textbooks mention most often:
| Wave | How it's measured | Common ratio |
|---|---|---|
| Wave 2 | retracement of wave 1 | 0.5–0.618 (on the deep side) |
| Wave 3 | point 2 + wave 1 length × k | 1.618x (2.618x if it runs further) |
| Wave 4 | retracement of wave 3 | 0.236–0.382 (on the shallow side) |
| Wave 5 | point 4 + wave 1 length × k | 1x (same length as wave 1, equality) |
| Wave C | point B − wave A length × k | 1x (C = A), then 1.618x |
Corrective waves work the same way: B is measured as a retracement, C as a projection.
Which ratios fit changes depending on which wave extends. That, along with a more detailed ratio table, is covered in Part 2.
4. Why Use Elliott Wave and Fibonacci Together
There are two reasons. First, where price has never traded before — all-time-high territory — there is no prior high or high-volume zone to refer to. In that situation, this is practically the only tool that lets you build candidates for "how far" from the lengths of the waves already completed. Second, many people are watching the same lines.
"Paradoxically, Elliott Wave works well on the names that are running up into new all-time highs. Why? Because everyone in the world who watches Elliott Wave is buying and selling off of it." — Trader Steve, live stream, Sep 21, 2026 (translated from Korean) · ▶ Watch the stream highlights (Korean audio)
I'm not usually a big Elliott Wave person, but back when I built scenarios by hand, this step was always part of the routine.
"I'd build out these Elliott Wave counts, set up every reference for going up and going down, sketch out scenarios, and draw how far the Fibonacci retracements and extensions could go…" — Trader Steve, live stream, Aug 20, 2026 (translated from Korean) · ▶ Watch the stream highlights (Korean audio)
The two work as a pair: the count decides "which wave are we in now," and the ratios measure "where that wave could end." Draw ratios without a count and you can't even decide which wave's length to measure.
5. Real ETH 4-Hour Chart: Wave 3 Stopped at 2.618 Times Wave 1
This is one possible count of the decline on the Ethereum (ETH) 4-hour chart in October 2026, built with data through Oct 15.
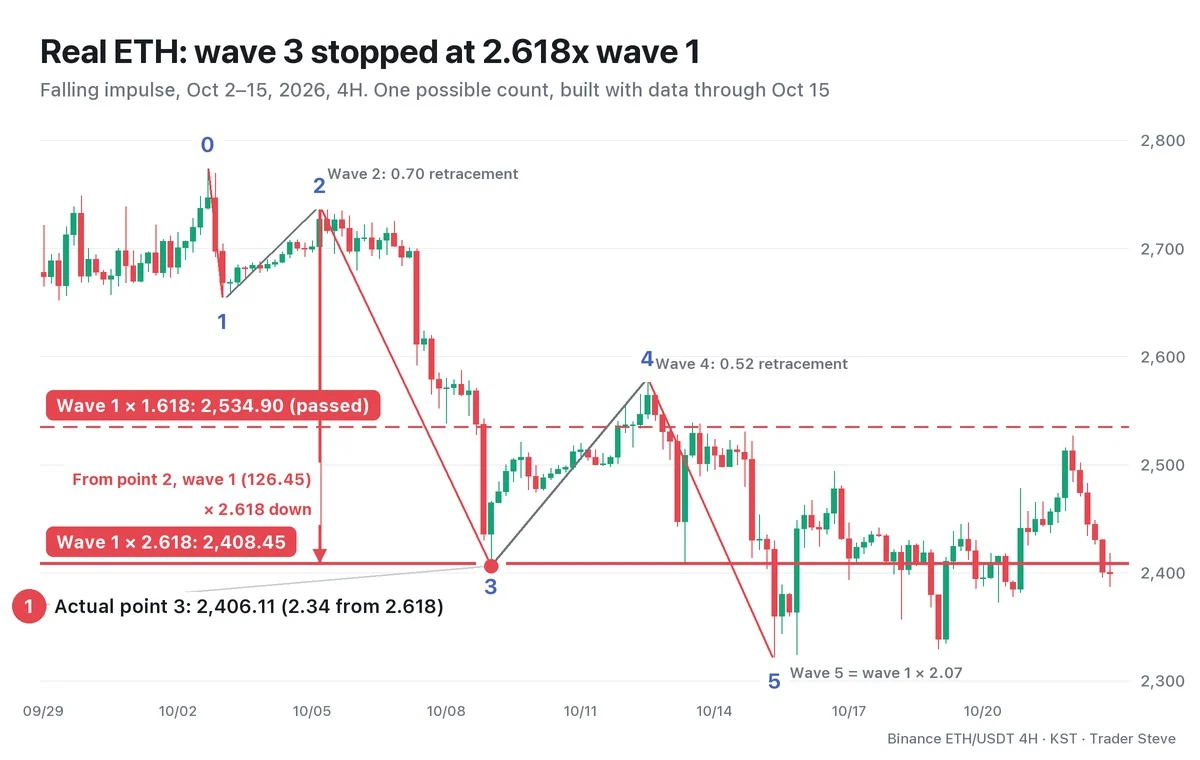
Set the 2,777.33 high of the Oct 2 17:00 candle as point 0. Wave 1 runs to the 2,650.88 low of the Oct 3 01:00 candle, so wave 1 is 126.45 long. Wave 2 bounced to 2,739.50 on the Oct 5 05:00 candle. Attaching the wave 1 length to point 2 to measure candidates for wave 3 gives 2,534.90 at 1.618x and 2,408.45 at 2.618x.
The actual wave 3 went straight through the 1.618x level and fell to 2,406.11 on the Oct 9 01:00 candle. Wave 3 was 2.64x the length of wave 1, $2.34 away from the 2.618x projection line. This is the sequence playing out exactly as described: if price doesn't stop at 1.618x, you look at the next candidate, 2.618x.
For balance, here are the ratios that didn't fit.
- Wave 2: a 0.70 retracement of wave 1 — deeper than the typical 0.5–0.618.
- Wave 4: a 0.52 retracement of wave 3 (2,579.88 on the Oct 12 13:00 candle) — deeper than the "on the shallow side" guideline.
- Wave 5: down to 2,318.00 on the Oct 15 09:00 candle, 2.07x wave 1 — far from "wave 5 = wave 1."
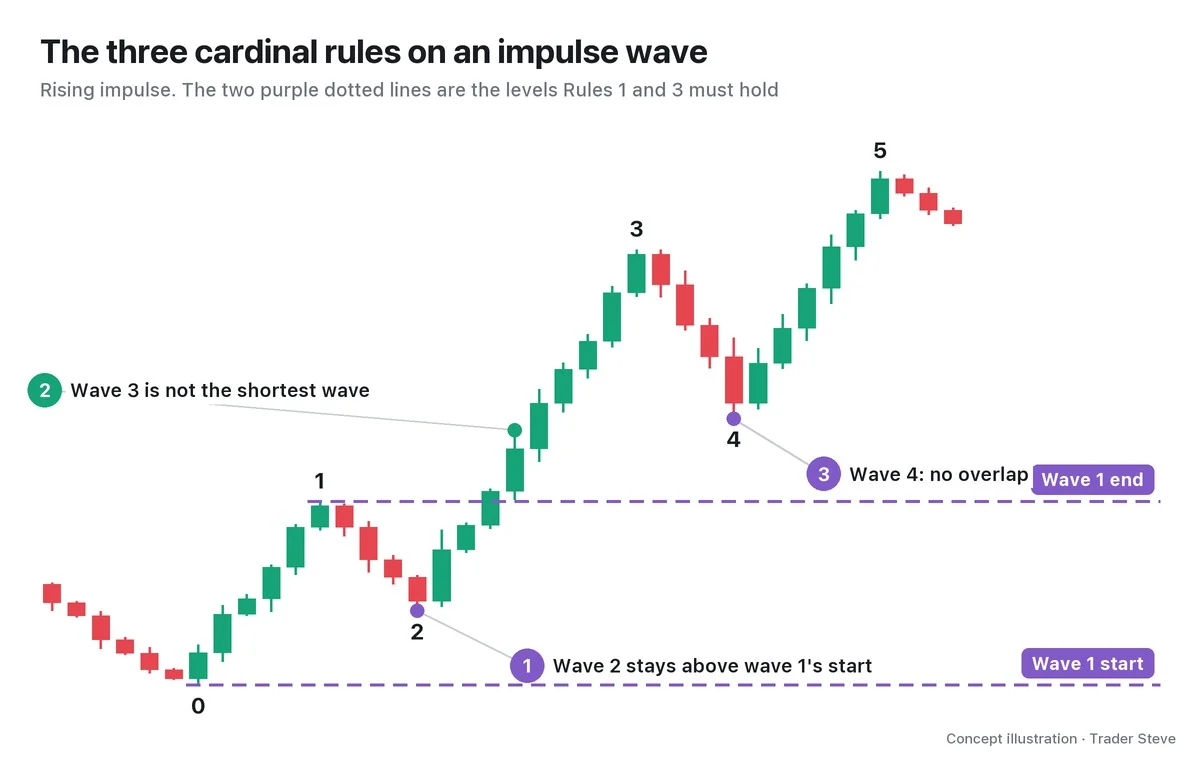
Even so, this count obeys all three cardinal rules of Elliott Wave. The wave 2 high did not exceed point 0, wave 3 is not the shortest of waves 1, 3 and 5, and the wave 4 high of 2,579.88 stopped $71.00 below the end of wave 1 at 2,650.88, so it did not overlap wave 1's territory. A ratio that misses doesn't make the count wrong, because there are only three rules, and the ratios are guidelines (the rules are covered in elliott/rules-guidelines).
Key Takeaways
- Elliott Wave Fibonacci ratios describe a tendency for the lengths and depths of waves to line up near 0.382, 0.618, 1 and 1.618.
- Waves 2, 4 and B are measured as a retracement inside the previous wave; waves 3, 5 and C as a projection that attaches another wave's length to a new starting point.
- Typical values: wave 2 at 0.5–0.618, wave 3 at 1.618x, wave 4 at 0.236–0.382, wave 5 = wave 1, and C = A.
- Ratios are only "candidate zones," not rules. The only things that must hold are the three cardinal rules. In the real ETH example, wave 3 fit, but waves 2, 4 and 5 differed from the typical values.
In Part 2, we'll cover where to measure the wave 2 and wave 4 retracements and the wave 3 and wave 5 projections from and to, anchor point by anchor point, and how the ratios change depending on which wave extends. If measuring the count and the ratios by hand for every market gets tedious, the Omnisight Report below lays out the Elliott Wave count for you as well.
This lesson adapts the text, figures and live-stream quotes of the Trader Steve TA series for the web, translated from the original Korean. Check the text and figure captions for the timing and interpretation of each real example, and read conceptual diagrams and real charts separately.
Corrections: support@omnisight.report