What Is an Elliott Wave Flat? The 3-3-5 Sideways Correction Explained
Historical examples for learning · not current prices or trade recommendations.
Contents
After a big rally, you often see price stop falling apart and instead drift sideways, swinging up and down without going much lower. In Elliott Wave theory, one type of correction like this is called a flat (flat correction). This lesson uses diagrams and a real Ethereum (ETH) chart to explain what a flat is, how it differs from a zigzag, and why this shape forms.
All dates and times are Korea Standard Time (KST, UTC+9). A daily candle is dated by its 09:00 KST open, and the time shown for an intraday candle is the time that candle opens. The actual intraday time of a high or low is stated separately.
1. The One-Line Definition: An A-B-C Correction That Goes Sideways Instead of Deep
A flat is an A-B-C correction after a trend that lies on its side: wave B retraces almost all the way back to where wave A started, and wave C comes back down to around where wave A ended.
Elliott Wave splits corrections into two broad families. A sharp correction drags price down deeply in a short time. A sideways correction doesn't take price much lower; it burns time and drifts sideways. The classic sharp correction is the zigzag; the classic sideways corrections are the flat and the triangle.
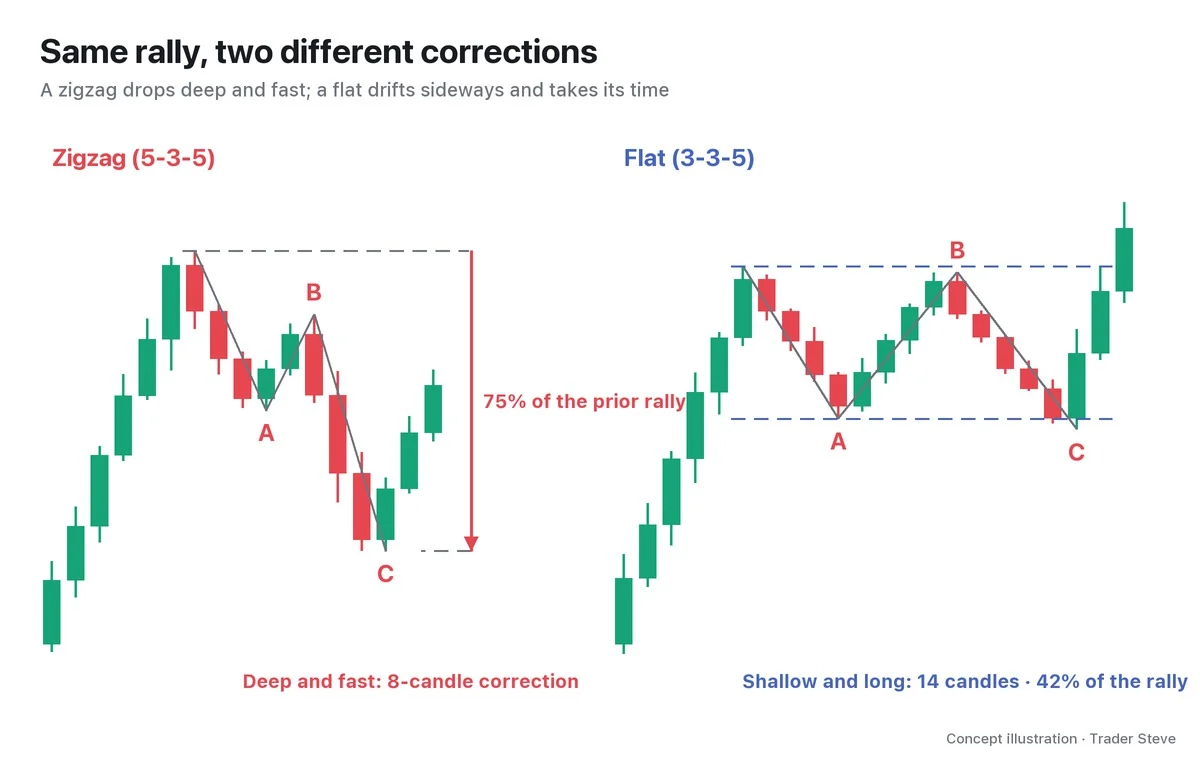
On the left, the zigzag's wave B bounces only about 60% of wave A, and wave C drops well below the wave A low. On the right, the flat's wave B climbs to just under the start of wave A, and wave C stops near the end of wave A. Price bouncing between the two blue dashed lines is where the name "flat" comes from.
In short, a zigzag corrects through depth; a flat corrects through time.
2. Look Inside and You See 3-3-5: Where It Parts Ways With the Zigzag
When the outer shape alone can't tell the two apart, look inside. In Elliott Wave, the number of smaller waves each wave breaks into is what gives a pattern its name.
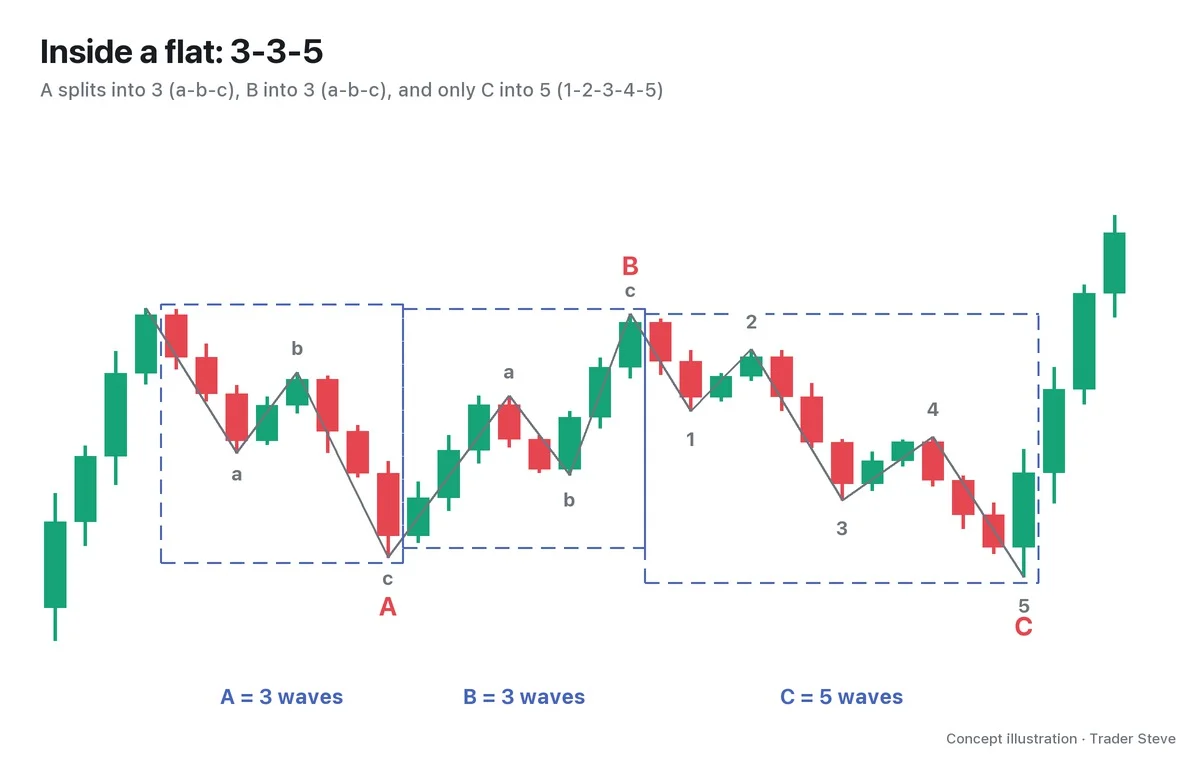
- Wave A: 3 waves (a-b-c). It doesn't fall in one straight drop; it goes down, up, then down.
- Wave B: 3 waves (a-b-c). It also rises in three waves and comes back to near the start of wave A.
- Wave C: 5 waves (1-2-3-4-5). Only the final decline takes the shape of a five-wave impulse wave.
That's why the internal structure of a flat is called 3-3-5. A zigzag is 5-3-5: its wave A is already a strong five-wave decline. If wave A drops forcefully in five waves, think zigzag first; if it slides down weakly in three, think flat first. The zigzag itself is covered separately in Elliott Wave Zigzags (related lesson).
On real charts, the small waves often can't be counted this cleanly, so you also check "how much of wave A did wave B retrace?" As a rough guide, if wave B retraces 90% or more of wave A, lean toward a flat. The exact classification criteria are in Part 2.
3. The Three Faces of a Flat: Regular, Expanded, Running
Flats come in three types, depending on whether waves B and C cross the A-start line and the A-end line.
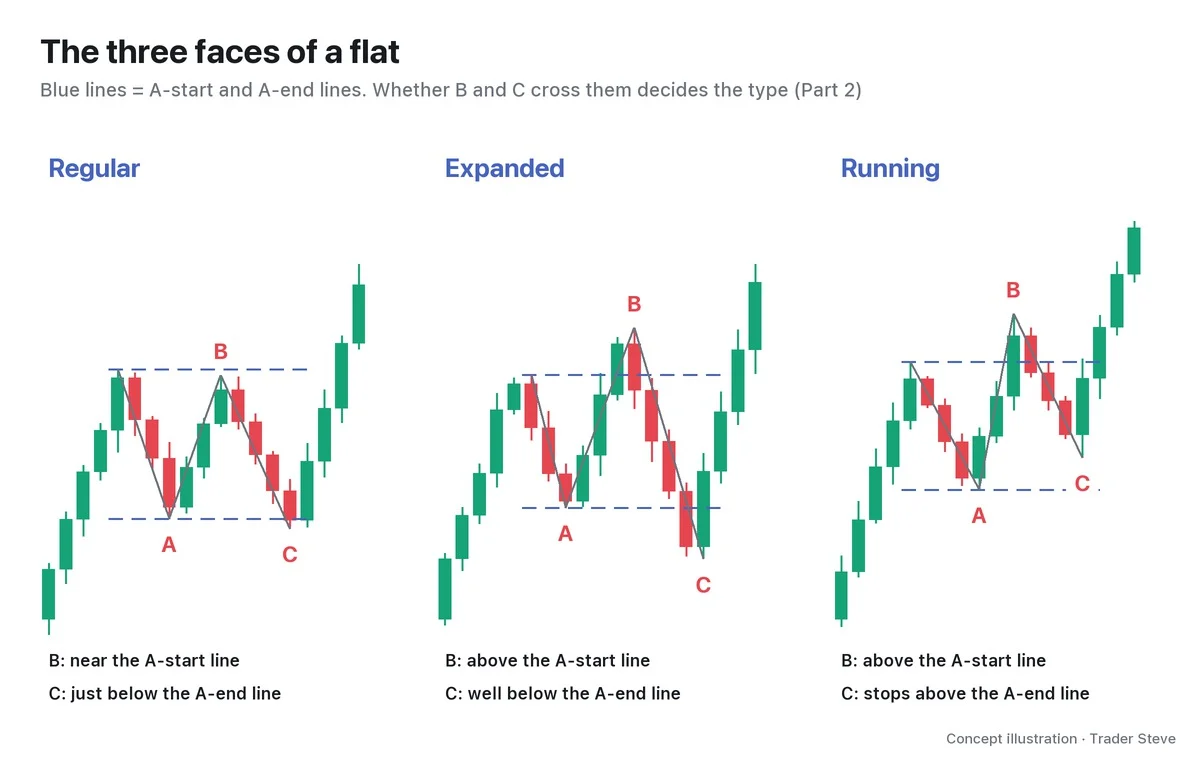
- Regular flat: wave B stops near the A-start line, and wave C goes only slightly past the A-end line.
- Expanded flat: wave B goes beyond the A-start line to make a new high, and wave C falls well below the A-end line. It's also called an irregular flat, and it is the most common type of flat.
- Running flat: wave B goes beyond the A-start line, but wave C stops without even reaching the A-end line. It shows up rarely, and only in very strong trends.
Because wave B of an expanded flat takes out the prior high, it's an easy spot to mistake for "the trend has resumed." How to separate the three types with numbers is covered in Part 2; the wave B trap in an expanded flat and how to handle wave C come in Part 3.
4. Why It Forms: When the Other Side Is Weak, the Market Rests in Time
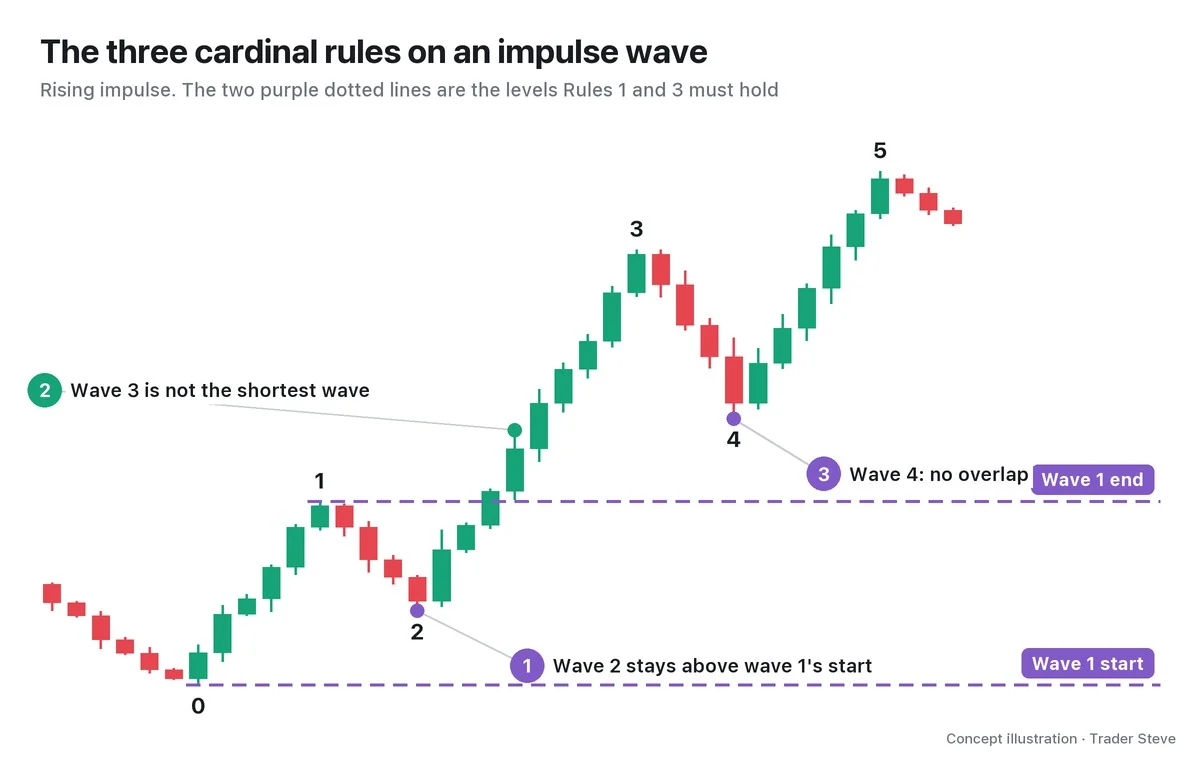
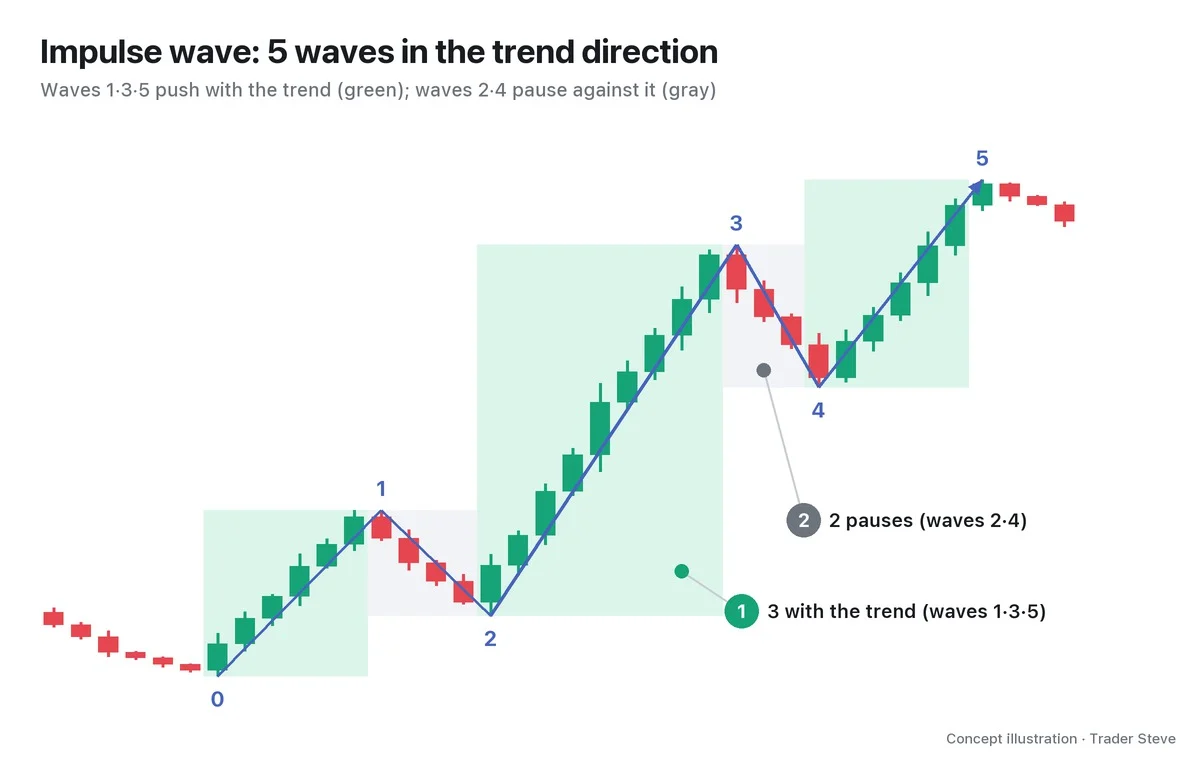
The usual explanation for a flat is that the pressure against the trend is weak. In a correction within an uptrend, that means sellers aren't strong enough to drag price down deeply. Buyers keep absorbing selling from below, so price can't fall far and instead uses up time drifting sideways. That's why the original trend often resumes strongly after a flat, and for the same reason flats often appear in the wave 4 position of an impulse wave (wave 4 is covered in elliott/impulse).
I don't use the name "flat" on the live stream, but this is how I've explained why price moves in A-B-C:
"The so-called wave structure really isn't something you can ignore. Because rallies and drops always come out as ABC. … It's not just a belief. It has to move like this for the big players — the ones who actually move price — to make money." — Trader Steve, live stream, Aug 20, 2026 (translated from Korean) · ▶ Watch the stream highlights (Korean audio)
Big money can't buy or sell all at once. The people who will take the other side of that size show up when price is rising, and wave B is exactly that stretch.
"They keep selling into the people jumping on as it gets pushed up, and once it crosses the critical point — the tipping point — from there they just slam it down. That's why drops always come out as ABC." — Trader Steve, live stream, Oct 22, 2026 (translated from Korean) · ▶ Watch the stream highlights (Korean audio)
I said this while looking at an altcoin chart. The flow is: as people jump on the bounce (wave B), size gets handed off to them from above, and once it's all handed off, price drops in wave C. Seen this way, a flat — where wave B climbs to near the start of wave A, and sometimes above it — can be read as "a correction that made plenty of room to hand off size."
5. Real Chart: A Regular Flat on the Ethereum 4-Hour Chart
Let's check it on a real chart. Below is the Ethereum (ETH) 4-hour chart for June–July 2025, read as a regular flat. This is one possible count.
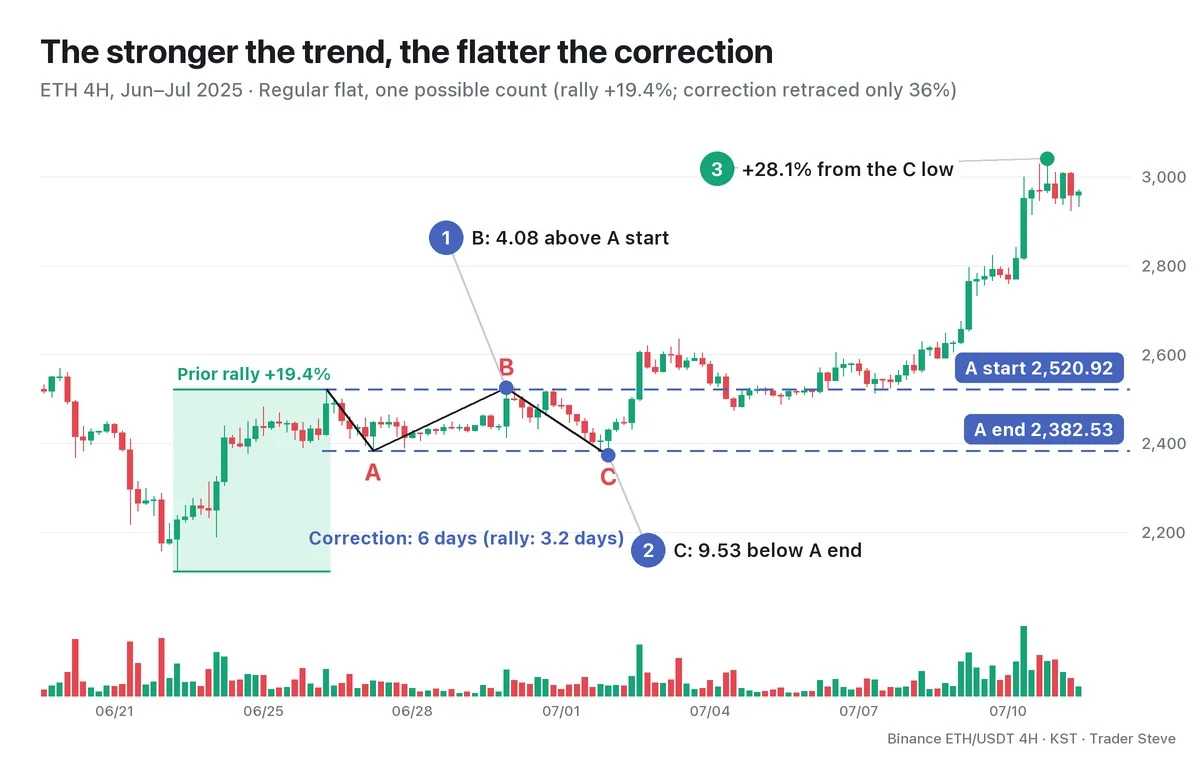
| Point | Time (KST) | Price |
|---|---|---|
| Rally start | Jun 23, 05:00 | 2,111.89 |
| A start (rally end) | Jun 26, 09:00 | 2,520.92 |
| A end | Jun 27, 09:00 | 2,382.53 |
| B end | Jun 30, 05:00 | 2,525.00 |
| C end | Jul 2, 09:00 | 2,373.00 |
| Later high | Jul 11, 17:00 | 3,040.15 |
- The prior rally gained 19.4% over about 3.2 days.
- Wave A fell 138.39 (-5.49%).
- Wave B stopped 4.08 above the start of wave A — in effect, it came right back to the A-start line.
- Wave C stopped 9.53 below the end of wave A. Going just slightly past the A-end line is textbook regular-flat behavior.
- The whole correction retraced only 36% of the prior rally, but it took 6 days — nearly twice as long as the rally itself.
- After that, price rose 28.1% from the C low to reach 3,040.15.
This case shows the saying "the stronger the trend, the flatter the correction" in action. After a correction that was shallow in price and long in time, a rally bigger than the prior one followed. It doesn't always go this way after a flat; cases with different outcomes come in Part 4.
Key Takeaways
- A flat is an A-B-C correction that drifts sideways. Wave B retraces to near the start of wave A, and wave C comes back down to near the end of wave A.
- Inside, it's 3-3-5 (A in 3, B in 3, C in 5); a zigzag is 5-3-5.
- Where a zigzag corrects through depth, a flat corrects through time.
- Depending on whether B and C cross the A-start line and the A-end line, flats come in three types: regular, expanded and running.
- It's a correction that forms when the opposing side is weak, so the trend that follows is often strong — but that is not a confirmed signal.
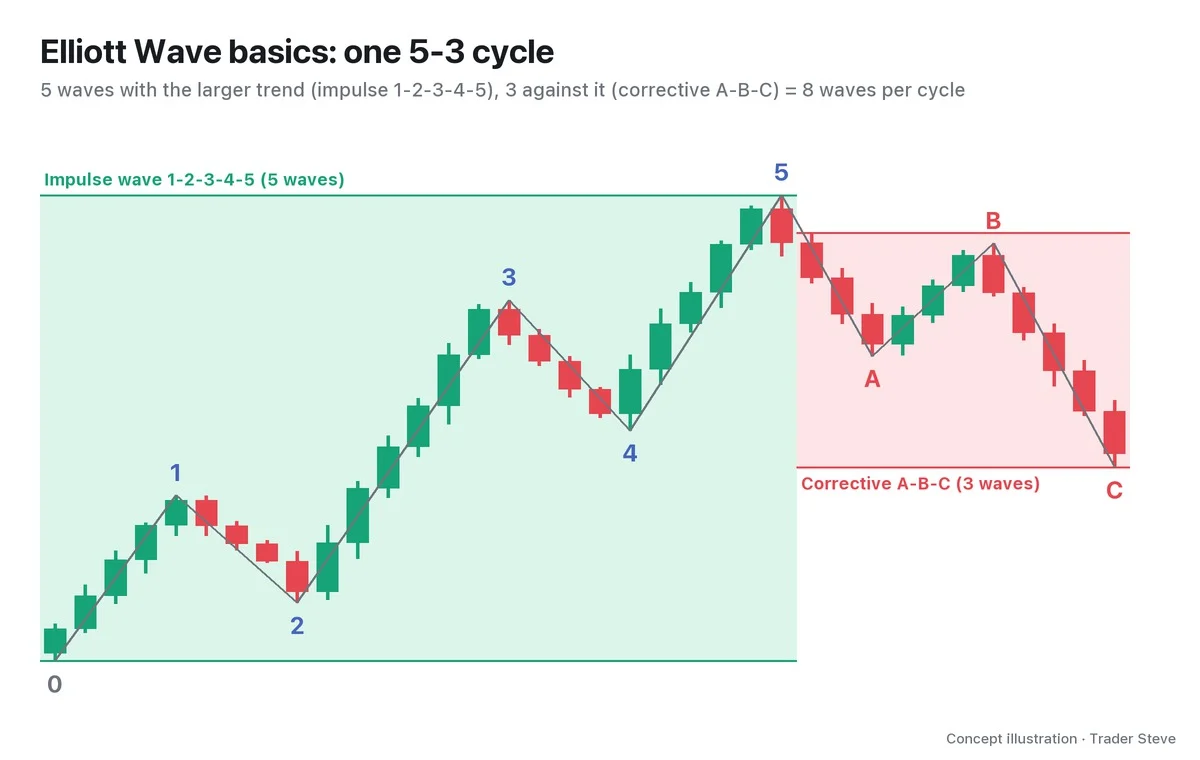
If the basic wave structure is new to you, you may want to start with elliott/basics. In Part 2, we'll cover the criteria for separating regular, expanded and running flats with numbers, and how to draw them.
Drawing reference lines and counting waves by hand for every market takes real time. The Omnisight Report lays this process out for each market.
This lesson adapts the text, figures and live-stream quotes of the Trader Steve TA series for the web, translated from the original Korean. Check the text and figure captions for the timing and interpretation of each real example, and read conceptual diagrams and real charts separately.
Corrections: support@omnisight.report