What Is an Impulse Wave? The Elliott Wave 5-Wave Trend Structure Explained
Historical examples for learning · not current prices or trade recommendations.
Contents
The first shape you meet when you start learning Elliott Wave is the impulse wave. On the live stream I also just call it "the impulse." This lesson uses diagrams and a real Ethereum chart to explain what an impulse wave is, why price swings back and forth instead of going straight, and how to spot one on a chart.
All dates and times are Korea Standard Time (KST, UTC+9). A daily candle is dated by its 09:00 KST open, and the time shown for an intraday candle is the time that candle opens. The actual intraday time of a high or low is stated separately.
1. The One-Line Definition: Push Three Times, Rest Twice
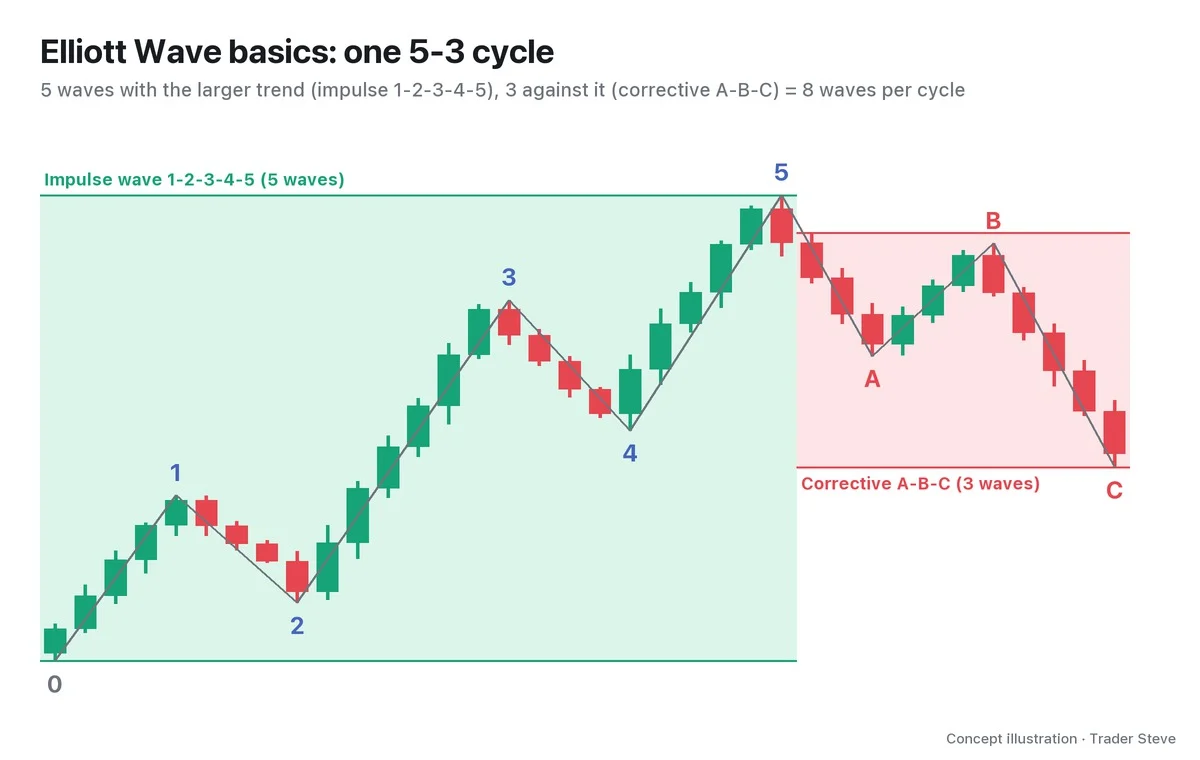
An impulse wave is five waves that move in the direction of the trend. In a rising impulse, price climbs in wave 1, rests in wave 2, climbs again in wave 3, rests in wave 4, and climbs once more in wave 5.
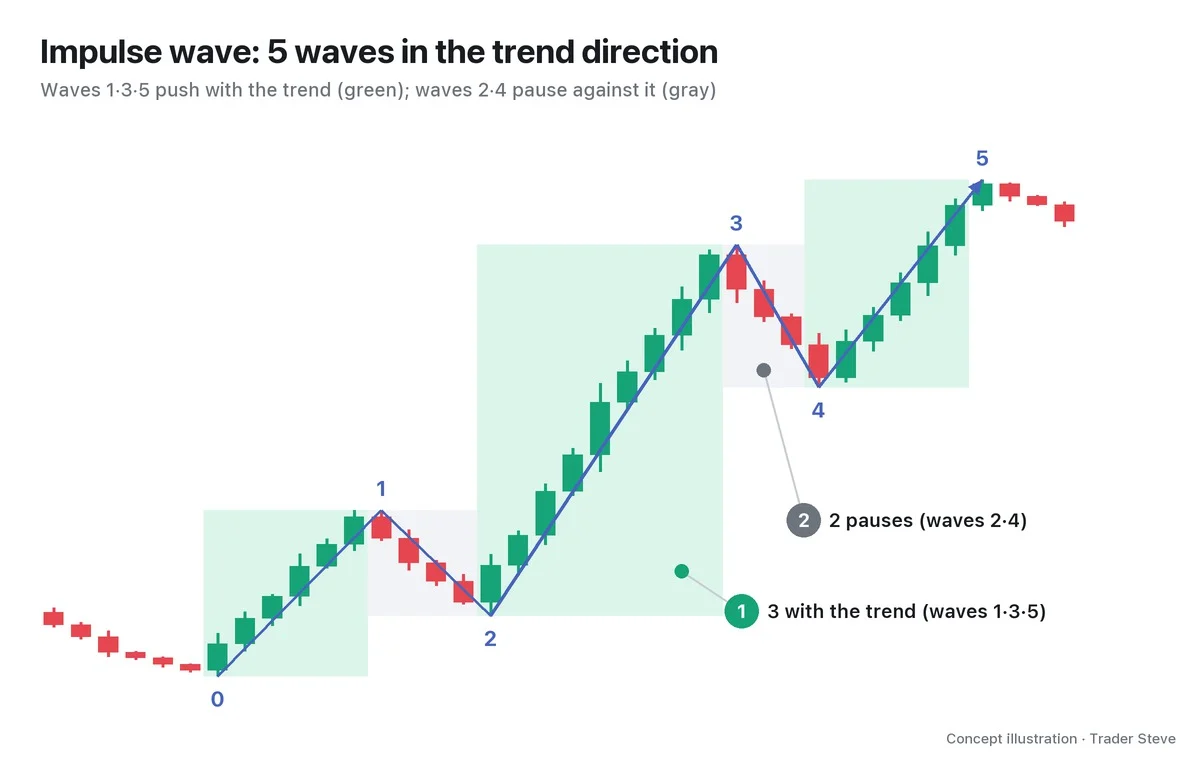
If that feels like a lot, "push three times, rest twice" is enough to remember. Put another way, it is a move that lifts both the highs and the lows like a staircase. You can think of the impulse wave as the cleanest form of what Dow Theory calls an uptrend (higher highs and higher lows).
For reference, any five-wave structure in the trend direction is called a motive wave, and the impulse wave is its most basic form. A variant that also has five waves but whose waves overlap and narrow like a wedge is called a diagonal.
2. Waves 1·3·5 and Waves 2·4 Do Different Jobs
The five waves fall into two groups.
| Group | Waves | What they do |
|---|---|---|
| Actionary | 1·3·5 | push price in the trend direction |
| Reactionary | 2·4 | retrace part of the previous move and pause |
Once the five impulse waves are complete, a corrective wave follows in the opposite direction. The most basic correction is three waves: A, B and C. So one Elliott Wave cycle is 5 impulse waves + 3 corrective waves, 8 waves in total.
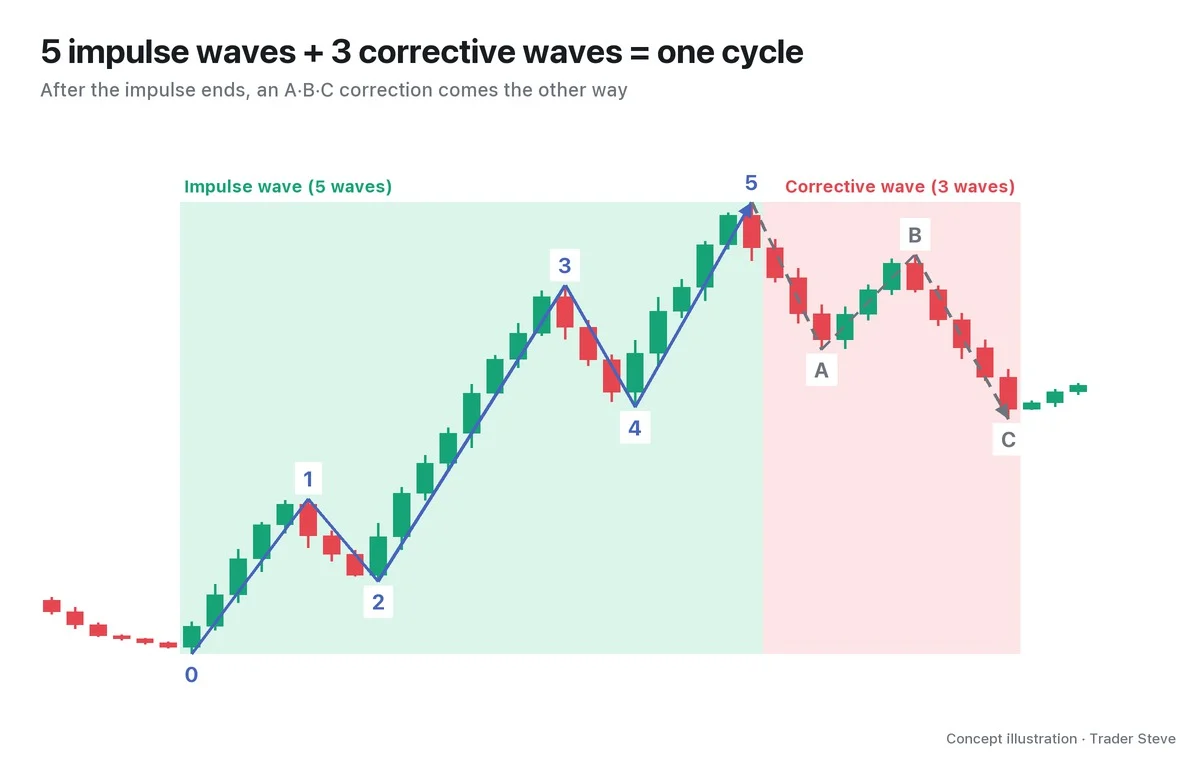
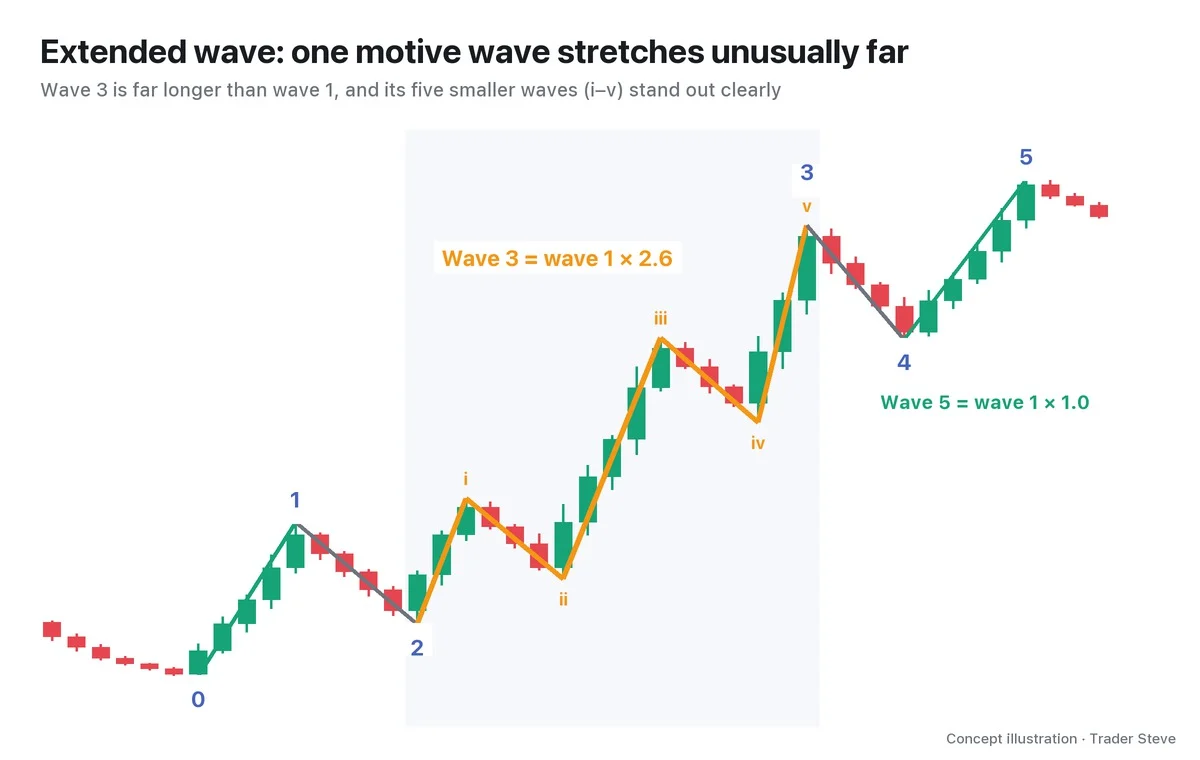
This 5-3 rhythm repeats in the big picture and in the smaller pictures inside it. Zoom into any one of waves 1, 3 or 5 and you see five smaller waves again; zoom into wave 2 or 4 and you see three smaller ones (these are called subwaves). Part 2 covers this internal structure on a real Bitcoin chart.
3. Why Price Swings Instead of Going Straight
The most common question about impulse waves is: "If it's going up, why doesn't it just go straight up? Why make waves 2 and 4 and shake around?" On the live stream, I explained this through the average entry price of whoever is moving price.
"It has to move like this for the big players who actually move price to make money. Say they push it straight up, one way. … From their side, even if they start accumulating from here, they've pushed it one way all the way up to here. Then the big players' average buy price ends up somewhere like this. … A one-way move always loses money for the big players." — Trader Steve, live stream, Aug 20, 2026 (translated from Korean) · ▶ Watch the stream highlights (Korean audio)
When big money buys and drives price up, price rises while they are still buying, so their average entry keeps getting more expensive. If they push it straight up in one go, the average entry ends up somewhere around the middle of the move, and later, when they want to sell, there is no obvious crowd to take the other side.
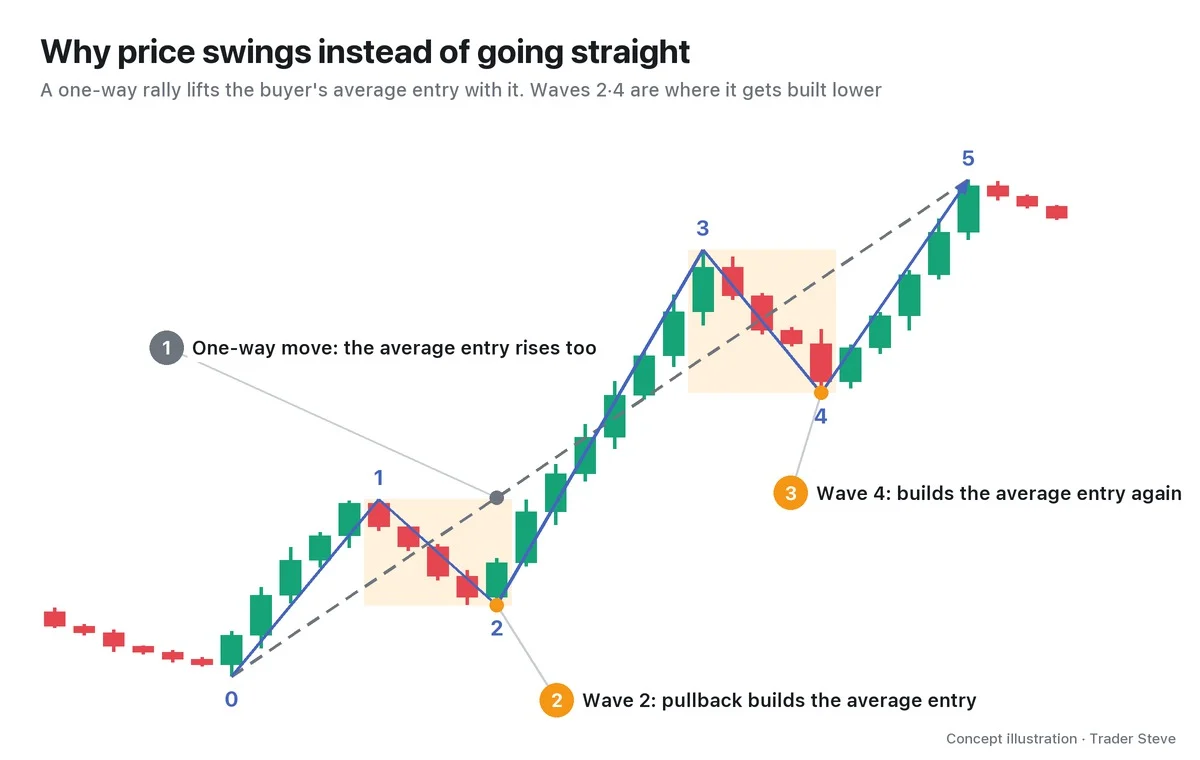
So price rises, gets pushed back once (wave 2), absorbs size again at that level, and then rises further (wave 3). Wave 4 does the same job one more time. Seen this way, waves 2 and 4 are not a sign that the trend is weakening. They are pauses that let the trend continue.
4. Three Signs of an Impulse Wave
When you look for an impulse wave on a chart, start with three things about its shape.
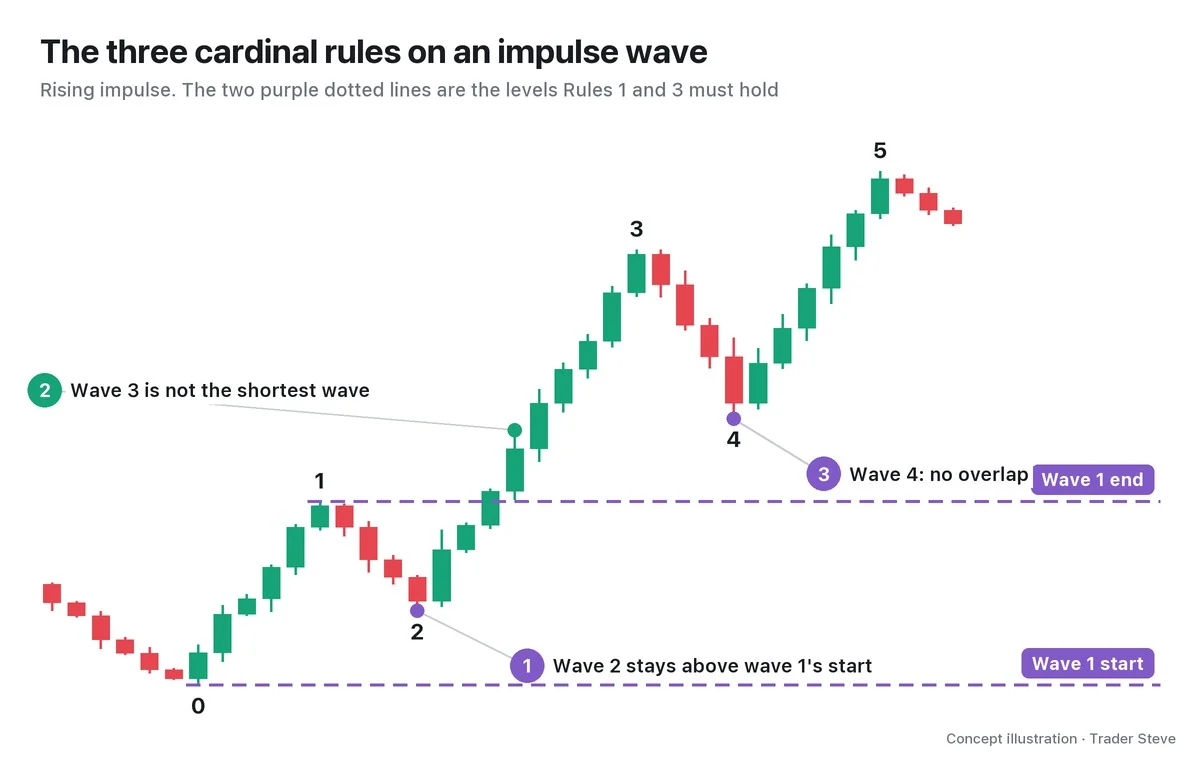
- The highs and lows rise together like a staircase. Wave 1 high < wave 3 high < wave 5 high, and start < wave 2 low < wave 4 low.
- Wave 4 does not come down below the end of wave 1. Even a deep pullback doesn't step back onto the earlier stair.
- Wave 3 is often the most powerful. It is usually the longest and steepest, and large-range candles tend to appear inside wave 3.
Here is a time I saw sign 2 play out in a real market. Talking about the long rise in US stocks after March 2020, I said this:
"That's a textbook impulse, a huge impulse. It never once broke into the previous high, it just kept going up and up, endlessly." — Trader Steve, live stream, Aug 25, 2026 (translated from Korean) · ▶ Watch the stream highlights (Korean audio)
Elliott's three cardinal rules are these three signs refined into formal rules. For example, sign 3 written as a rule is not "wave 3 must be the longest" but "wave 3 cannot be the shortest." Part 2 goes through the exact wording and how to check each rule.
5. Real Chart: Ethereum, Apr–May 2025
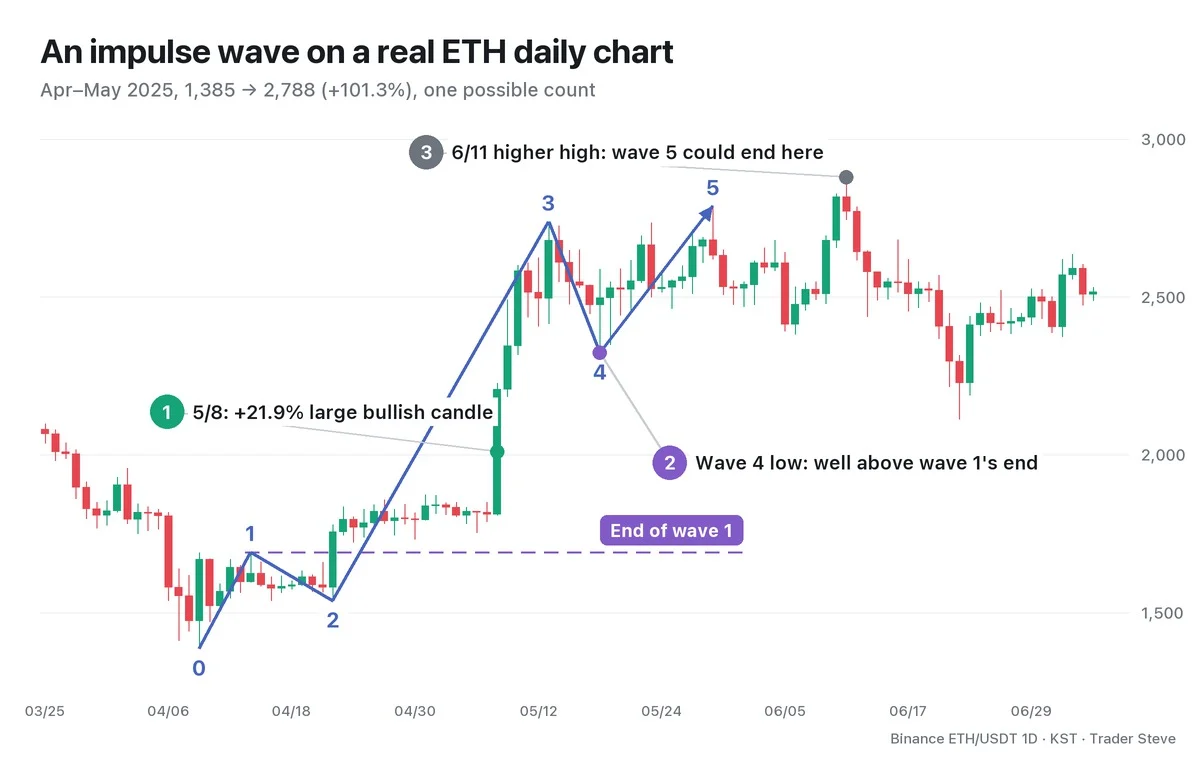
Let's look at a real chart that comes close to the textbook shape. Below is one possible count placed on the Ethereum daily chart for April–May 2025. Different people can count the waves differently.
| Wave | Dates | Price | Length |
|---|---|---|---|
| 0 → 1 | 4/9 → 4/14 | 1,385.05 → 1,691.50 | 306.5 |
| 1 → 2 | 4/14 → 4/22 | → 1,537.26 | 154.2 (0.503 retracement of wave 1) |
| 2 → 3 | 4/22 → 5/13 | → 2,738.50 | 1,201.2 (3.92x wave 1) |
| 3 → 4 | 5/13 → 5/18 | → 2,323.21 | 415.3 (0.346 retracement of wave 3) |
| 4 → 5 | 5/18 → 5/29 | → 2,788.00 | 464.8 |
All three signs are there. The highs and lows rose like a staircase, and the wave 4 low of 2,323.21 stopped 631.7 above the end of wave 1 at 1,691.50. Wave 3 was the longest at 3.92x wave 1, and inside it, on May 8, came a large bullish candle that gained 21.9% in a single day.
What came next is the important part. If this count is right, a correction should follow wave 5. In fact, price fell to the Jun 22 low of 2,111.89, -24.3% from the end of wave 5. In between, though, on Jun 11, price printed 2,879.22, 3.3% above the end of wave 5. A count that treats this high as the end of wave 5 also obeys every cardinal rule. Either way, the conclusion is the same: "a correction came after the fifth advance." But where wave 5 actually ended is only confirmed after the correction has started.
"These ones that pushed up in a full-on, so-called Elliott Wave, going 1, 2, 3, 4, 5 … they're not easy. Because on the way down, they also need an ABC." — Trader Steve, live stream, Oct 7, 2026 (translated from Korean) · ▶ Watch the stream highlights (Korean audio)
I use Elliott Wave less as the main basis for a trade and more as a supporting tool for sketching scenarios. If all five impulse waves are already in, I carry a map that says "an A·B·C correction is due now," and then check other evidence against it.
Key Takeaways
- An impulse wave is five waves that move in the direction of the trend. Waves 1, 3 and 5 push; waves 2 and 4 rest.
- 5 impulse waves + 3 corrective waves (A·B·C) make one Elliott Wave cycle.
- Waves 2 and 4 are where big money builds its average entry, so a trend doesn't go in one straight line — it swings as it goes.
- Rising highs and lows like a staircase, a wave 4 that stops above the end of wave 1, and a powerful wave 3 are the signs of an impulse wave.
- Whether wave 5 has ended is confirmed only after the fact. A wave count is always one possibility among several.
In Part 2, we'll cover the three cardinal rules that decide whether a move is an impulse wave, the 5-3-5-3-5 internal structure, and falling impulse waves.
Related reading: the 5-3 structure and wave degrees in "Elliott Wave Basics" (related lesson), and how to define a trend with highs and lows in Basics Swings and Trend (related lesson).
If lining up wave counts against other evidence by hand, market after market, feels like a chore, the Omnisight Report below does that work for each market.
This lesson adapts the text, figures and live-stream quotes of the Trader Steve TA series for the web, translated from the original Korean. Check the text and figure captions for the timing and interpretation of each real example, and read conceptual diagrams and real charts separately.
Corrections: support@omnisight.report