What Is Elliott Wave Invalidation? The Price Where You Drop a Count
Historical examples for learning · not current prices or trade recommendations.
Contents
Count Elliott waves for long enough and you will hit the same question every time: "How long should I trust this count?" This lesson lays out the answer, invalidation. Using four figures, I'll look at what an invalidation level is, where it comes from and what to do when it breaks.
All dates and times are Korea Standard Time (KST, UTC+9). A daily candle is dated by its 09:00 KST open, and the time shown for an intraday candle is the time that candle opens. The actual intraday time of a high or low is stated separately.
1. Same Chart, Many Counts: Why You Need a "Price Where I Admit I'm Wrong"
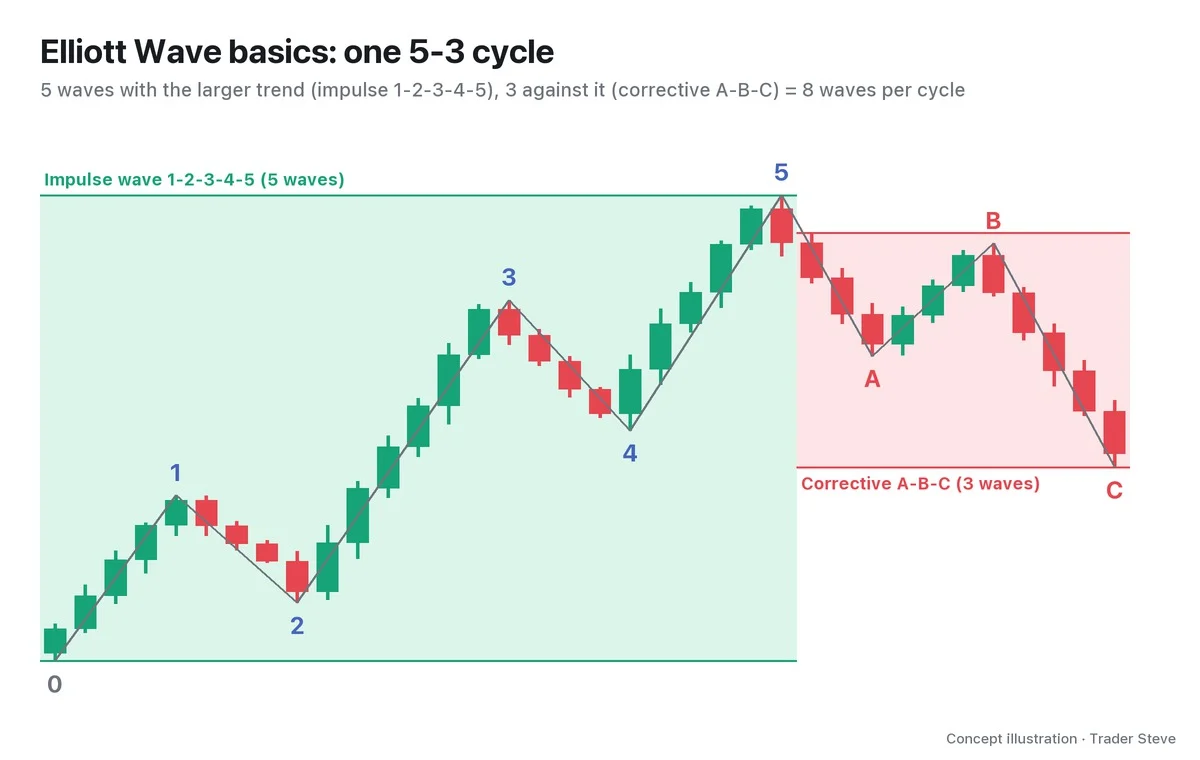
In Elliott Wave, numbering the waves is called the wave count. The problem is that the same candles can produce several counts. One person says we're in wave 4; another says the rise was a correction that has already ended. If neither count breaks the rules, neither can be called wrong at this moment.
When I get Elliott Wave questions on the live stream, my answer is always much the same.
"There's no right answer… Elliott Wave is just one of many ways to sketch out scenarios." — Trader Steve, live stream, Oct 22, 2026 (translated from Korean) · ▶ Watch this moment (Short, Korean audio)
If there's no right answer, is a count useless? No. A count can't tell you what will happen next, but it tells you very precisely "past this price, my count is wrong." When you use Elliott Wave as a scenario tool, that price is the most practical thing it gives you.
2. The One-Line Definition: Invalidation Level, Preferred Count and Alternate Count
An invalidation level is the price at which, if price crosses it, you admit the count is wrong. The simplest example is a rising 1-2 count.
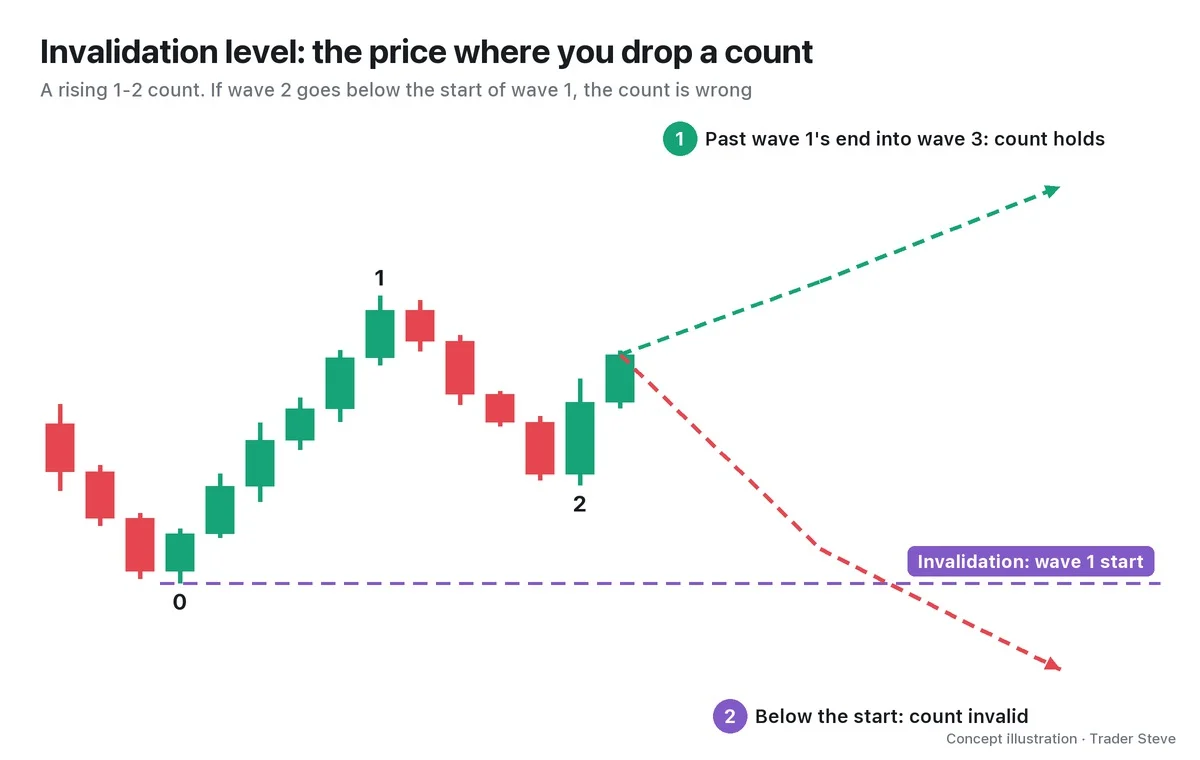
If you believe wave 2 is in progress, the fate of the count comes down to a single purple dotted line. If price climbs past the end of wave 1, the odds of wave 3 rise; if it breaks below the start of wave 1, "this was not a 1-2" is settled. You don't know whether price will go up or down. Either way, though, the price where your judgment changes is set in advance.
In practice, you don't hold just one count.
- Preferred count: the one count you currently consider most likely
- Alternate count: the count that takes over if the preferred count breaks
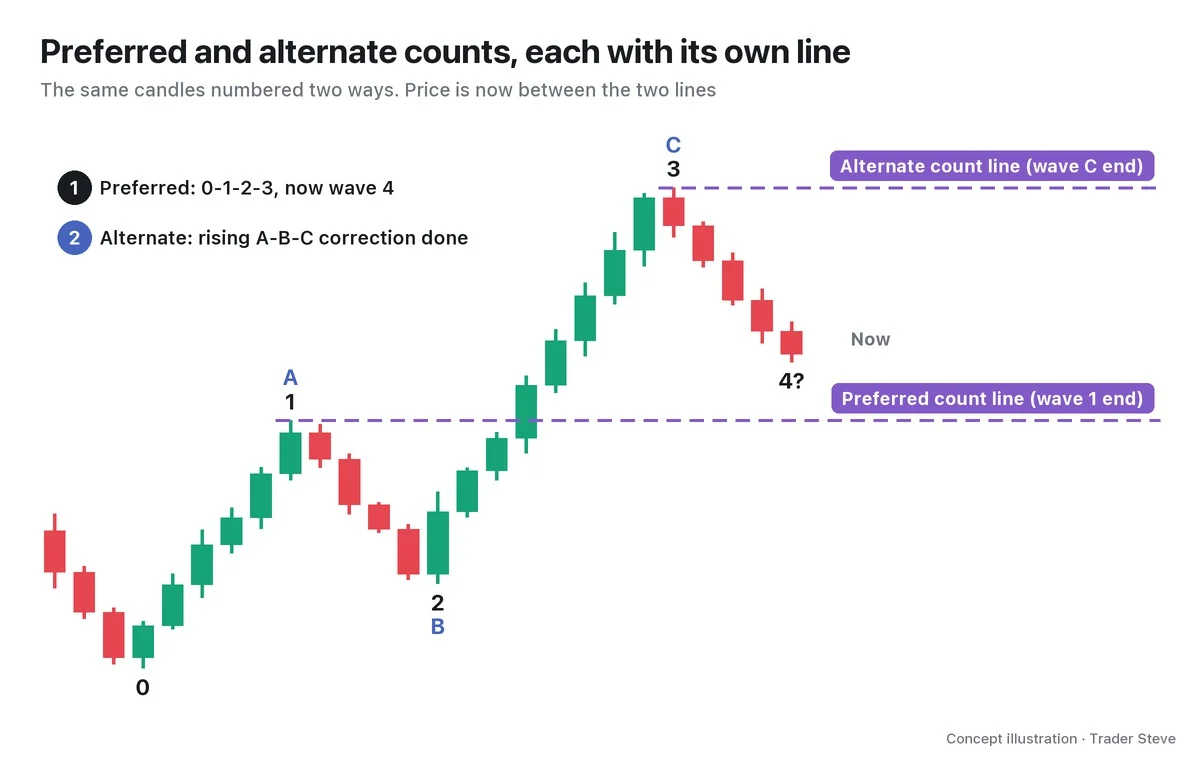
In the figure, the preferred count reads "rising wave 3 is over and we're now in wave 4," and the alternate count reads "this whole rise was an A-B-C correction, and it's already over." Each count has its own invalidation level. Price is currently between the two lines, so both counts are alive. If the lower line breaks, the preferred count is out; if price goes above the upper line, the alternate count is out. Holding several counts doesn't get confusing, because each count carries its exit condition as a number.
3. Where Invalidation Levels Come From: The Three Cardinal Rules
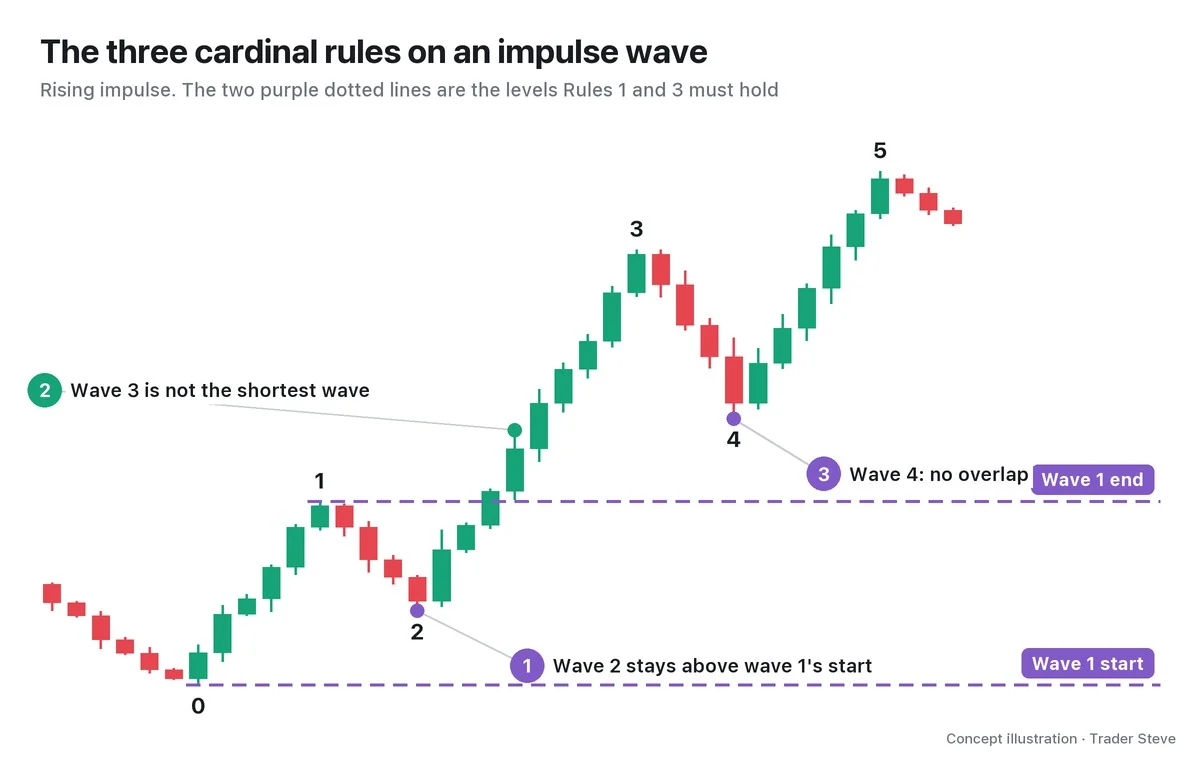
An Elliott invalidation level isn't drawn by feel. The three cardinal rules set the price. That makes it a matter of definition, not probability.
- Wave 2 in progress → the invalidation level is the start of wave 1 (Rule 1: wave 2 never goes below the start of wave 1)
- Wave 4 in progress → the invalidation level is the end of wave 1 (Rule 3: wave 4 never overlaps the price territory of wave 1)
The line in Figure 01 is the first case; the lower line in Figure 02 is the second. Part 2 gives a table, organized by wave position, that covers the lines while wave 3 or wave 5 is in progress, the hidden ceiling that appears when wave 3 is shorter than wave 1, and the invalidation levels of corrective waves. Why the rules themselves take this shape is explained in Elliott Wave Rules and Guidelines (related lesson).
4. Invalidation Means "Wrong Numbers," Not "Wrong Direction"
This is the most misunderstood part of invalidation. A broken invalidation level means this label is wrong; it does not automatically mean "the rally is over." So there is only one thing to do after the line breaks: erase the count and start again (recount).
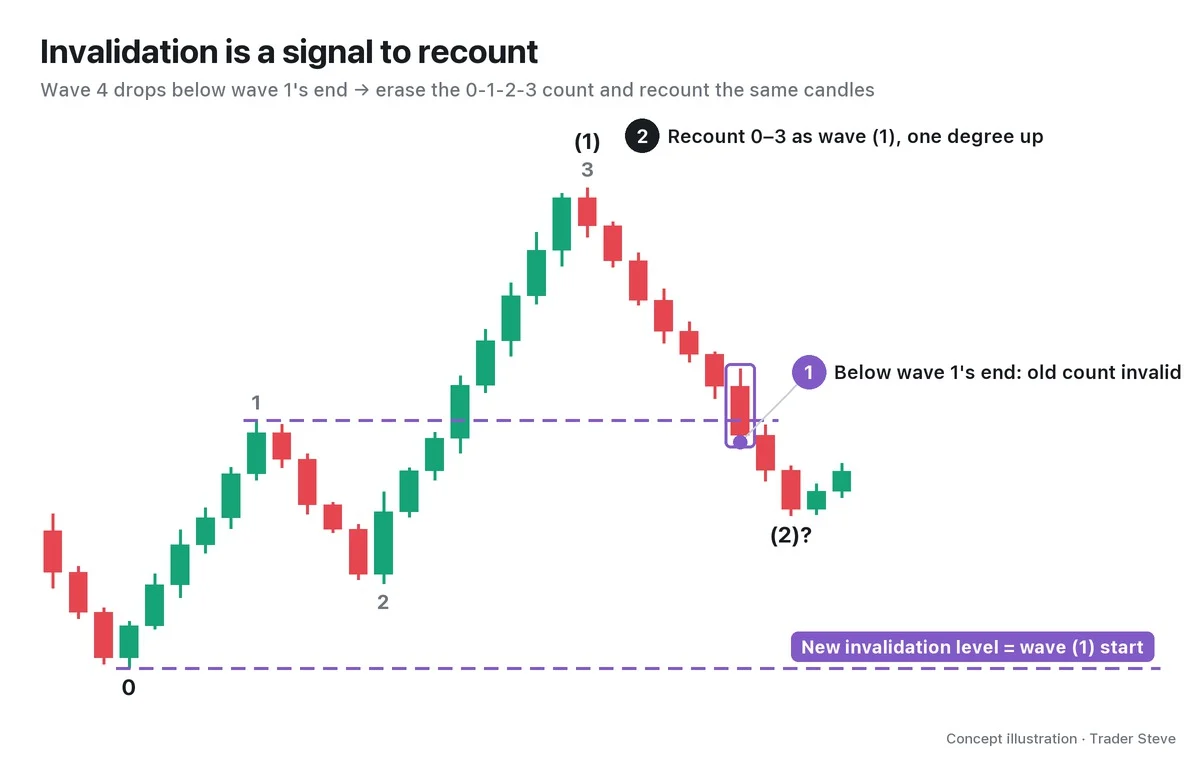
In Figure 03, the decline labeled wave 4 broke the end of wave 1. The 0-1-2-3 count ends here. But look at the same candles again from the start, and the entire rise from 0 to 3 can also be read as wave (1) of one wave degree higher. In that case we're now in wave (2), and the new invalidation level drops to point 0. In other words, the bullish scenario may still be alive at the larger degree. Of course, this is also only one of several alternatives, and some traders will recount it as an A-B-C correction. Wave degrees are covered in the Elliott Wave Basics topic (related lesson).
There is one principle you must keep here. Recounting means building a new count and a new invalidation level from scratch, not keeping the broken count alive under a new name. Once you start moving the line ("it only went a little past, let it slide," "that wasn't wave 4, it was actually a different wave"), the invalidation level stops doing its job. Part 5 collects these mistakes.
5. The Same Principle Outside Elliott Wave: The Line That Scraps a View
This principle isn't unique to Elliott Wave. Whatever lens I'm using to read a chart, I first set a price where "past this line, this view is scrapped." On the Aug 24 live stream, when a viewer asked whether the bearish view had been scrapped, I answered like this.
"Not yet. Because… if it gets past this zone, it's scrapped. Completely scrapped. Once it gets past here, the view that it's heading down is finished." — Trader Steve, live stream, Aug 24, 2026 (translated from Korean) · ▶ Watch the stream highlights (Korean audio)
In the same passage, I pointed to that zone as the 83,000 line. I said it at around 10:56 KST, and the Bitcoin (BTC) 1-hour candle containing that moment closed at 76,922. Here is how the actual chart played out afterward.
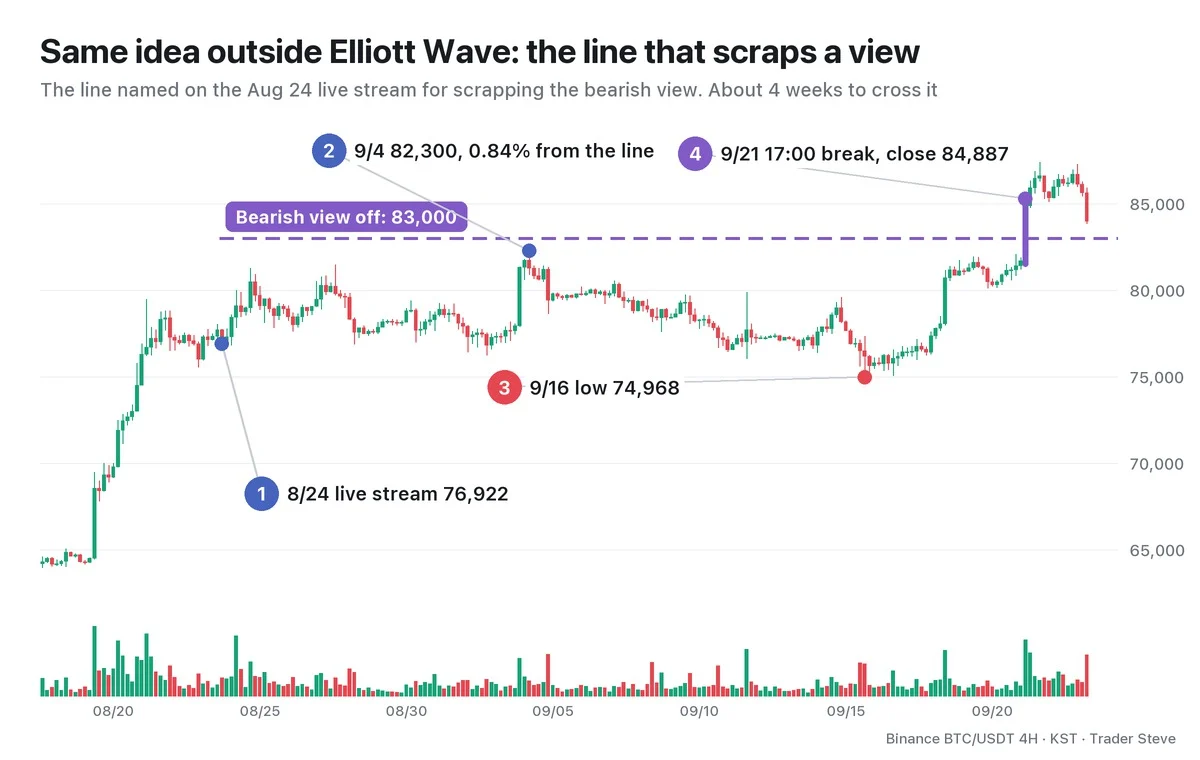
- At the time of the 8/24 live stream, price was 76,922, with room to spare below the line.
- The 9/4 05:00 4-hour candle rose to 82,300, leaving just 0.84% to the line. Price got close again on the night of 9/19 (81,951) and the morning of 9/21 (82,100). But it didn't cross, so the view stayed valid.
- In between, in the early hours of 9/16, price fell to 74,968, and for a while the bearish view looked right.
- The 9/21 17:00 4-hour candle crossed the line with a high of 85,300 and also closed above it at 84,887. At that moment, the bearish view was scrapped.
The point of this figure isn't "who called it." It's that a view stays valid until price crosses the line, however close it gets, and that it's finished once the line is crossed, however right it looked along the way. An invalidation level is not a line for being right; it's the line where you fold your judgment. The only difference with Elliott Wave is that the rules set this line for you. Part 3 covers how to use it as your stop-loss level.
Key Takeaways
- An invalidation level is the price at which, once price crosses it, you admit the count is wrong.
- In Elliott Wave, the rules set this price. The defaults are the start of wave 1 during wave 2 and the end of wave 1 during wave 4.
- Hold a preferred count and an alternate count together, and write down each one's invalidation level separately.
- Invalidation means "the numbers are wrong." When the line breaks, don't just rename the count; recount from the start.
- Views outside Elliott Wave work the same way: valid until the line is crossed, scrapped once it is.
In Part 2, we'll turn the counting process into a checklist and gather the invalidation level for each wave position into a single table. If writing out the count and invalidation conditions by hand for every market feels like a chore, the Omnisight Report below organizes that process for you.
This lesson adapts the text, figures and live-stream quotes of the Trader Steve TA series for the web, translated from the original Korean. Check the text and figure captions for the timing and interpretation of each real example, and read conceptual diagrams and real charts separately.
Corrections: support@omnisight.report