What Is an Elliott Wave Scenario? Drawing a Large Swing as a Map
Historical examples for learning · not current prices or trade recommendations.
Contents
Study Elliott Wave and you soon want it to answer one question: "So is the next move up or down?" I use Elliott a little differently. This lesson shows how to use Elliott not as a tool for calling the market but as a map of the big picture with the forks in the road marked on it — in other words, what a large swing scenario is and why Elliott Wave is the tool for drawing it.
All dates and times are Korea Standard Time (KST, UTC+9). A daily candle is dated by its 09:00 KST open, and the time shown for an intraday candle is the time that candle opens. The actual intraday time of a high or low is stated separately.
1. Swing Scenarios in One Line
A large swing scenario starts from an assumption on a big timeframe such as the weekly or daily chart — "we are around wave such-and-such of a large wave right now" — and then maps out several paths in advance: where price can go if that assumption is right and where it can go if it is wrong. In this topic, I'll simply call it a "scenario."
A scenario usually comes with four things attached.
| What you attach | What it means |
|---|---|
| Assumed current position | Pick one position inside the large wave, such as "wave 4 in progress" |
| Several paths | Draw the path for when the assumption is right together with the path you'll switch to if it is wrong |
| Invalidation level | The price where an Elliott rule breaks. Cross it and you erase that assumption |
| Confirmation level | The price where that scenario becomes the likely one |
The last two rows are what matter. A scenario is not a declaration of "price is going there." It is a plan that decides in advance "if price crosses this line, my assumption was wrong." The order in which you actually draw the invalidation and confirmation levels is covered in Part 2.
2. Why Elliott Wave?
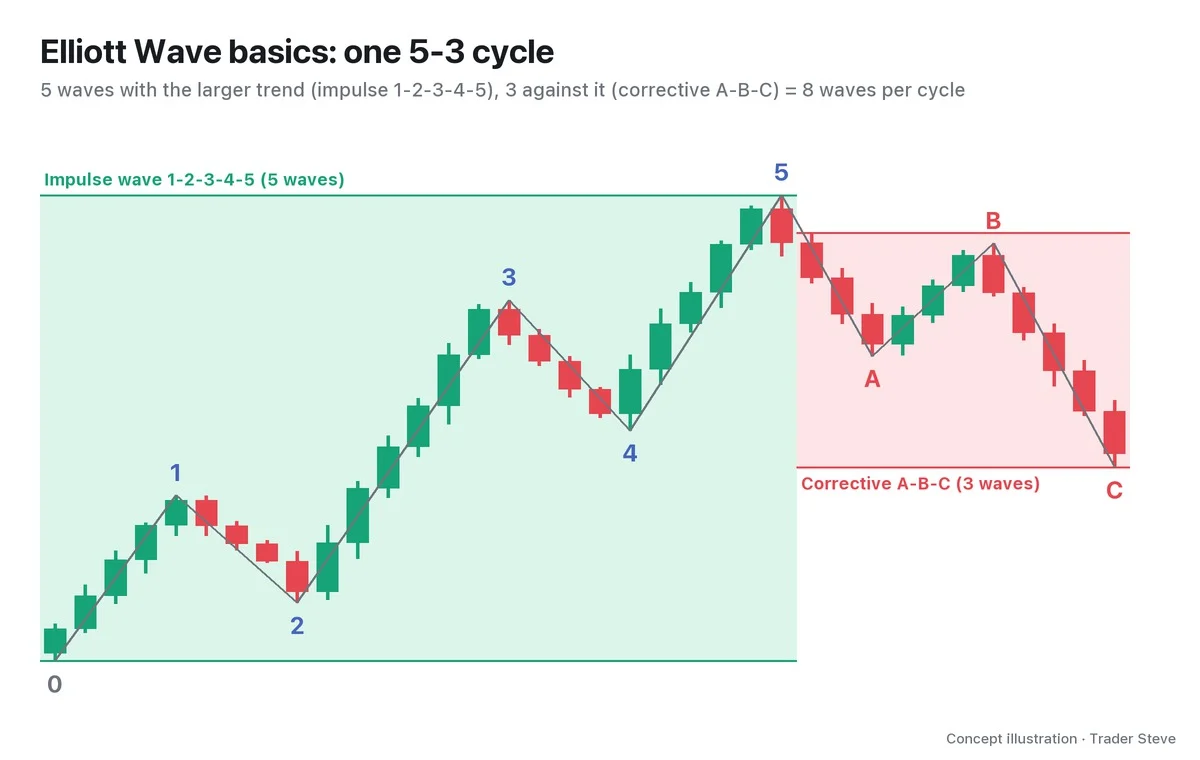
There are plenty of charting tools, but most of them describe "right here, right now." Support and resistance tell you which line price is sitting above; divergence tells you whether momentum has weakened. Elliott Wave, by contrast, describes the order of the next few stages: after wave 3 come waves 4 and 5, and once wave 5 ends an A-B-C correction follows.
"It's not that I don't look at Elliott Wave. I do look at it — as a reference, more or less. And where Elliott really shines is when you try drawing forecast scenarios for big-picture moves in the future. I think Elliott Wave is one of the theories — pretty much the only one, really — that even tries to predict the future." — Trader Steve, live stream, Aug 20, 2026 (translated from Korean) · ▶ Watch the stream highlights (Korean audio)
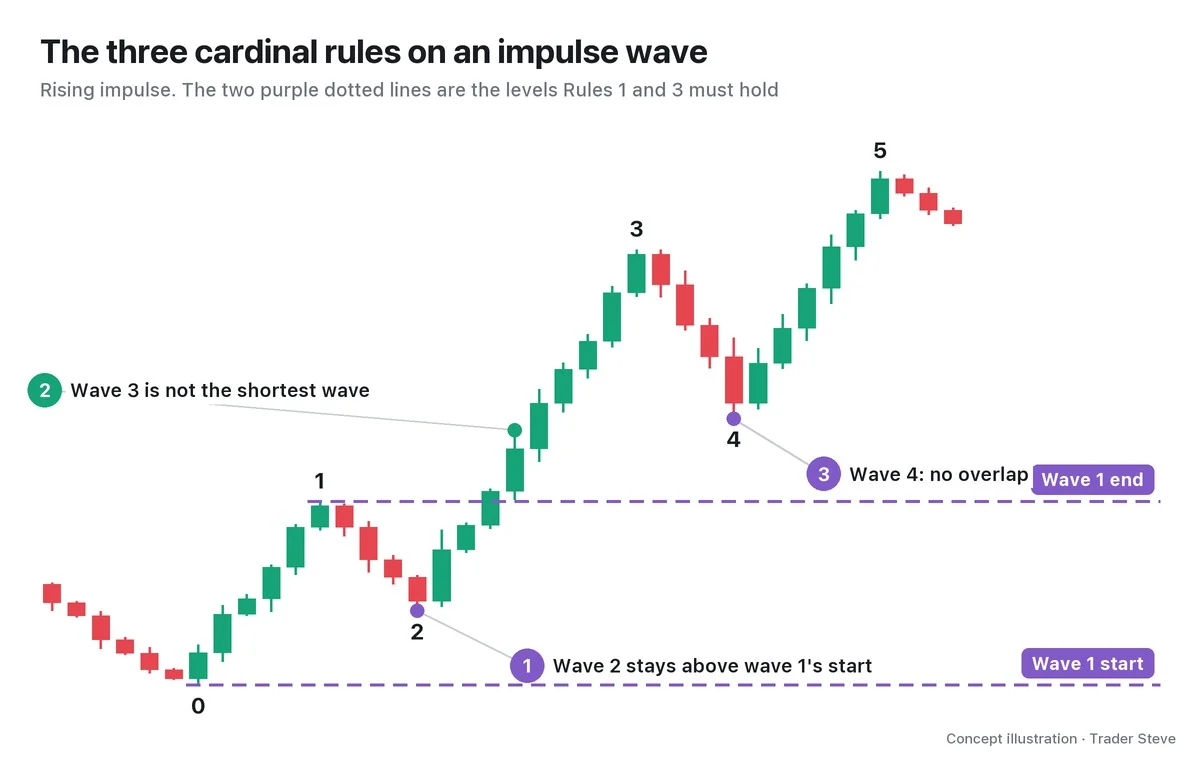
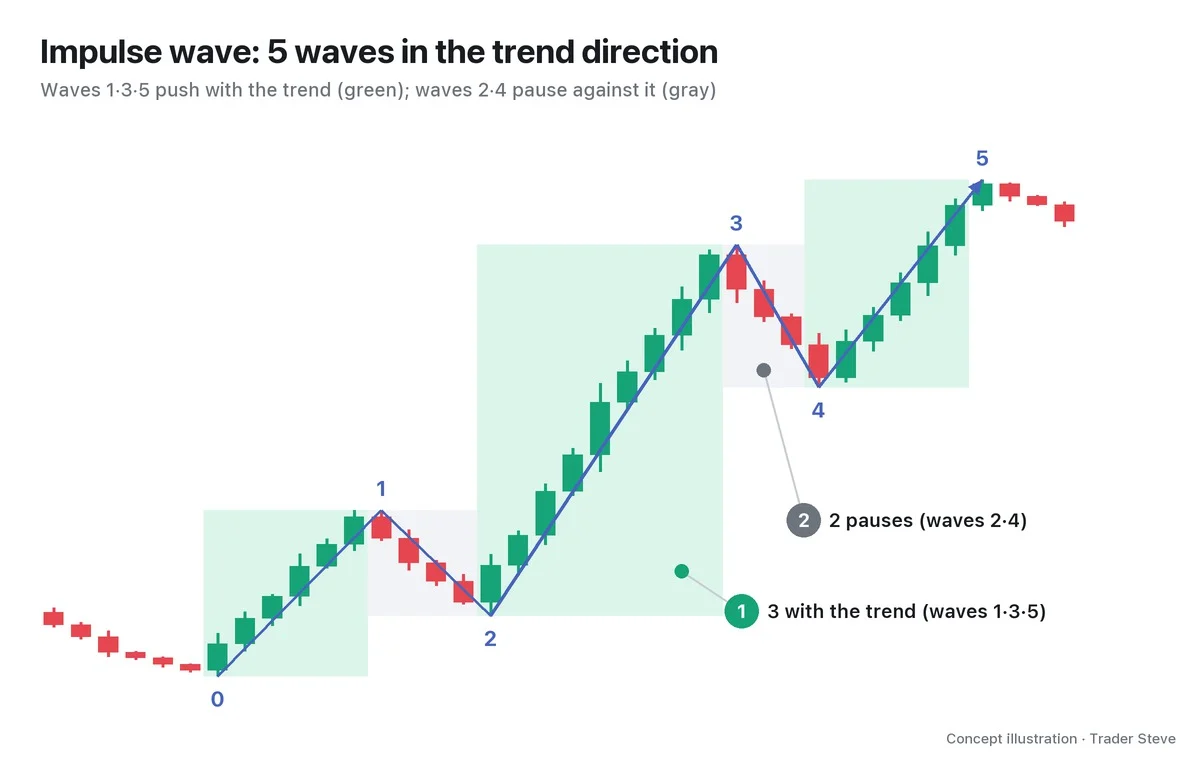
You need that order before you can draw forks in the road. It lets you put names on the stages ahead: "If this is wave 3, a resting wave 4 and one more push up in wave 5 are still to come." The basic structure of five waves up and three waves of rest (5-3) is covered in detail in the elliott/basics topic, and the three cardinal rules the numbers must obey are covered in Elliott Wave Rules and Guidelines (related lesson).
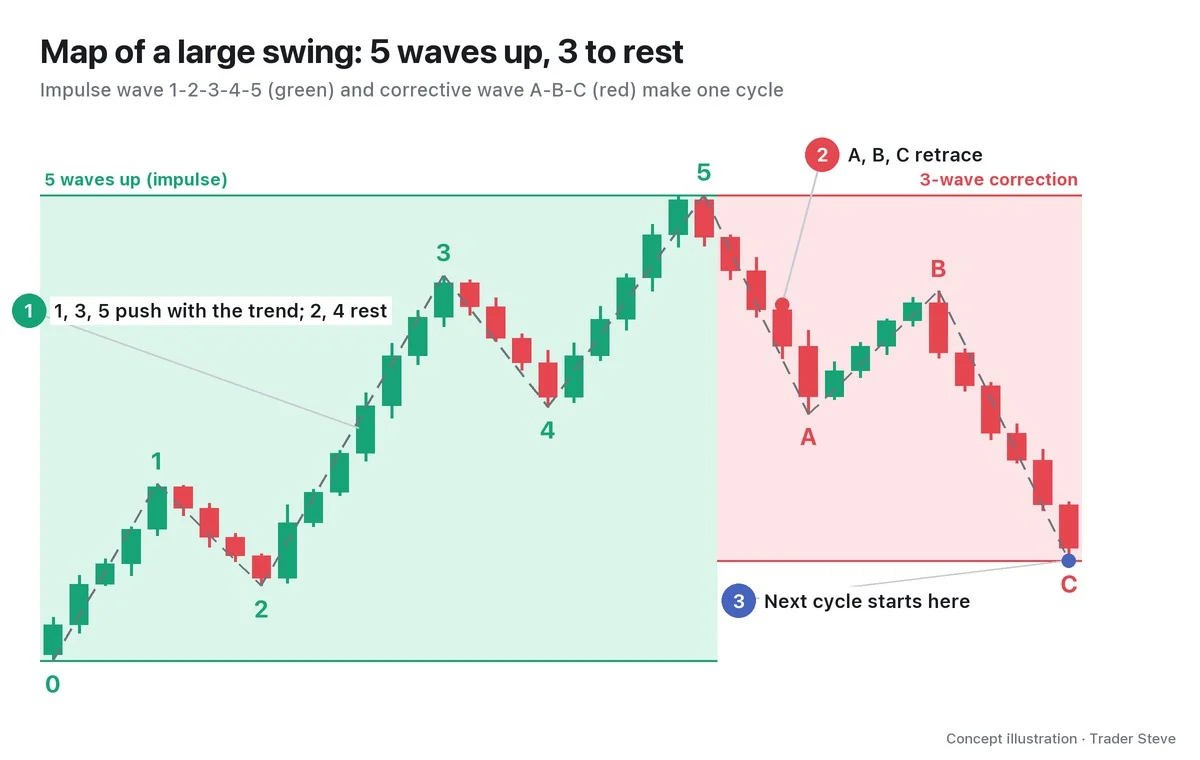
3. A Large Swing = One Turn of the 5-3 Cycle at a Higher Degree
Elliott waves come in layers of different sizes, one inside another. That size is called the wave degree. The formal names run Cycle > Primary > Intermediate > Minor, but in this lesson I'll keep it simple and say "weekly degree," "daily degree" and so on.
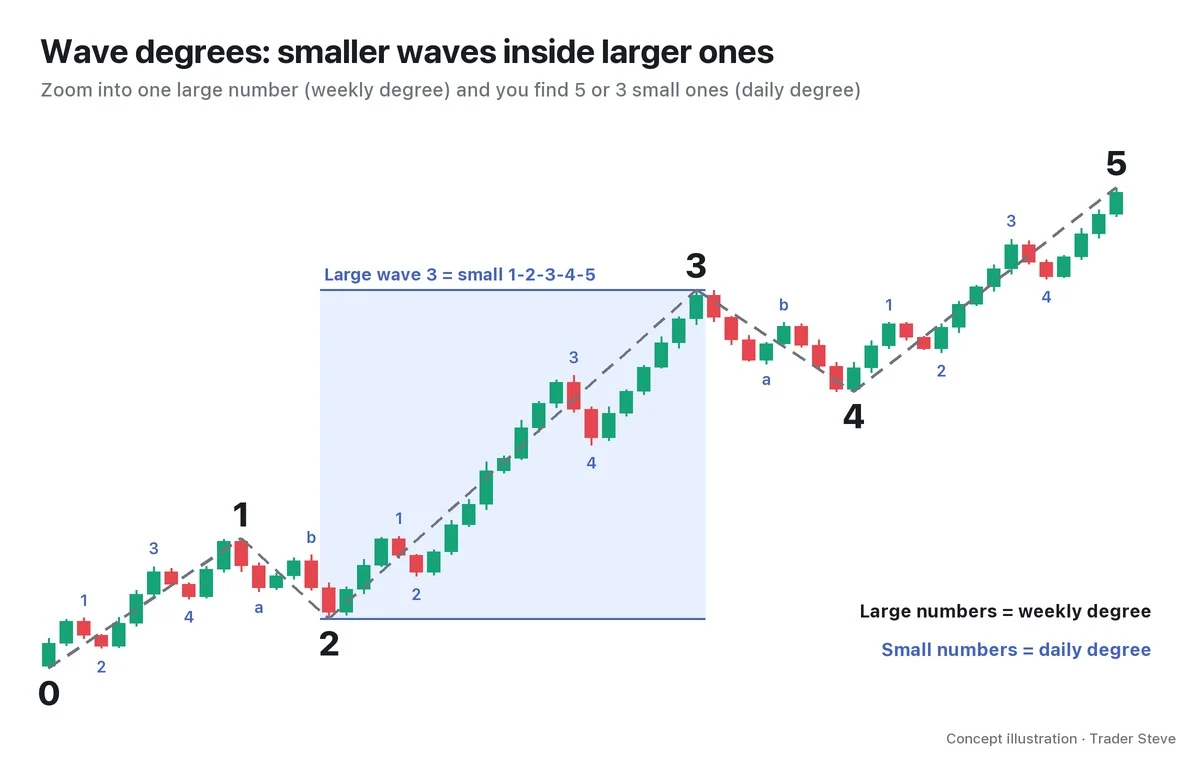
Zoom into a large wave 1, 3 or 5 and you see subwaves 1 to 5 inside it; zoom into a large wave 2 or 4 and you see subwaves a-b-c. That's why the same stretch of chart can put "wave 3 right now" in completely different places depending on the degree you count at.
In this topic, a large swing means one turn of the 5-3 cycle at the weekly or daily degree. You draw the big picture on big candles and look for entries and exits one timeframe lower (top-down analysis in Part 2, entries in Part 3).
4. A Fork in the Road, Not a Prophecy: How I Use Elliott Wave
To be honest, I don't use Elliott Wave as the main basis for my trades. Different people come up with different counts on the same chart, and getting the count right doesn't mean you make money. In the end, Elliott Wave is built on Dow Theory — higher highs and higher lows mean an uptrend, lower highs and lower lows mean a downtrend (the basics/swing-trend topic). Still, when it comes to organizing the big-picture flow, few frameworks come close.
"I'm always saying I don't really like Elliott Wave, but I think Elliott Wave is one of the really good ways to sketch out scenarios on the big picture." — Trader Steve, live stream, Aug 26, 2026 (translated from Korean) · ▶ Watch the stream highlights (Korean audio)
So when I draw a scenario, I never draw just one path.
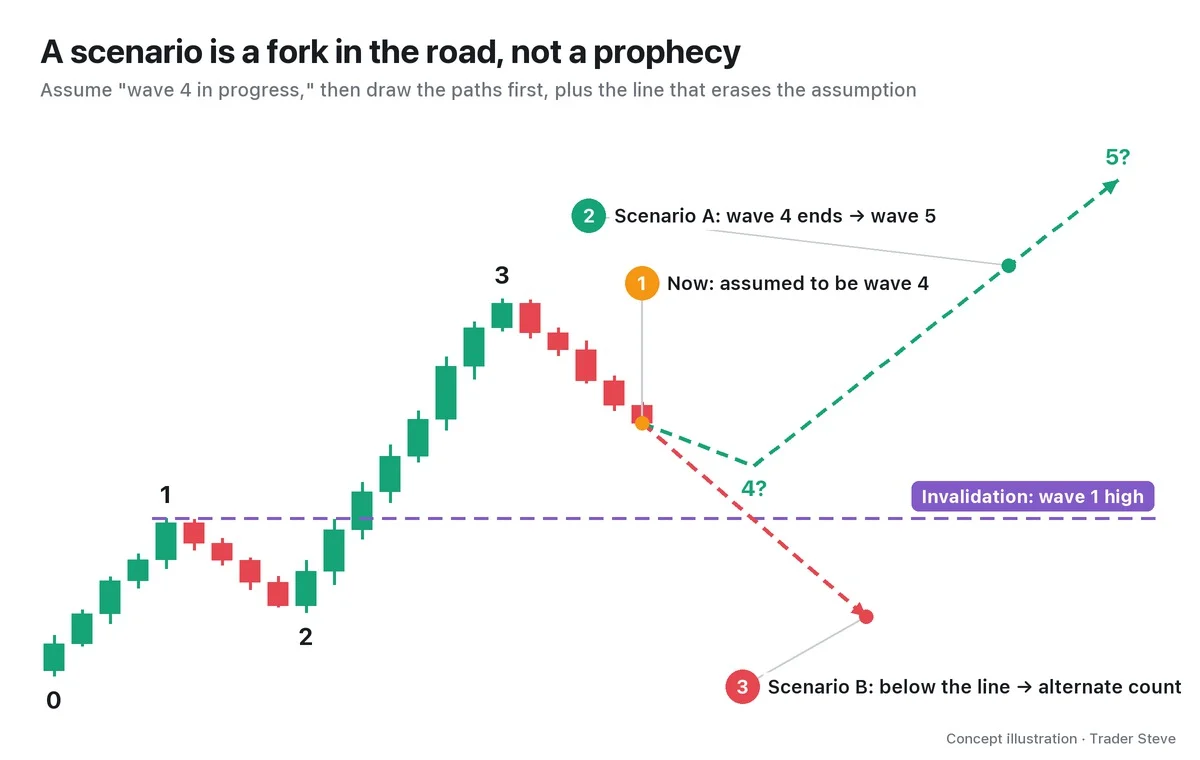
If you assume "we're in wave 4," as in the figure, the rule that wave 4 must not fall below the wave 1 high makes the wave 1 high your invalidation level. If price stops above it and turns back up, you follow Scenario A; if it falls below it, you erase that count and switch to the other count you prepared in advance.
The market decides which path it takes. All I can do ahead of time is decide first which line erases which path. That is what separates a scenario from a prophecy.
5. Real BTC Weekly Chart: One Turn of a 5-Wave Advance and an A-B-C Correction
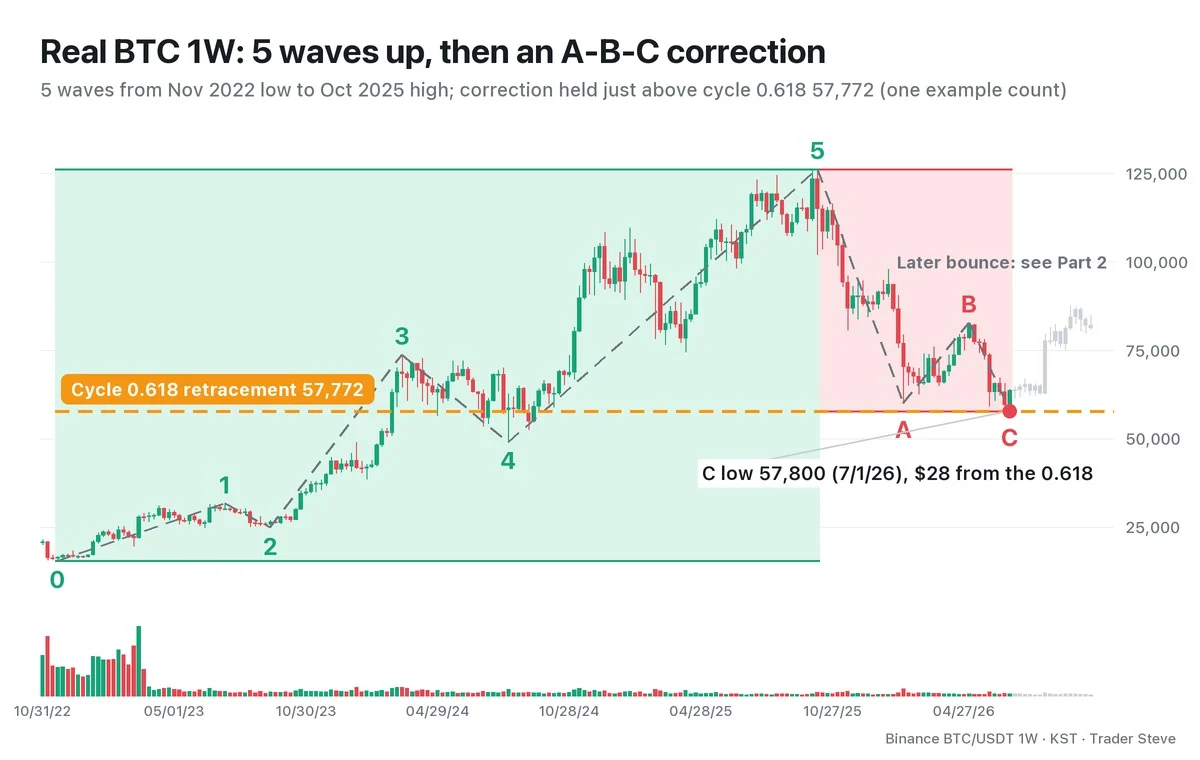
Now let's look at one full turn of a large swing on a real Bitcoin (BTC) weekly chart. The numbers below are one example count; there are other ways to count the same chart.
| Wave | Start → end (date) | Size |
|---|---|---|
| Wave 1 | 15,476 (Nov 21, 2022) → 31,804 (Jul 13, 2023) | 16,328 |
| Wave 2 | → 24,901 (Sep 11, 2023) | retraces 42.3% of wave 1 |
| Wave 3 | → 73,777 (Mar 14, 2024) | 48,876 (2.99x wave 1) |
| Wave 4 | → 49,000 (Aug 5, 2024) | retraces 50.7% of wave 3 |
| Wave 5 | → 126,200 (Oct 6, 2025) | 77,200 (1.58x wave 3) |
Check the three cardinal rules: the wave 2 low (24,901) is above the start of wave 1 (15,476); wave 3 is not the shortest of the three actionary waves (the shortest is wave 1); and the wave 4 low (49,000) is above the wave 1 high (31,804). In this count, wave 5 ran the longest (extensions are covered in the elliott/extension topic).
The 5-wave advance lasted 1,050 days, and the A-B-C correction that followed lasted 268 days. Wave A fell 66,200, from 126,200 to 60,000; wave B retraced 34.5% of that decline, rising to 82,850; then wave C fell another 25,050 to 57,800 (Jul 1, 2026). That is a 54.2% drop from the high.
Pay attention to where the C low sits. The 0.618 retracement of the whole cycle (15,476 → 126,200) is 57,772, and the C low stopped $28 above it.
The full turn drawn this way is the skeleton of the scenario. The bounce after July (the gray candles in the figure) is not counted in this lesson. Part 2 covers the two ways to read it — "the start of a new advance" or "a bounce inside a larger correction" — and the lines that separate the two.
Key Takeaways
- A swing scenario = an assumed current position + several paths + invalidation and confirmation levels.
- Elliott Wave is almost the only framework that describes "the order of the next few stages," which makes it good for drawing forks in the road.
- Treat a large swing as one turn of the 5-3 cycle at the weekly or daily degree, and don't mix it up with the smaller waves and degrees inside it.
- A scenario is not a prophecy. It is a plan that decides first which line erases which path.
- In the example count on the real BTC weekly chart, the C low of the A-B-C correction after the 5-wave advance stopped just above the cycle's 0.618 retracement.
In Part 2, we'll cover the actual order for building a scenario with a preferred count, an alternate count and invalidation levels.
Drawing this map by hand for every market, every time, takes a good deal of time. If you'd like the key levels organized for you every day, take a look at the Omnisight Report below.
This lesson adapts the text, figures and live-stream quotes of the Trader Steve TA series for the web, translated from the original Korean. Check the text and figure captions for the timing and interpretation of each real example, and read conceptual diagrams and real charts separately.
Corrections: support@omnisight.report