What Is an Elliott Wave Triangle? The ABCDE Sideways Correction Explained
Historical examples for learning · not current prices or trade recommendations.
Contents
You'll often see a trend that was moving nicely suddenly turn sideways, with each swing up and down getting smaller. In Elliott Wave theory, the classic form of this kind of zone is called a triangle. This lesson uses four diagrams to explain what a triangle is, where it appears, why it narrows, and where price often goes once it ends.
All dates and times are Korea Standard Time (KST, UTC+9). A daily candle is dated by its 09:00 KST open, and the time shown for an intraday candle is the time that candle opens. The actual intraday time of a high or low is stated separately.
1. The One-Line Definition: A Correction That Turns Five Times and Narrows Sideways
An Elliott Wave triangle is a correction in the middle of a trend in which price turns five times, A-B-C-D-E, while drifting sideways. Elliott Wave splits corrections into two broad families: sharp corrections that drop deep and fast (zigzags), and sideways corrections that spend time instead of price. The triangle belongs to the sideways family, along with flats and combinations.
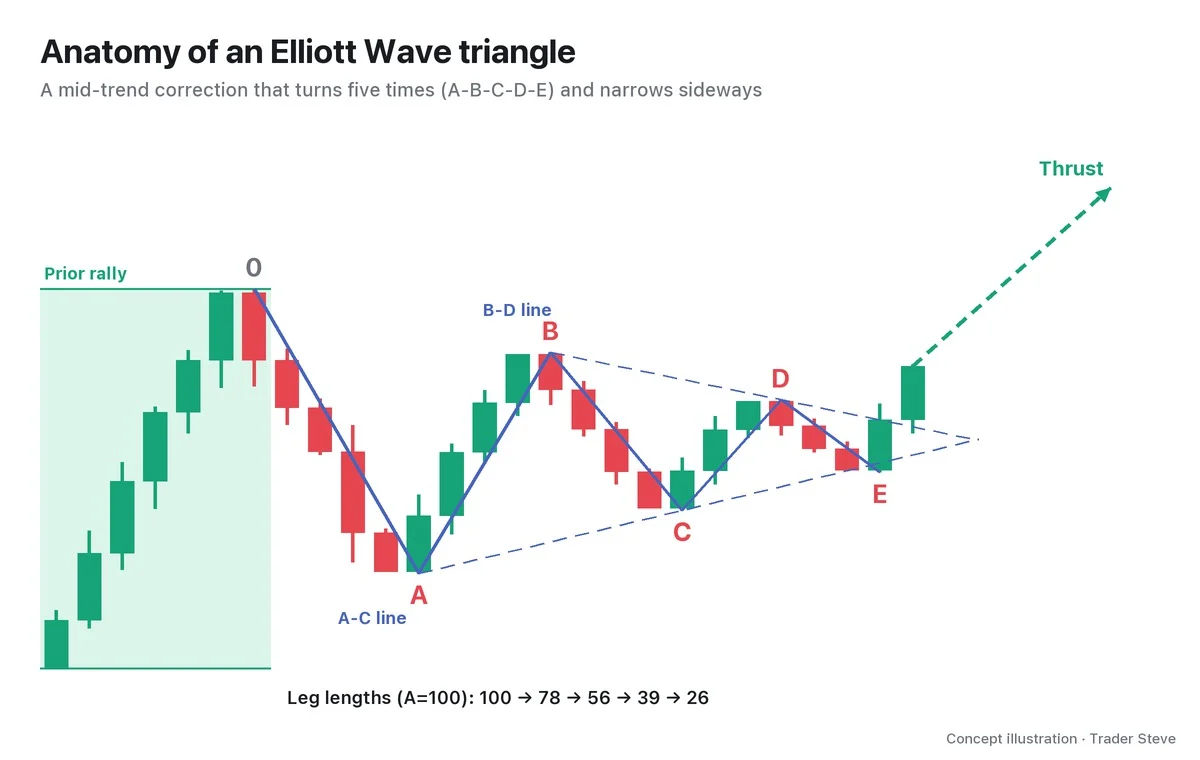
There are three things to see in the diagram.
- Start point 0: the extreme where the prior trend ended. A triangle inside an uptrend starts at a high.
- The five waves A–E: they alternate up and down, and when you compare waves moving in the same direction, C is shorter than A, D is shorter than B, and E is shorter than C. With A set to 100, the five legs in the diagram shrink 100 → 78 → 56 → 39 → 26.
- The two lines: the A-C line joins the lows of A and C, and the B-D line joins the highs of B and D. In the most common shape the two lines converge to the right, and the point where they meet is called the apex.
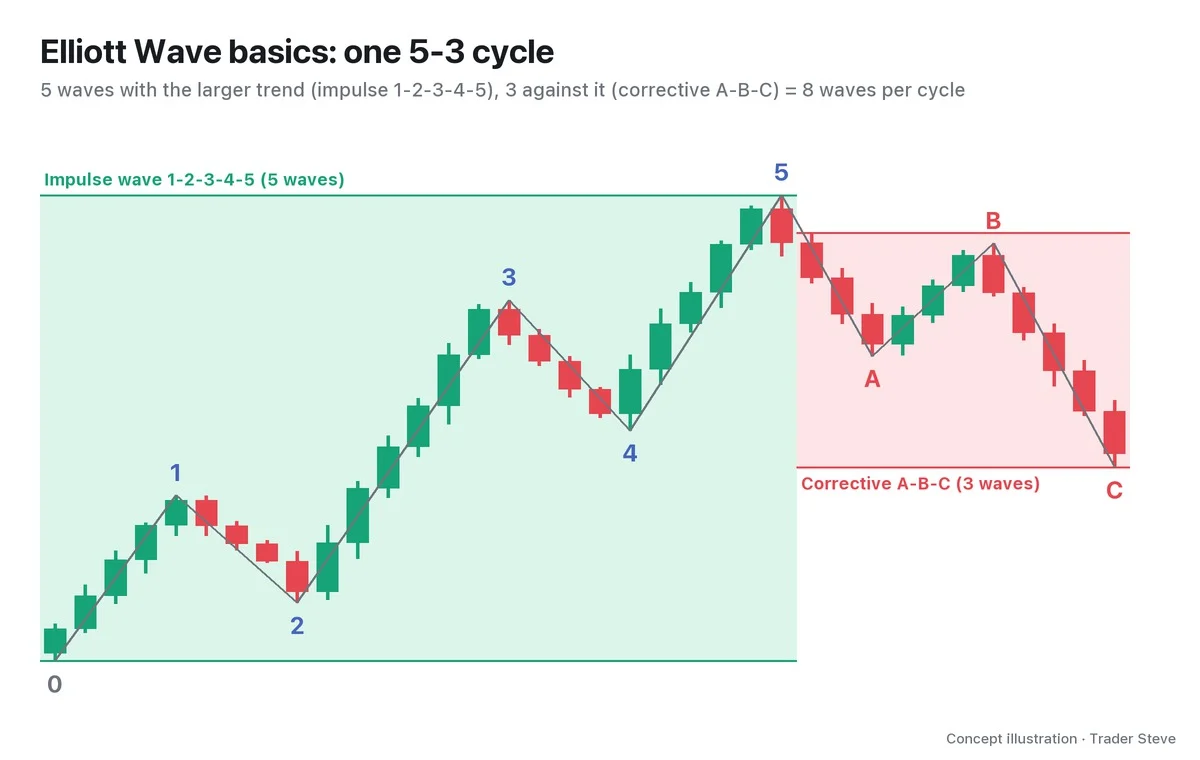
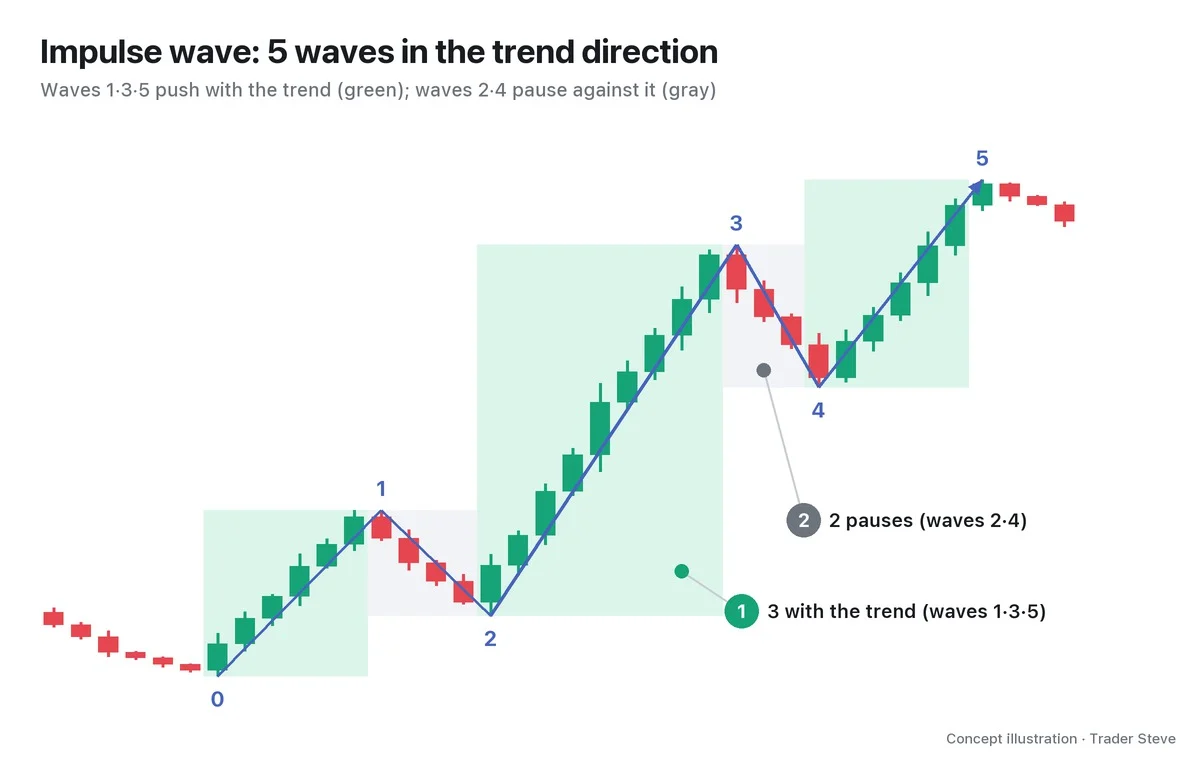
Each of the five waves subdivides into three smaller waves (3-3-3-3-3). An impulse wave pushes forward in 5 waves; here all five waves are "3s," and that is the sign that this zone is a correction, not a trend. If wave degrees and the 5-3 structure are new to you, you may want to read the elliott/basics topic first.
2. Where It Appears: A Pause in the Middle of a Trend
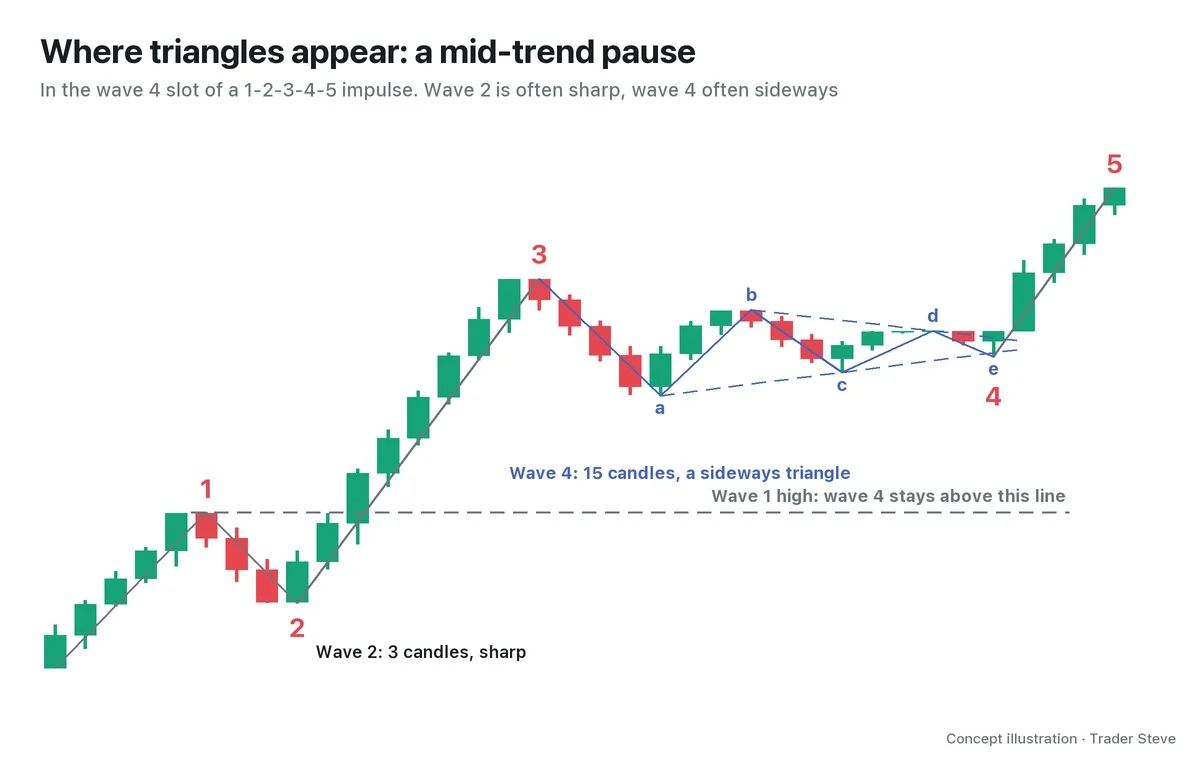
Triangles appear in specific places:
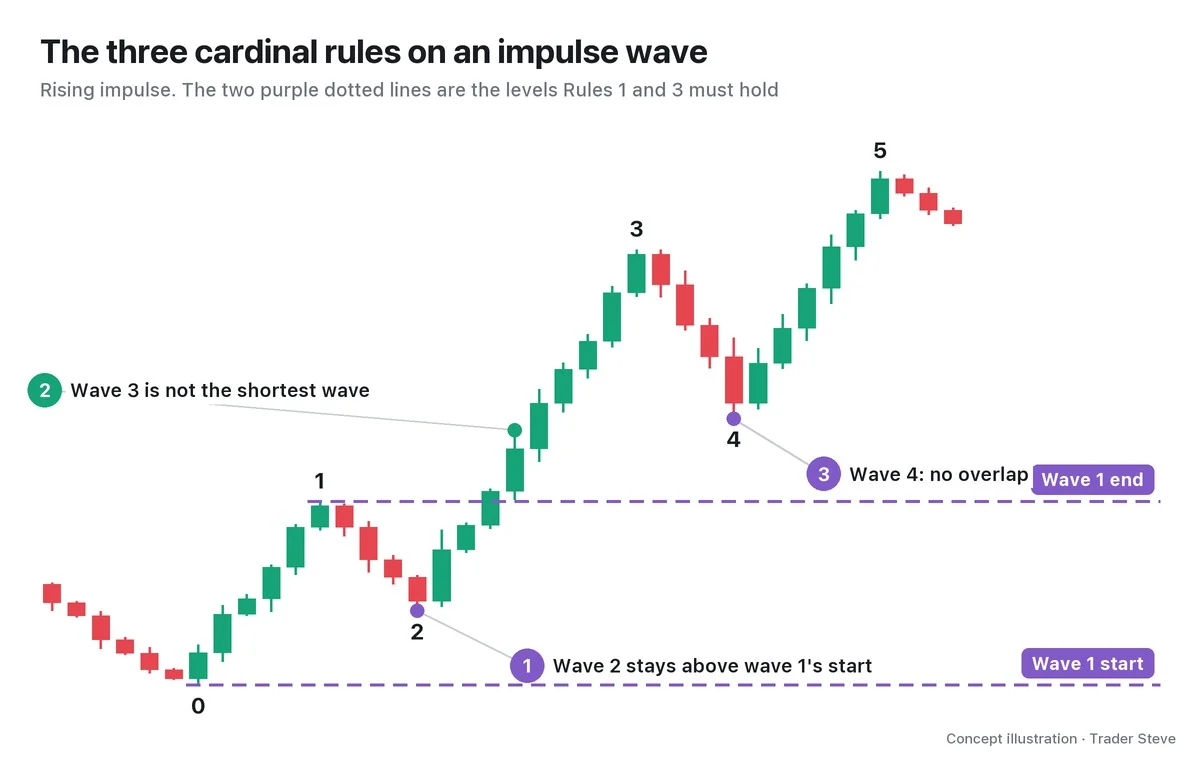
- Wave 4 of an impulse wave
- Wave B of an A-B-C correction such as a zigzag or flat
- Wave X or the final correction of a complex correction that strings several corrections together (a combination)
On the other hand, a triangle never appears on its own as wave 2. What these places have in common is that "one more large move is still to come." That is why a triangle is read as a pause in the middle of a trend rather than a sign that the trend is over.
A triangle in the wave 4 slot also obeys the cardinal rule that "wave 4 does not overlap the territory of wave 1" (the gray dotted line in the diagram). You can read more about the rules in the elliott/rules-guidelines topic, and about why wave 4 tends to go sideways when wave 2 is sharp in the elliott/alternation topic.
3. Why It Narrows, and Where It Goes Once It Ends
After a trend has run for a while, the side that rode it takes some profits, and the other side lacks the strength to push hard. With both buyers and sellers losing conviction, each move gets smaller, and price gets squeezed into a tighter and tighter space as it touches the upper and lower lines. I describe this scene with the chart-pattern word "converging" instead of Elliott terminology.
"Normally, when it converges like this, it either goes in a structure where it lightly taps here, taps, taps…" — Trader Steve, live stream, Aug 31, 2026 (translated from Korean) · ▶ Watch the stream highlights (Korean audio)
The spots where price "taps" the lines are exactly where A, B, C, D and E end. The lines are only approximations, though, so it is common for price to fall short of a line or poke slightly past it and come back. Part 2 covers these variations.
The energy built up while the range narrows is released in one direction after wave E ends. In Elliott Wave, the fast move in the direction of the prior trend that follows a completed triangle is called the thrust. Part 3 covers how to estimate the size of the thrust.
The clue to direction is not the shape of the triangle but the trend that came before it. Something I said while looking at Bitcoin captures this principle exactly.
"In the end it's making lower highs, and it is converging. But this convergence isn't price pushing up hard and then converging — it got slammed down and then started converging, right? In cases like that, the odds of a continuation of the existing downtrend structure are overwhelmingly high." — Trader Steve, live stream, Oct 12, 2026 (translated from Korean) · ▶ Watch this moment (Short, Korean audio)
"Converging after getting slammed down" is a triangle inside a downtrend; "converging after pushing up" is a triangle inside an uptrend. A continuation means the prior trend carries on. But "the odds are high" does not mean "always." Price can also break the other way, or the sideways phase can drag on longer, so real trading needs a confirmation step (Part 3).
4. A Preview of the Three Shapes
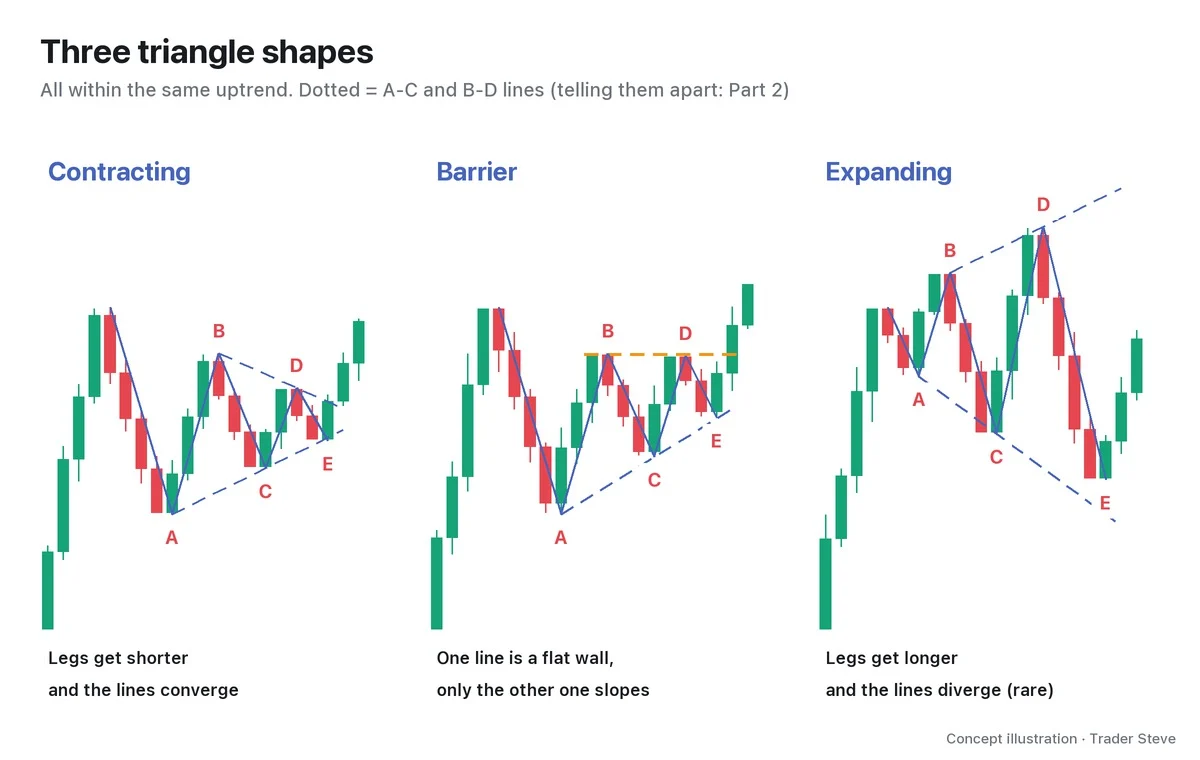
| Shape | Other names | Features |
|---|---|---|
| Contracting triangle | Symmetrical | The legs keep getting shorter and the two lines converge. The most common shape |
| Barrier triangle | Ascending · Descending | A contracting triangle in which B and D are at almost the same price, so the B-D line becomes a flat wall. Inside an uptrend the upper side is flat; inside a downtrend the lower side is flat |
| Expanding triangle | Reverse symmetrical | The legs keep getting longer and the two lines spread apart. Rare |
There is also a variation in which B goes beyond start point 0 (the running triangle). Part 2 sets out the numeric tests that tell the three shapes apart and the order in which to draw them.
5. On a Real Bitcoin Chart
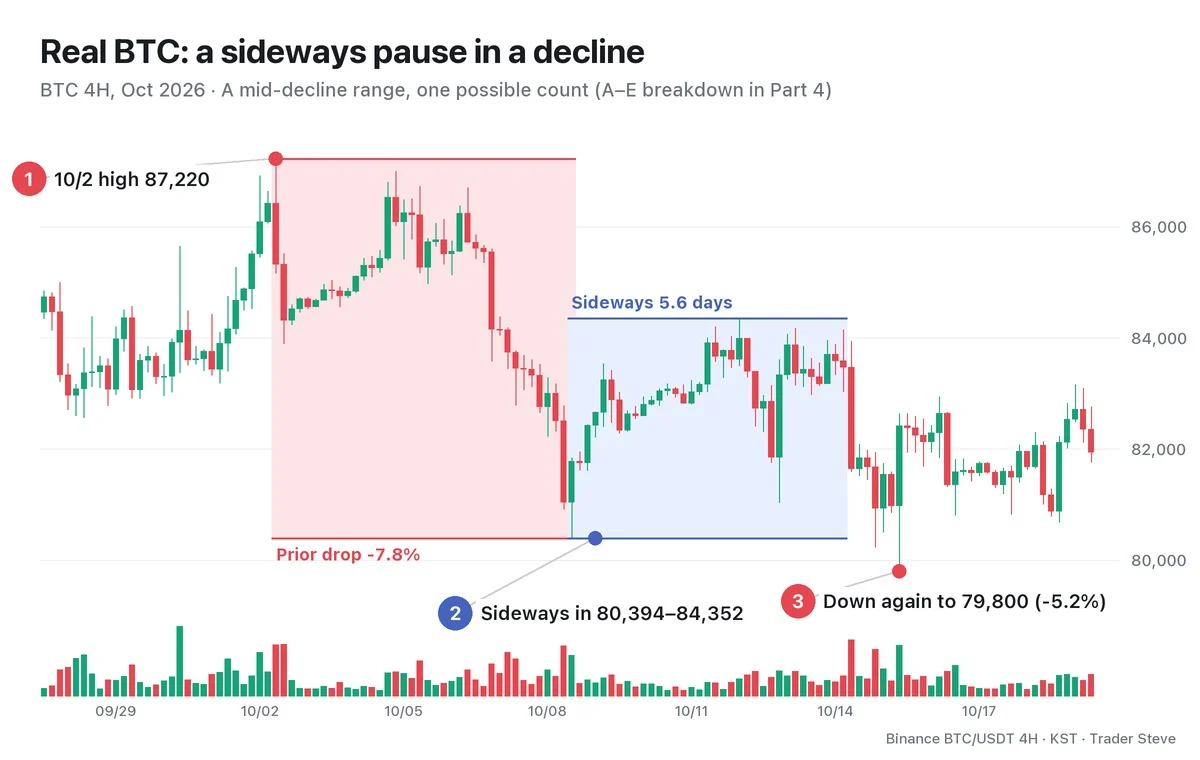
Bitcoin fell $6,826 (7.8%), from 87,220 at 21:00 on Oct 2 to 80,394 in the early hours of Oct 9. It then moved up and down between 80,394 and 84,352 (a 4.9% range) for about 5.6 days, until 17:00 on Oct 14. Price retraced 58% of the prior drop, could not go any higher, and stayed sideways. After leaving the range, price fell 5.2% to 79,800 at 22:00 on Oct 15, 29 hours later, printing below the low where the sideways phase began. Note, though, that no 4-hour candle closed below the range: 79,800 was a wick.
My Oct 12 comment quoted above was made while this very range was forming. Broken down on the 1-hour chart, the range can be counted as an A–E contracting triangle inside a downtrend; Part 4 dissects it and what happened next.
The chart shows one possible count. It looks clean once everything is over, but while it is unfolding it is hard to tell whether you are in C or E, and some traders count the same zone as a different correction. A triangle candidate is "a place where price can resume the original direction," not "a place where price is guaranteed to go that way."
Key Takeaways
- An Elliott Wave triangle is a sideways correction in the middle of a trend that turns five times, A-B-C-D-E, and each wave subdivides into three (3-3-3-3-3).
- It appears in wave 4, wave B, or inside a complex correction, never on its own as wave 2. That makes it "a pause in the middle of a trend."
- Both sides lose conviction, so the swings narrow, and when E ends price often exits in the direction of the prior trend (the thrust).
- The three basic shapes are contracting, barrier and expanding.
- What hints at direction first is the prior trend, not the shape, and a triangle is a place to watch, not a confirmed signal.
In Part 2, we'll cover the numeric tests and checklist for telling contracting, barrier and expanding triangles apart, plus variations such as the running triangle.
Measuring five wave lengths and drawing two lines by hand for every market takes real time. The Omnisight Report organizes this process for each market.
This lesson adapts the text, figures and live-stream quotes of the Trader Steve TA series for the web, translated from the original Korean. Check the text and figure captions for the timing and interpretation of each real example, and read conceptual diagrams and real charts separately.
Corrections: support@omnisight.report