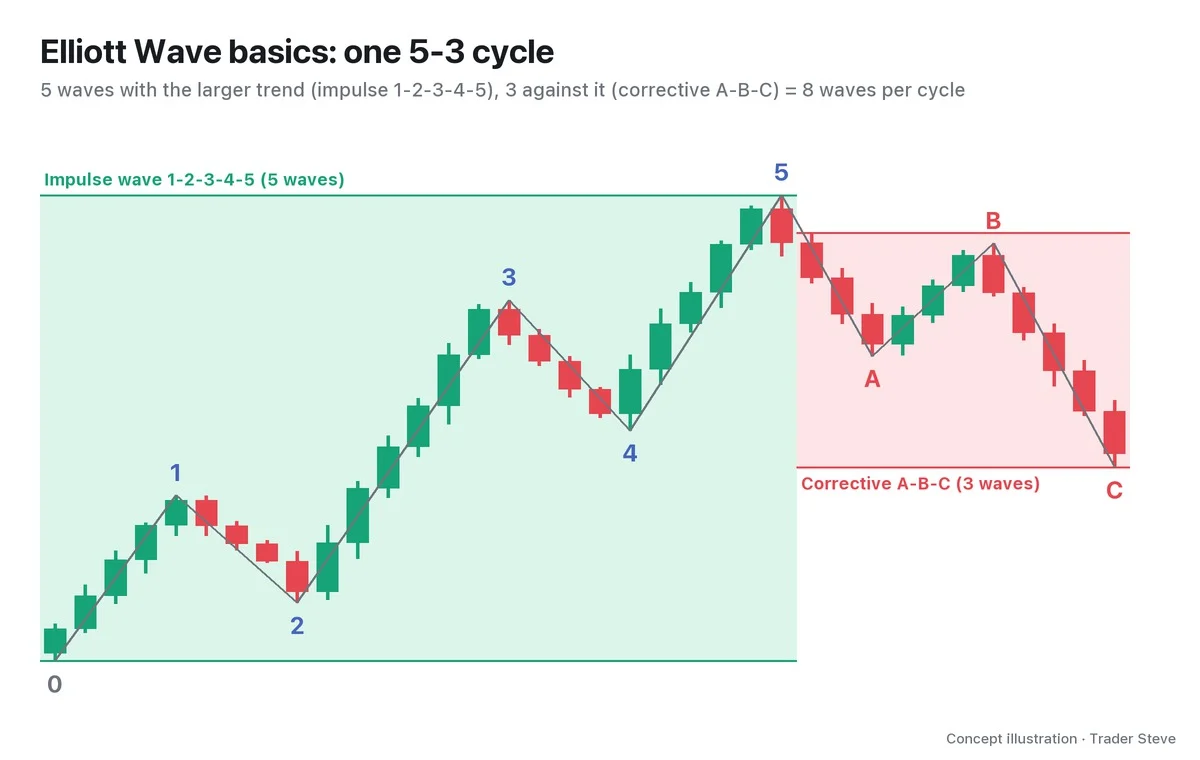
What Is Elliott Wave Truncation? Why Wave 5 Fails to Clear Wave 3
Historical examples for learning · not current prices or trade recommendations.
Contents
When you count Elliott waves, sooner or later you'll wait for wave 5 to "obviously" clear the wave 3 high, only to watch it turn down below that high. This is called truncation. This lesson uses diagrams and a real Bitcoin (BTC) chart to explain what truncation is, why it happens and what traces it leaves on a chart.
All dates and times are Korea Standard Time (KST, UTC+9). A daily candle is dated by its 09:00 KST open, and the time shown for an intraday candle is the time that candle opens. The actual intraday time of a high or low is stated separately.
1. The One-Line Definition: Wave 5 Ends Without Passing the End of Wave 3
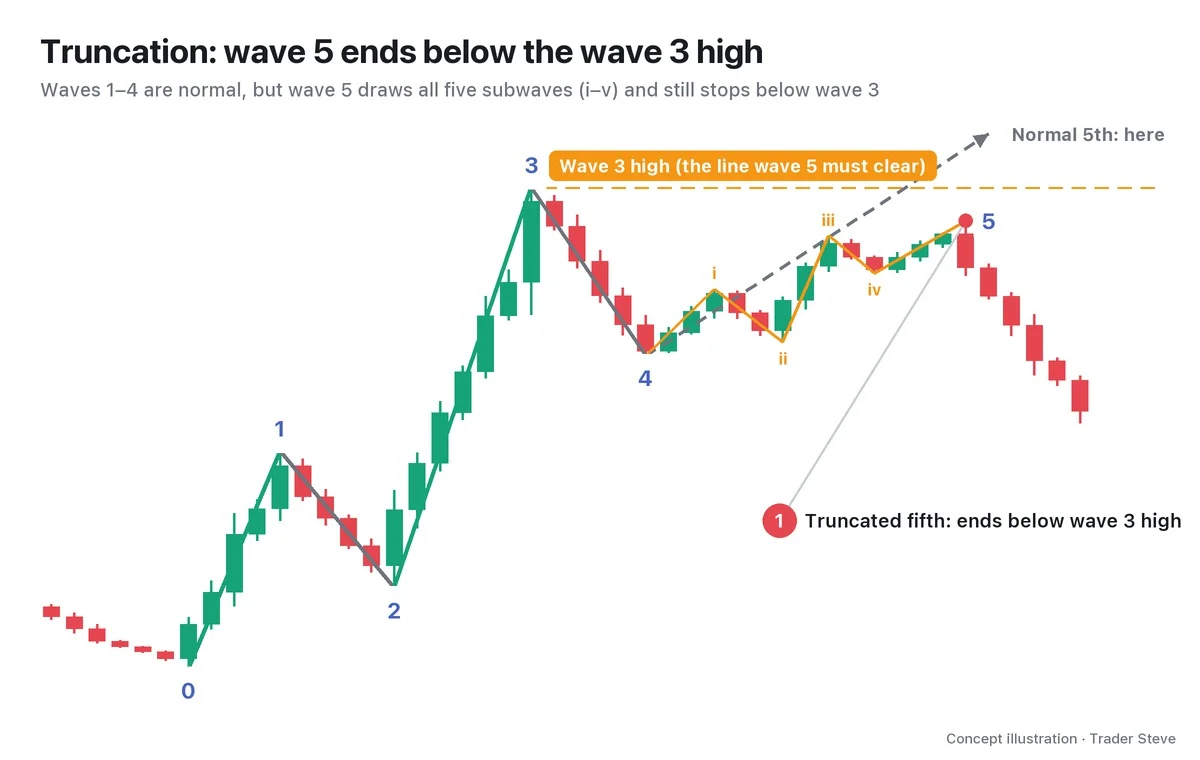
Truncation is when wave 5 of an impulse wave completes five smaller waves inside itself, yet ends without getting past the end of wave 3.
The same thing goes by several names:
- Truncation: the name for the phenomenon as a whole
- Truncated fifth: the wave 5 that ended this way
- Failed fifth: the same thing, meaning wave 5 "failed" to get past the end of wave 3
In this lesson I'll stick with "truncated fifth." To call something a truncation, three conditions must all be present:
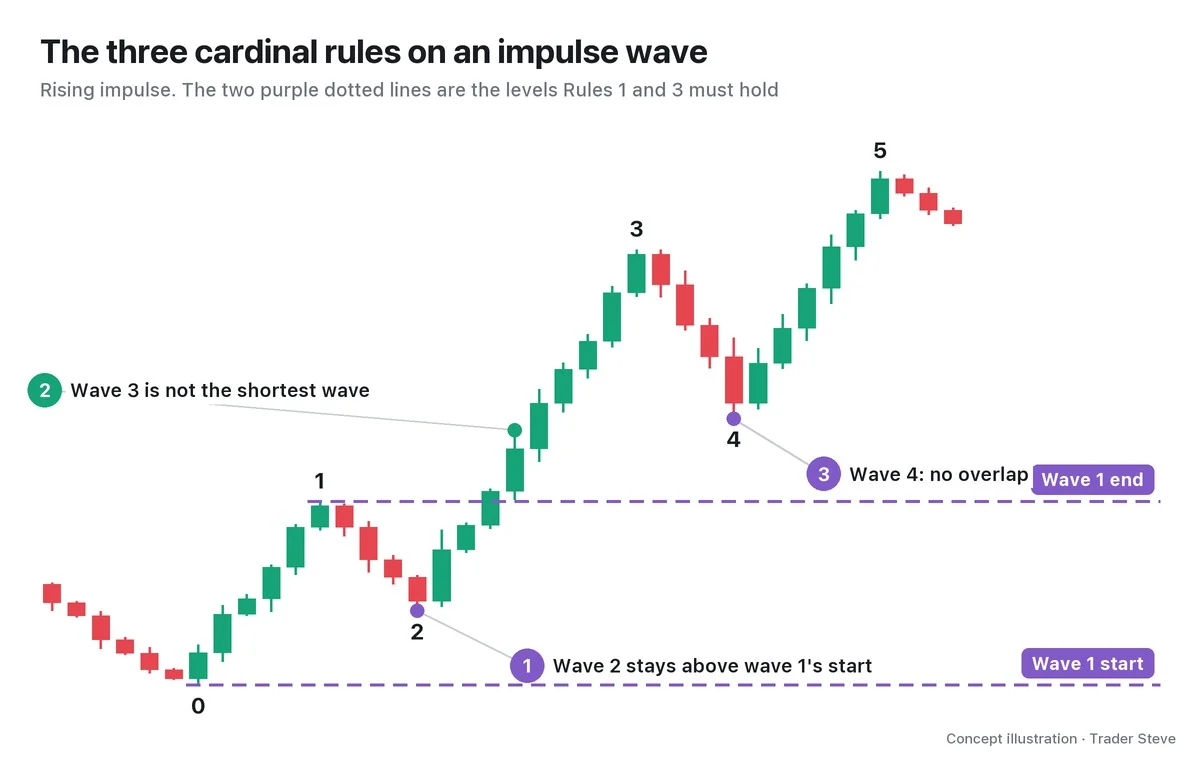
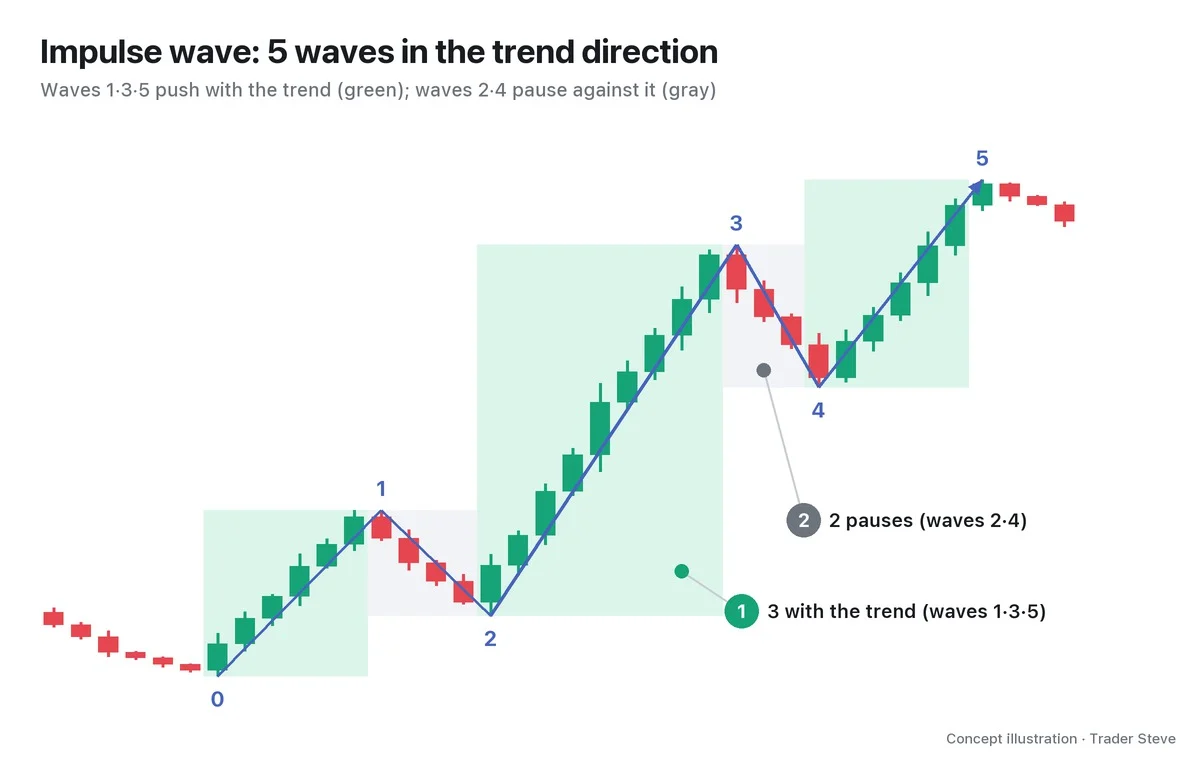
- Waves 1–4 obey the impulse-wave rules: wave 2 does not go beyond the start of wave 1, wave 3 is not the shortest, and wave 4 does not enter wave 1's territory (the reasons behind these rules are covered in the lesson on Elliott's three cardinal rules).
- The end of wave 5 does not get past the end of wave 3: in a rising impulse the high is lower; in a falling impulse the low is higher.
- Wave 5 contains five smaller waves (i–v): without them, it isn't a truncation. Wave 4 may still be in progress, or the structure may be something else entirely.
The opposite case, where wave 5 runs well past the end of wave 3 and stretches out, is called an extension. It helps to remember truncation as the mirror image of an extension.
2. Bullish and Bearish Truncation
Truncation comes in two forms depending on direction. For a falling impulse wave, just flip everything upside down.
| Type | End of wave 5 | Shape left on the chart |
|---|---|---|
| Bullish truncation | a high lower than the wave 3 high | something like a double top |
| Bearish truncation | a low higher than the wave 3 low | something like a double bottom |
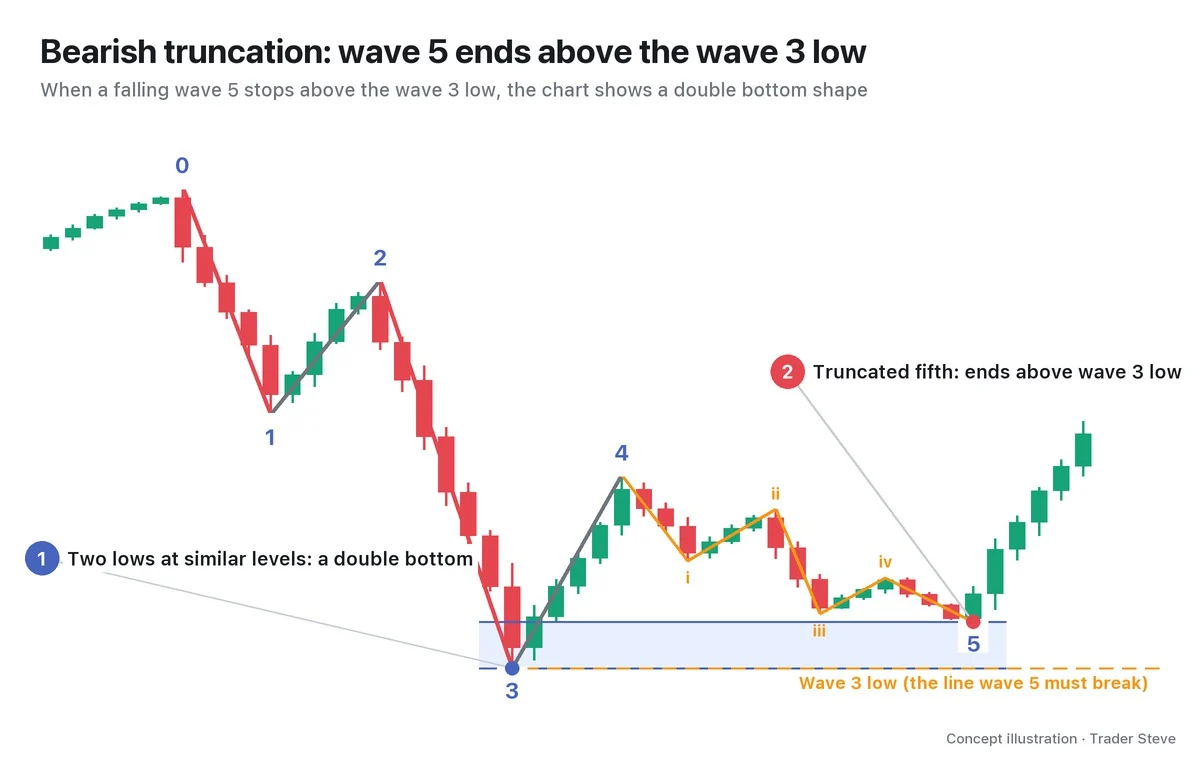
So taken on its own, a truncation looks like an ordinary double top or double bottom. The difference is whether waves 1–4 built up by the rules before it, and whether five smaller waves led into the second peak or trough. Part 2 walks through how to tell them apart, step by step.
3. Why It Happens: A Wave 5 That Has Run Out of Steam
The reasons wave 5 can't reach the end of wave 3 are usually explained in three ways.
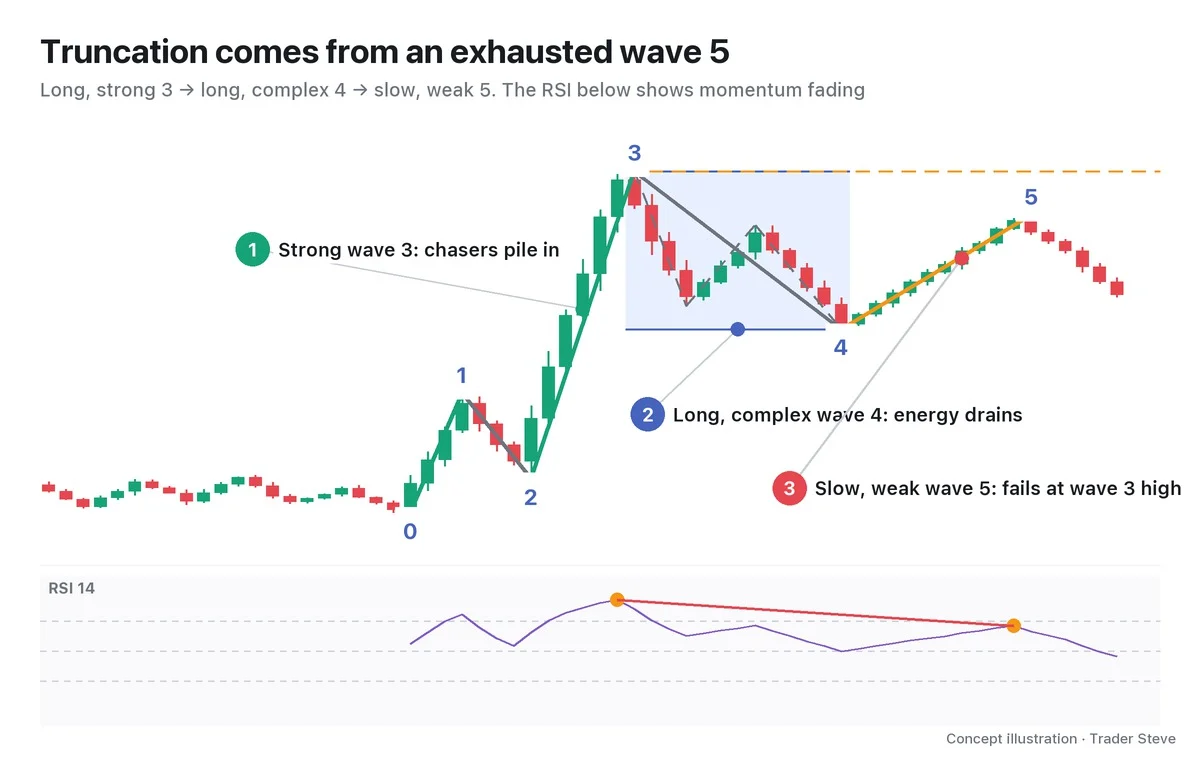
- Wave 3 was unusually strong or long: when chase buying floods in all at once during wave 3, everyone who would have bought later is already in. In wave 5 there isn't enough new money to push price higher.
- Wave 4 was long and complex: when wave 4 drags sideways for a long time, early buyers take their profits and leave, and those waiting on the sidelines grow tired. Wave 5 starts out in that drained mood.
- Momentum is already weak in wave 5: price is rising, but the speed and strength of the rise are visibly weaker than in wave 3. Momentum indicators such as the Relative Strength Index (RSI) often read lower than they did in wave 3.
In short, truncation is the trace left when "the money to carry wave 5 all the way never came in." Waves don't set price; the result of money draining out is what's left behind in the shape of the waves.
4. What Truncation Tells You: The Trend Is Weak
Once a truncated fifth is confirmed, read it as a sign that the move in that direction was weaker than expected. That's why the move that follows in the opposite direction is often fast and deep. Still, that's "often," not "always."
Another important point: even if wave 5 seems to have stopped short of the end of wave 3, at that moment it is only a "truncation candidate." If wave 5 regains strength and gets past the end of wave 3, it simply becomes a normal wave 5. You can only say it's over once evidence builds as the 2-4 trendline (the line connecting the ends of waves 2 and 4), the end of wave 4 and the end of wave 1 break in turn. Part 2 looks at the confirmation sequence in detail.
Let's check the shape on a real Bitcoin chart. Below is one possible count placed on the BTC 4-hour chart for May–June 2026.
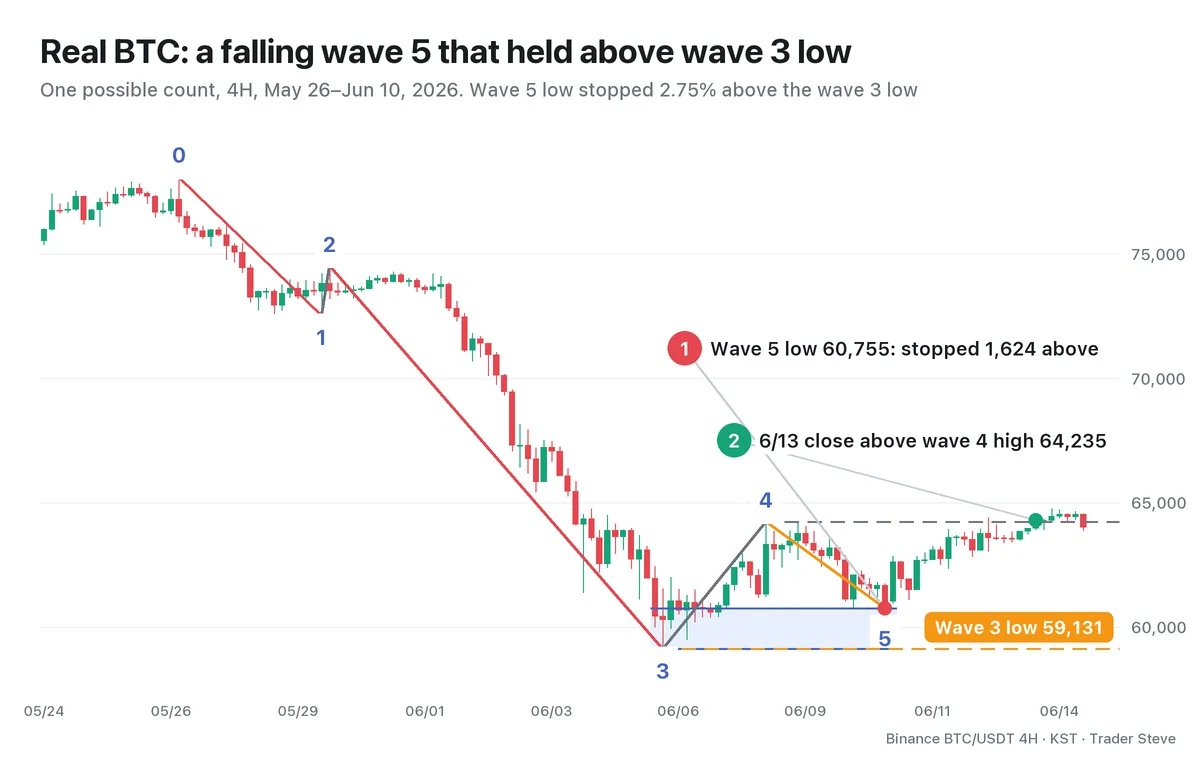
- Wave 1: May 26 78,080 → May 29 72,512 (a 5,568 drop)
- Wave 3: May 30 74,514 → Jun 6 59,131 (a 15,383 drop, the longest wave)
- Wave 4: a bounce to 64,235 on Jun 8. It stayed below the end of wave 1 at 72,512, so it does not overlap wave 1's territory.
- Wave 5: 60,755 on Jun 10. The drop was 3,480, shorter even than wave 1, and it failed to break the wave 3 low.
That said, the 4-hour chart alone makes it hard to confirm the five smaller waves inside wave 5. That check has to be done separately on a lower timeframe, and Part 2 covers how.
At this wave 5 low, the RSI (14) read 38.7, higher than the 21.1 it showed at the wave 3 low. Price came back down, but the selling pressure behind the decline had already eased. Afterward, the Jun 13 21:00 candle closed above the wave 4 high.
To be honest, this bounce didn't last long either. On Jun 25 price fell to 58,115, back below this wave 3 low. Truncation is only a signal that "wave 5 of that degree ended out of steam"; it does not guarantee a bottom.
5. How I Look at Elliott Wave
I don't use Elliott Wave as the main basis for my trades. The very concept of truncation shows why.
"Something like Elliott Wave is whatever you make of it… If it gets cut off partway, it's a truncation. You're not supposed to break into a certain zone, but there's this exception. It's the kind of theory that always has exceptions, exceptions, exceptions, so…" — Trader Steve, live stream, Aug 20, 2026 (translated from Korean) · ▶ Watch the stream highlights (Korean audio)
If you expect "wave 5 will clear the wave 3 high" and it doesn't, you can just call it "truncation" and move on, so after the fact you can explain anything. That's why, when you study truncation, it's important to apply the conditions strictly. If you don't check the rules, the five subwaves and the confirmation signals, every double top will start to look like a truncation.
Even so, there's a reason I don't throw Elliott Wave away.
"Where Elliott really shines is when you sketch out a forecast scenario for the big-picture move… I think it's one of the very few theories that actually tries to forecast the future." — Trader Steve, live stream, Aug 20, 2026 (translated from Korean) · ▶ Watch the stream highlights (Korean audio)
Truncation is useful exactly when you build that kind of "scenario." If wave 5 gets past the end of wave 3, it's a normal wave 5; if it falls short and breaks the lines below, it's a truncation. You draw both branches in advance and watch which way the evidence builds.
Key Takeaways
- Truncation is when wave 5 completes five smaller waves yet ends without getting past the end of wave 3. It's also called a truncated fifth or a failed fifth.
- A bullish truncation leaves something like a double top; a bearish truncation leaves something like a double bottom.
- It tends to appear when a strong wave 3, a long and complex wave 4 and fading momentum come together.
- It signals that the trend is weak, but before confirmation it is only a "candidate," and even after confirmation it does not guarantee a bottom or a top.
- Elliott Wave is a theory with many exceptions, so apply the conditions strictly and use it as a tool for big-picture scenarios.
In Part 2, we'll cover a four-step checklist for identifying a truncated fifth and how to confirm it with the 2-4 trendline.
Doing these counts and checks by hand for every market takes a fair amount of time. If you'd like to receive results that put Elliott Wave counts together with other perspectives, take a look at the Omnisight Report below.
This lesson adapts the text, figures and live-stream quotes of the Trader Steve TA series for the web, translated from the original Korean. Check the text and figure captions for the timing and interpretation of each real example, and read conceptual diagrams and real charts separately.
Corrections: support@omnisight.report