What Is Wave Personality? The Faces of Waves 1–5 and A-B-C
Historical examples for learning · not current prices or trade recommendations.
Contents
Instead of memorizing wave numbers, learn how each wave behaves. Once you know that, it gets much easier to judge which stage of the cycle a chart is closest to. This yardstick is called wave personality. This lesson uses diagrams to lay out the faces of impulse waves 1–5 and corrective waves A, B and C.
All dates and times are Korea Standard Time (KST, UTC+9). A daily candle is dated by its 09:00 KST open, and the time shown for an intraday candle is the time that candle opens. The actual intraday time of a high or low is stated separately.
1. Same Chart, Different Numbers: Why Look at Personality
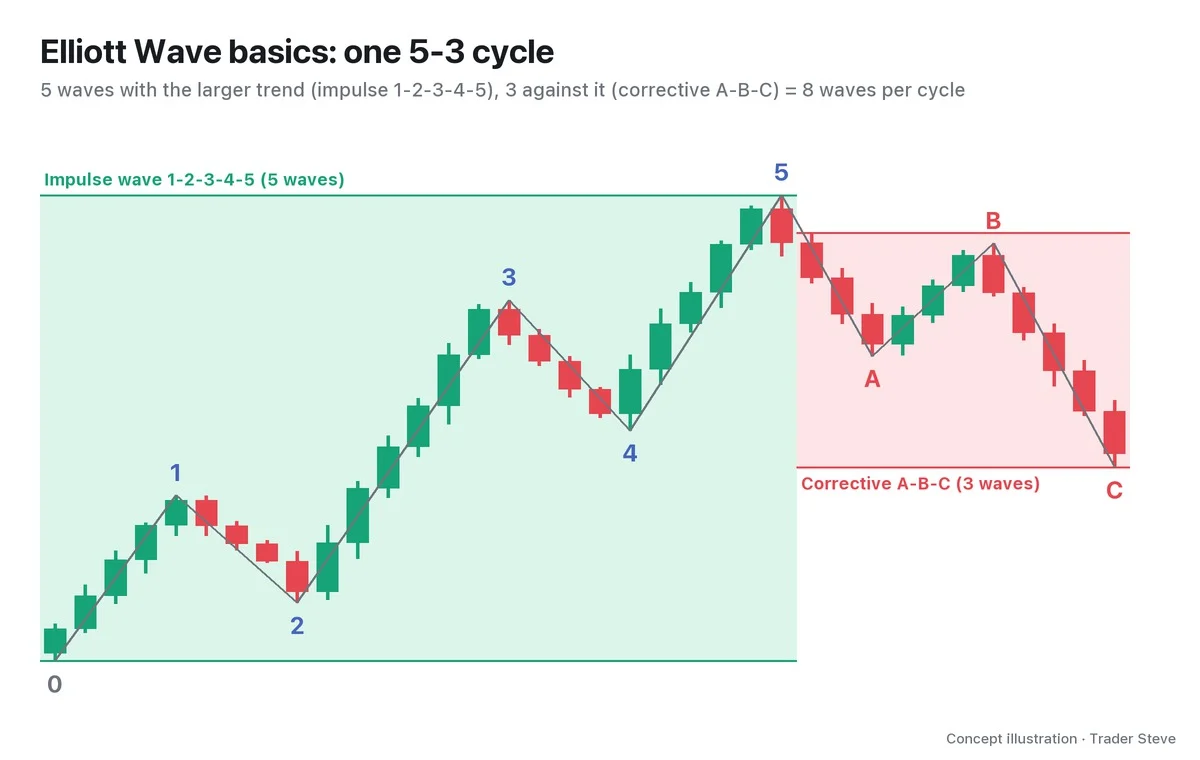
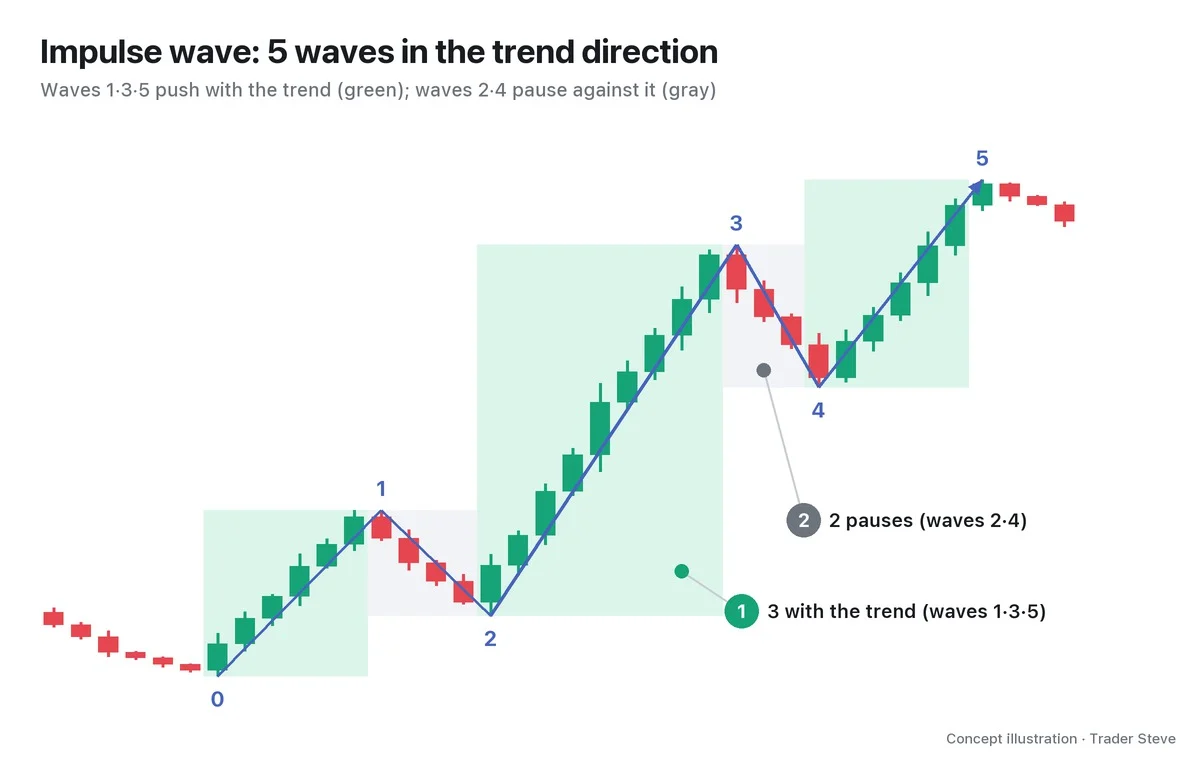
Elliott Wave is the theory that five waves up (the impulse wave) and three waves down (the corrective wave) make up one complete cycle (the 5-3 structure is covered in elliott/basics). The problem is that deciding "which wave are we in right now" is far more subjective than it looks.
"With Elliott, it's whatever you make of it. Someone says wave 3, someone wave 4, someone wave 5, someone says leek, someone says scallion. Once it's all over and you're interpreting it, people just go wherever they like." — Trader Steve, live stream, Oct 13, 2026 (translated from Korean) · ▶ Watch the stream highlights (Korean audio)
(The joke works in Korean, where the word for "wave" also means "green onion.")
On the live stream, I'm always this wary of Elliott Wave, because arguing over numbers alone never ends. That's why A. J. Frost and Robert Prechter's Elliott Wave Principle also tells you to look, separately from the numbers, at "how this wave moves": its length and slope, how deep it retraces, how long it takes, its volume, its momentum (for example the Relative Strength Index, RSI), and the mood of the market. When a wave count splits two ways, this yardstick helps you pick the one whose personality fits better as the preferred count.
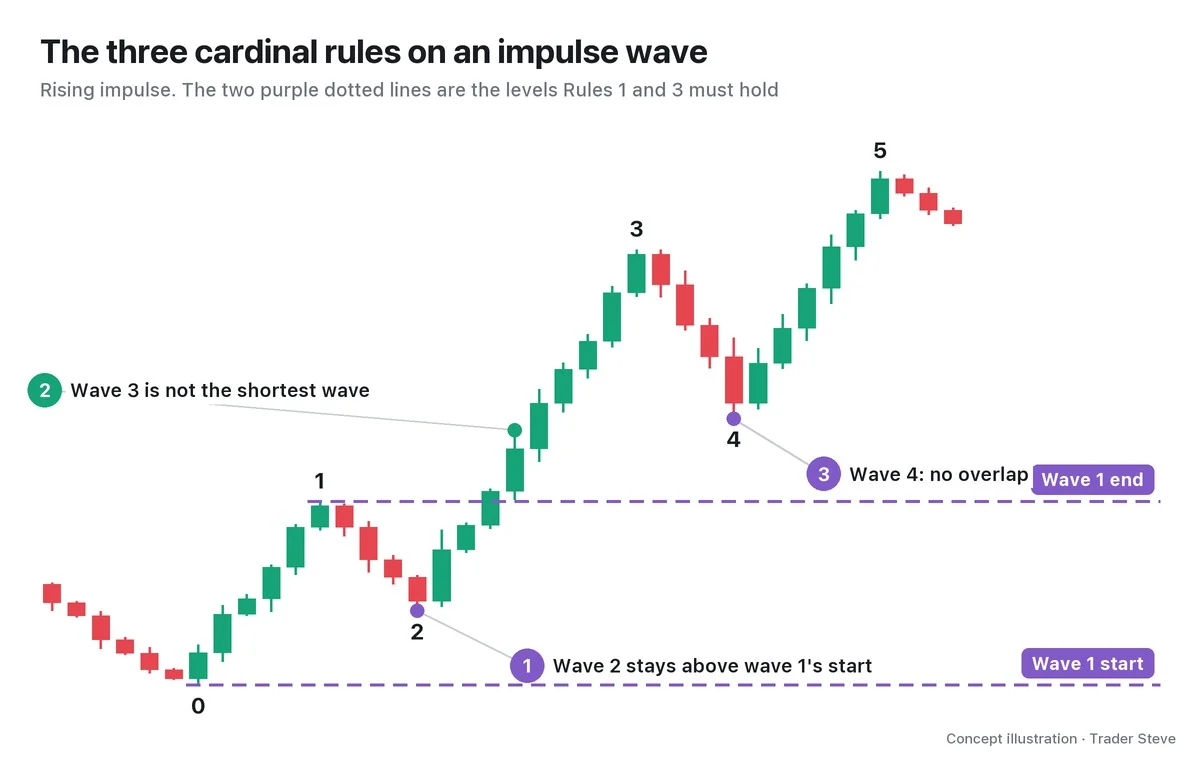
Keep in mind that personality is a tendency, not a rule. The three cardinal rules — break one and the count is wrong — are covered in Elliott Wave Rules and Guidelines (related lesson).
2. The Personality of Impulse Waves 1–5
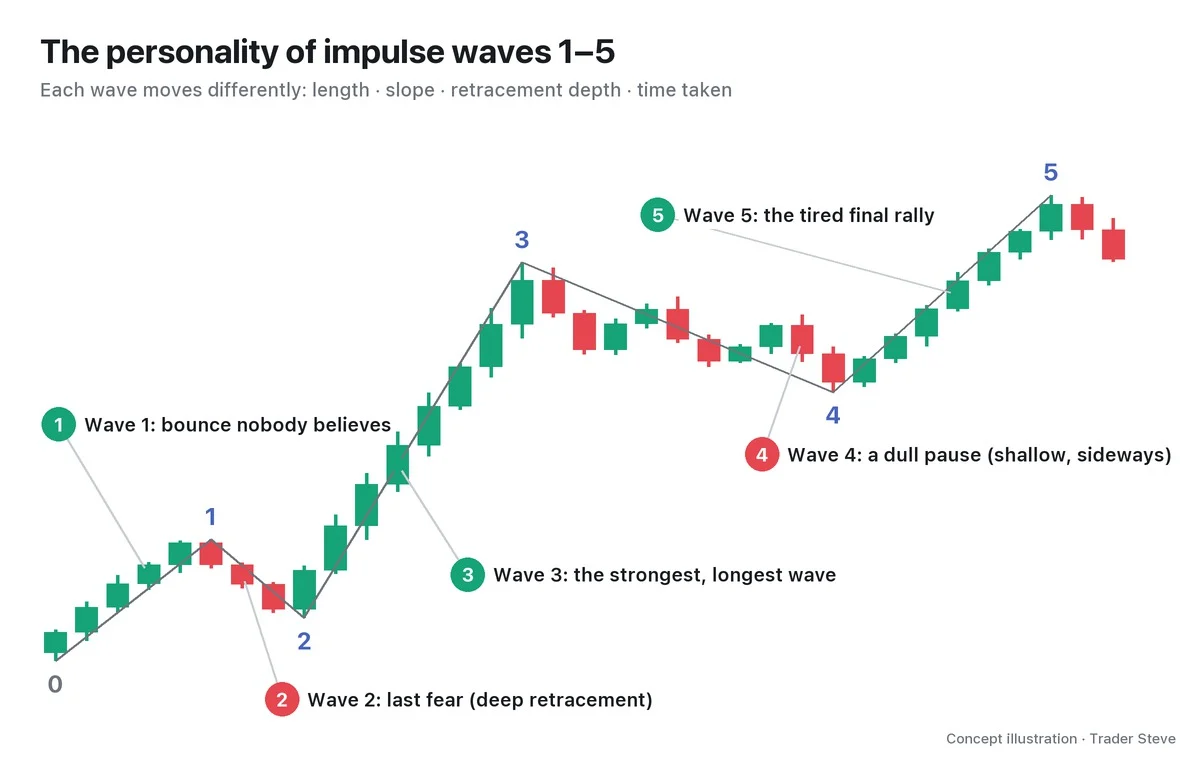
| Wave | Price shape | Volume | Market mood | Nickname |
|---|---|---|---|---|
| Wave 1 | Short rise off the low | Rises slightly | Nobody believes it | The bounce nobody believes |
| Wave 2 | Deep retracement of wave 1 (usually 50–61.8%) | Shrinks | Fear returns | The last fear |
| Wave 3 | Usually the longest and steepest | Highest | Everyone notices | The strongest wave |
| Wave 4 | Shallow (23.6–38.2%), sideways for a long time | Shrinks | Boredom, confusion | The dull pause |
| Wave 5 | New high, but weak | Often lower than wave 3 | Peak optimism and greed | The tired final rally |
① Wave 1 comes off the bottom. The news is still bad, and most people see it as "a bounce in a downtrend." So it is short and quiet.
② Wave 2 retraces a large part of wave 1 and brings back the fear that "it's a bear market after all." It drops sharply, but volume often shrinks — a sign that almost everyone who wanted to sell has already sold.
③ Wave 3 changes character at the point of recognition, where price clears the wave 1 high. Everyone notices the trend and piles in, so large-range candles and gaps cluster, and volume and momentum are at their strongest.
④ Wave 4 is the breather after wave 3. It tends to be shallow and drag sideways for a long time, and it easily turns complex, like a triangle or a flat. The tendency for it to take the opposite shape from a deep, sharp wave 2 is called the guideline of alternation (see elliott/alternation).
⑤ Wave 5 makes a new high, but without the momentum of wave 3. It often lines up with regular bearish divergence: price makes a higher high while the RSI makes a lower high. This is when the mood is most optimistic.
3. The Personality of Corrective Waves A, B and C
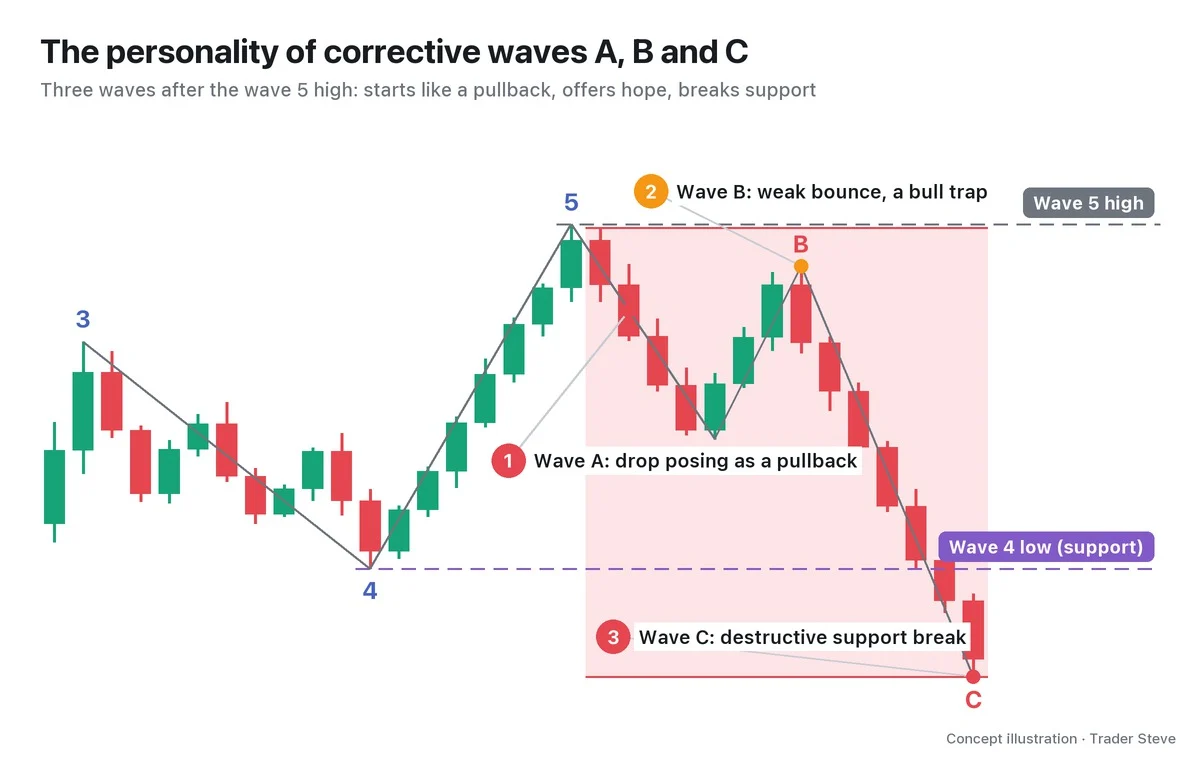
① Wave A is the start of the decline, but most people still see it as "a nice pullback."
② Wave B is a weak bounce, but when it climbs back to near the wave 5 high, hope builds that "it's going again." That's why it is called a sucker rally (bull trap). In a flat correction, B can even exceed the wave 5 high (see elliott/flat).
③ Wave C is a broad, powerful decline. The support that held price up gives way and panic selling comes in. Apart from the direction, it looks like wave 3. A falling impulse wave reads like a mirror image: falling wave 3 is the strongest decline.
String these eight waves together in one picture and you can see the same psychology repeating with each number.
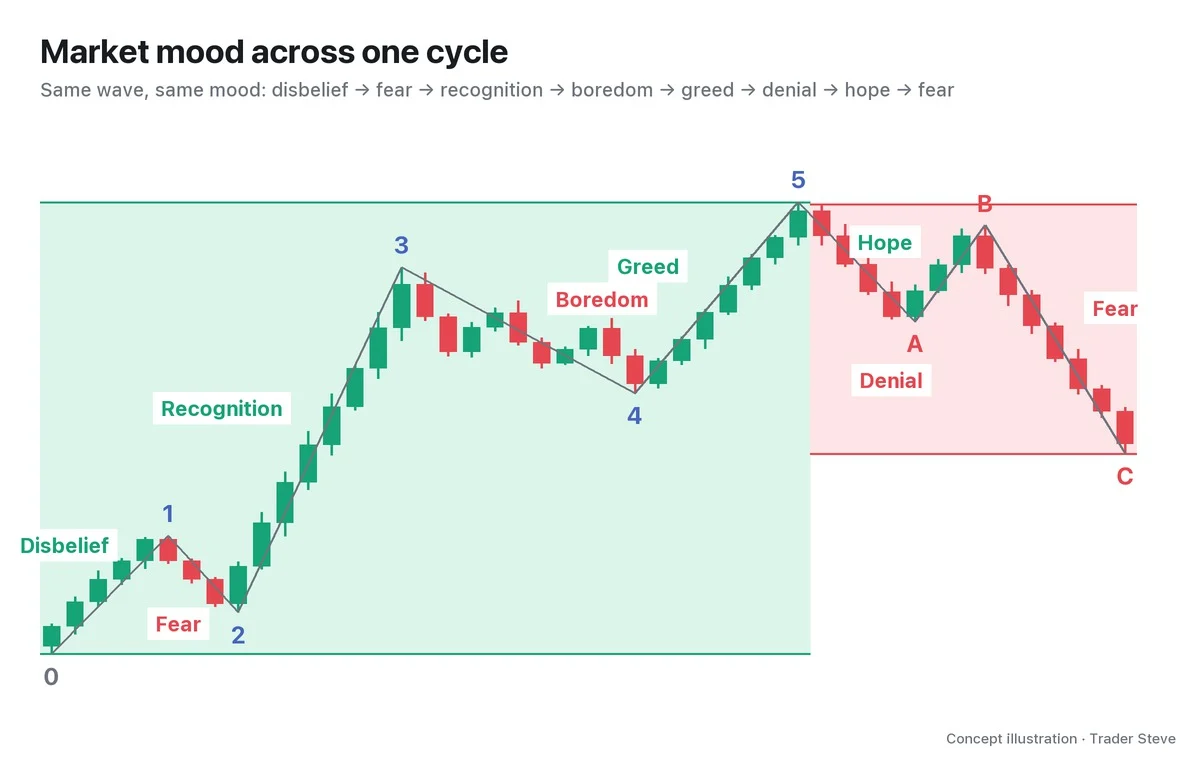
Personality shows up at every wave degree, but the higher the timeframe, the clearer it gets.
4. Why Wave 3 Is the Star
If you remember only one of the eight, make it wave 3. In practice, it is where the biggest move comes from.
"By Elliott, you get 1, 2, 3, 4, 5, and up to 1, 2, 3 is confirmed, while 4 and 5 are kind of like a bonus stage, right? This idea that wave 3 has the longest body — that's wave-theory talk, and it's not necessarily so." — Trader Steve, live stream, Oct 23, 2026 (translated from Korean) · ▶ Watch the stream highlights (Korean audio)
The key caveat is "it's not necessarily so." The rule only says wave 3 must not be the shortest, and there are extensions where wave 1 or wave 5 runs longer (see elliott/extension). Still, the personality of "the strongest, fastest stretch" is the most useful yardstick when choosing a count. If the numbers are confusing, find the stretch that moved hardest first, then fit what comes before and after. The strongest subwave inside wave 3, the "third of a third," is covered in Parts 3 and 4.
5. A First Look on Real BTC
Now let's hold these personalities up against a real Bitcoin (BTC) daily chart. Below, the rally from July to September 2026 is read as one example count.
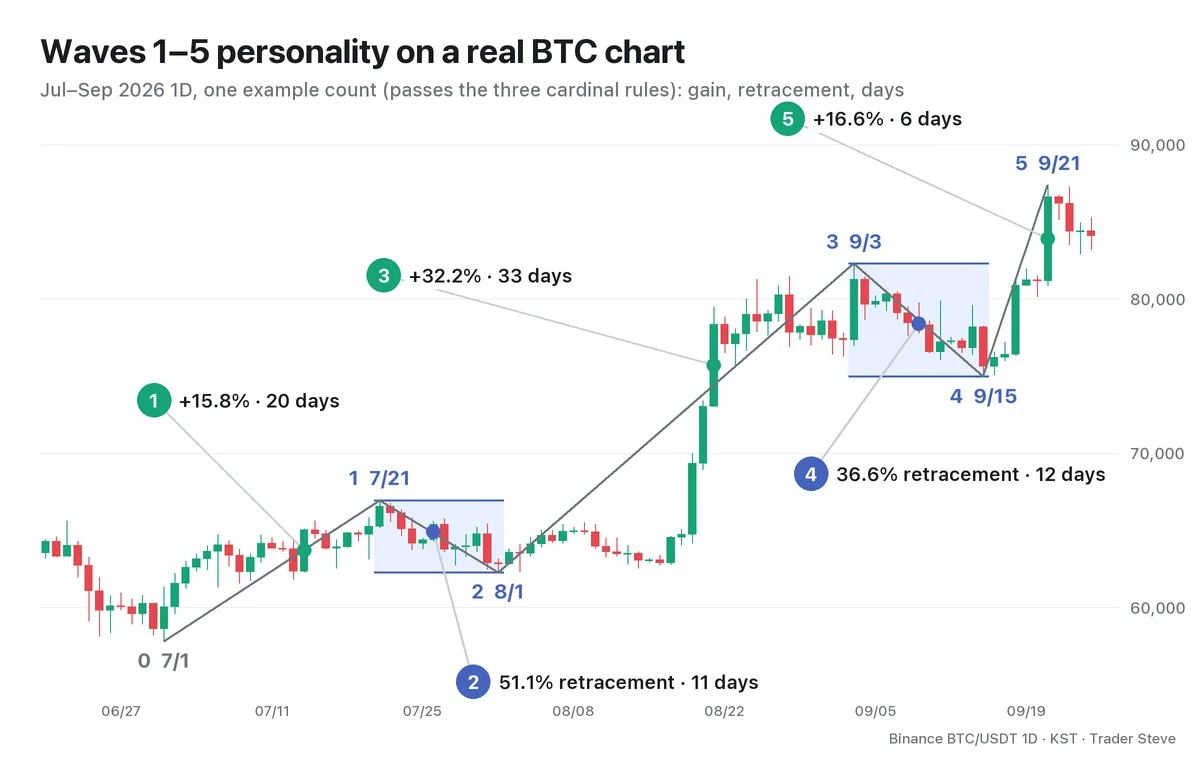
- 0 → wave 1: from the Jul 1 low of 57,800 (the 2026 low) to 66,956 on Jul 21, +15.8%, 20 days
- Wave 2: down to 62,275 on Aug 1, a 51.1% retracement of wave 1, 11 days
- Wave 3: up to 82,300 on Sep 3, +32.2%, 33 days. At 2.19x the length of wave 1, it is the longest
- Wave 4: down to 74,968 on Sep 15, a 36.6% retracement of wave 3, 12 days
- Wave 5: up to 87,396 on Sep 21, +16.6%, in just 6 days
The count passes all three cardinal rules. The wave 2 low of 62,275 is above point 0 at 57,800, wave 3 is the longest, and the wave 4 low of 74,968 does not overlap the wave 1 high of 66,956. The personality also resembles the textbook. A deep wave 2 (51.1%) alternates with a shallow wave 4 (36.6%), and wave 3 went the longest and lasted the longest. Wave 5, on the other hand, rose quickly in just 6 days — and whether that was a "tired wave 5" can't be told from price alone. Overlaying RSI and volume continues in Part 4.
The same chart can be counted differently depending on where you place the end of wave 3. This picture is not the answer; it is a practice example for holding personality up against a chart.
Key Takeaways
- Wave personality is a supporting yardstick that reads waves by how they move (length, slope, retracement depth, time, volume, momentum, mood), not by their numbers.
- Wave 1 is doubt, wave 2 is deep fear, wave 3 is the strongest recognition, wave 4 is boredom, wave 5 is greed running out of steam.
- Wave A starts out looking like a pullback, wave B is a sucker rally that offers hope, and wave C is a strong decline that breaks support.
- Personality is only a tendency, not a cardinal rule. Use it to choose between counts when they split.
In Part 2, we'll cover the concrete yardsticks (length, depth, duration, volume, RSI) for telling wave 3 from wave 5 and wave 2 from wave 4, along with a checklist for each wave.
Running these checks by hand for every market takes real time. Market-by-market analysis that combines Elliott Wave and divergence is available in the Omnisight Report below.
This lesson adapts the text, figures and live-stream quotes of the Trader Steve TA series for the web, translated from the original Korean. Check the text and figure captions for the timing and interpretation of each real example, and read conceptual diagrams and real charts separately.
Corrections: support@omnisight.report