What Is a Zigzag Wave? The ABC Correction and Its 5-3-5 Structure
Historical examples for learning · not current prices or trade recommendations.
Contents
When a strong rally turns over, it often doesn't fall in one straight line. Instead it drops, bounces, then drops again. In Elliott Wave, this sharp correction that turns three times is called a zigzag (ZZ). This lesson uses diagrams and a real Ethereum (ETH) chart to explain what a zigzag is, why it breaks down into 5-3-5 when you look inside, and why price bounces its way through it.
All dates and times are Korea Standard Time (KST, UTC+9). A daily candle is dated by its 09:00 KST open, and the time shown for an intraday candle is the time that candle opens. The actual intraday time of a high or low is stated separately.
1. The One-Line Definition: A Sharp Correction That Turns Three Times Against the Larger Trend
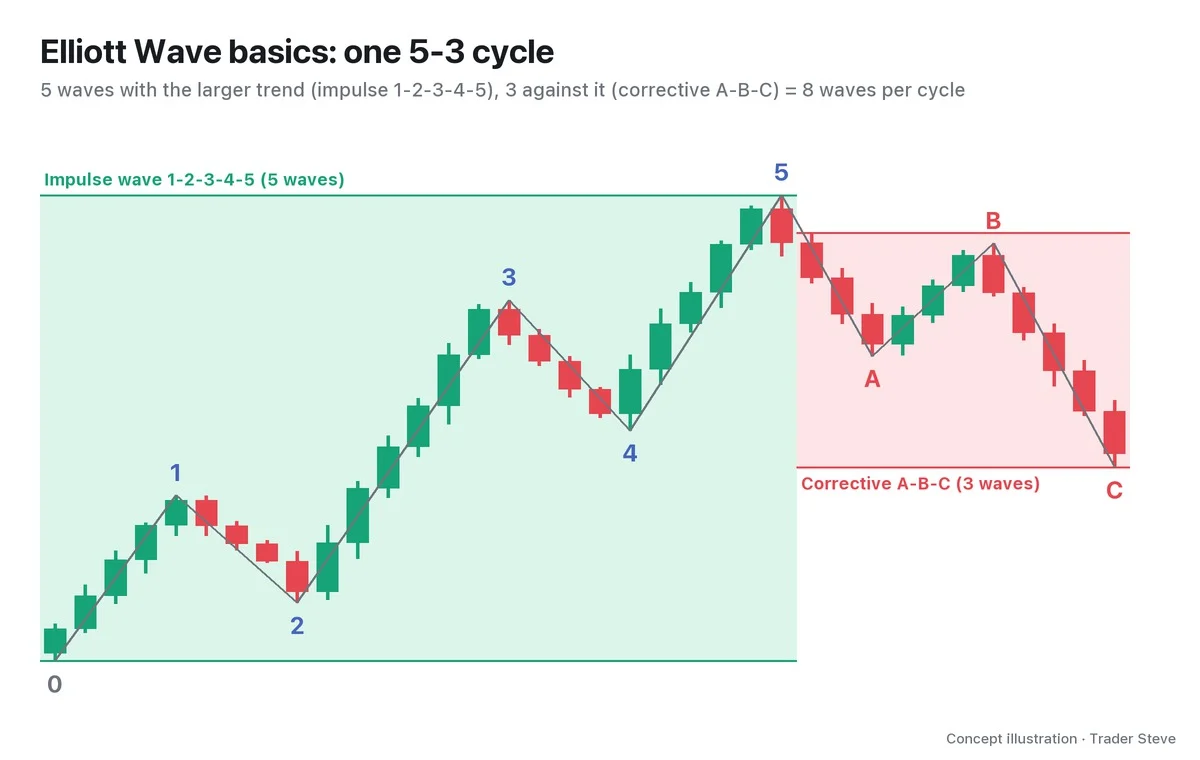
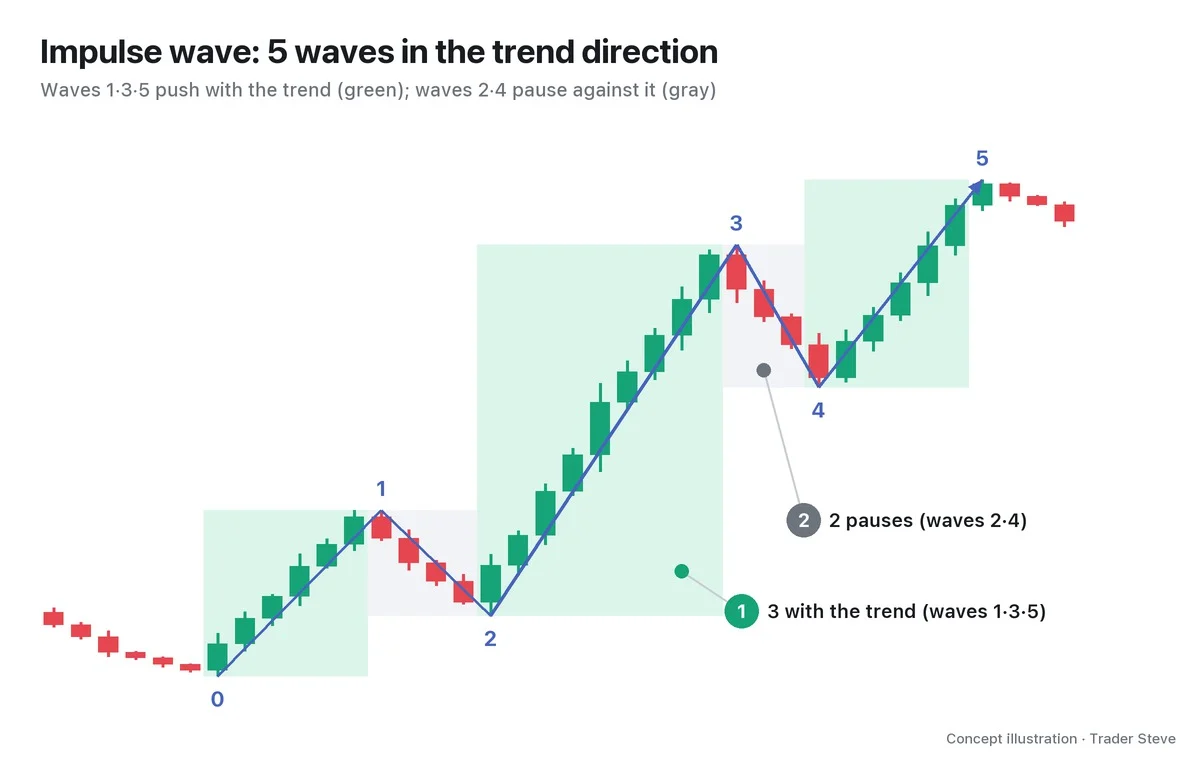
Elliott waves fall into two broad types: the impulse wave, which moves five times in the direction of the trend, and the corrective wave, which moves against it as a pause. The zigzag is the sharpest form of corrective wave.
- Wave A: the first move against the larger trend
- Wave B: a short bounce (or pullback) that retraces only part of A
- Wave C: a move back in A's direction, usually going past the point where A ended
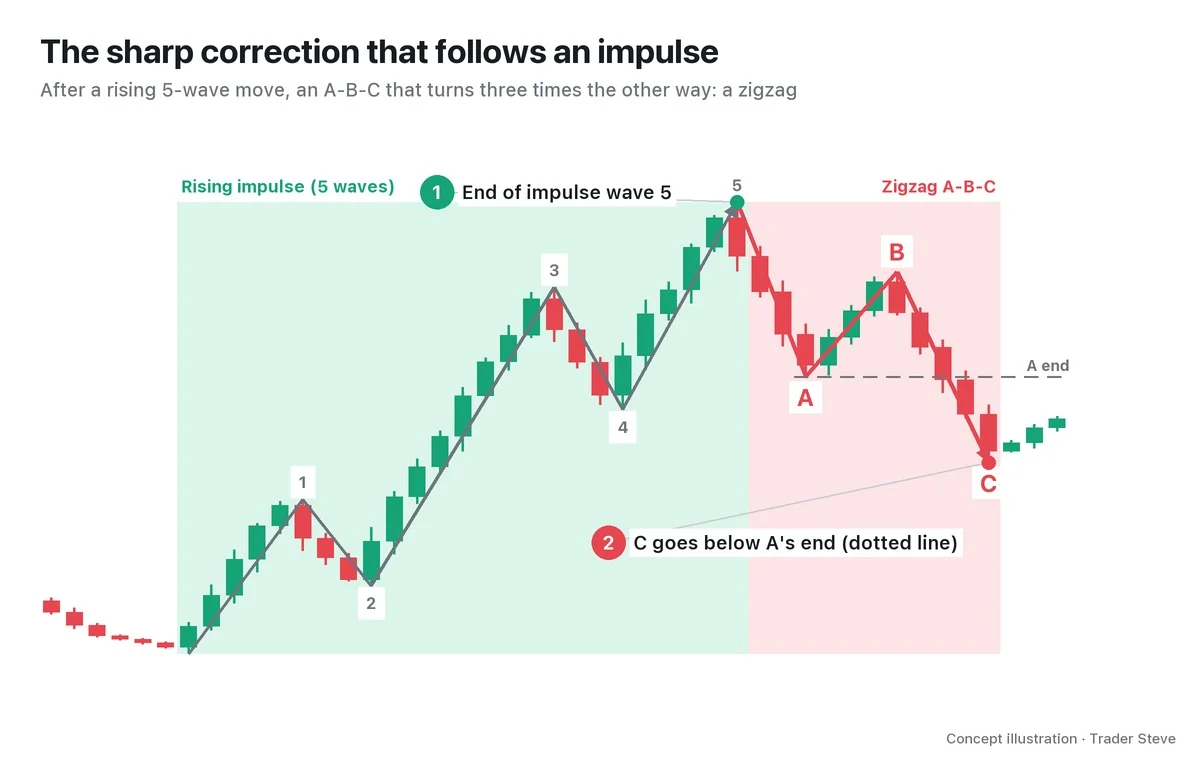
Unlike corrections that drift sideways for a long time, a zigzag retraces price deeply in a short time. B can't retrace much of A, and C digs below A's end, so on the chart it looks sharp: it turns, then turns again.
Zigzags show up most often in three places.
- After wave 5 of an impulse: after five waves up, an A-B-C comes in the opposite direction.
- In the wave 2 position of an impulse: the first pullback right after wave 1 often comes as a deep, fast zigzag.
- Bounces in a bear market: a bounce in the middle of a big decline can come as a rising A-B-C. The shape is the same; only the direction is flipped.
I've described exactly this sequence on the live stream: all five rising waves are in, so now it's time for three turns in the opposite direction.
"1, 2, 3, 4, 5 have all played out like this, right? So now an ABC comes out to the downside, like this." — Trader Steve, live stream, Oct 22, 2026 (translated from Korean) · ▶ Watch the stream highlights (Korean audio)
2. 5-3-5: A and C Have Five Waves, B Has Three
Zoom into a zigzag on a lower timeframe and each wave contains smaller waves. Writing those counts in order gives you 5-3-5.
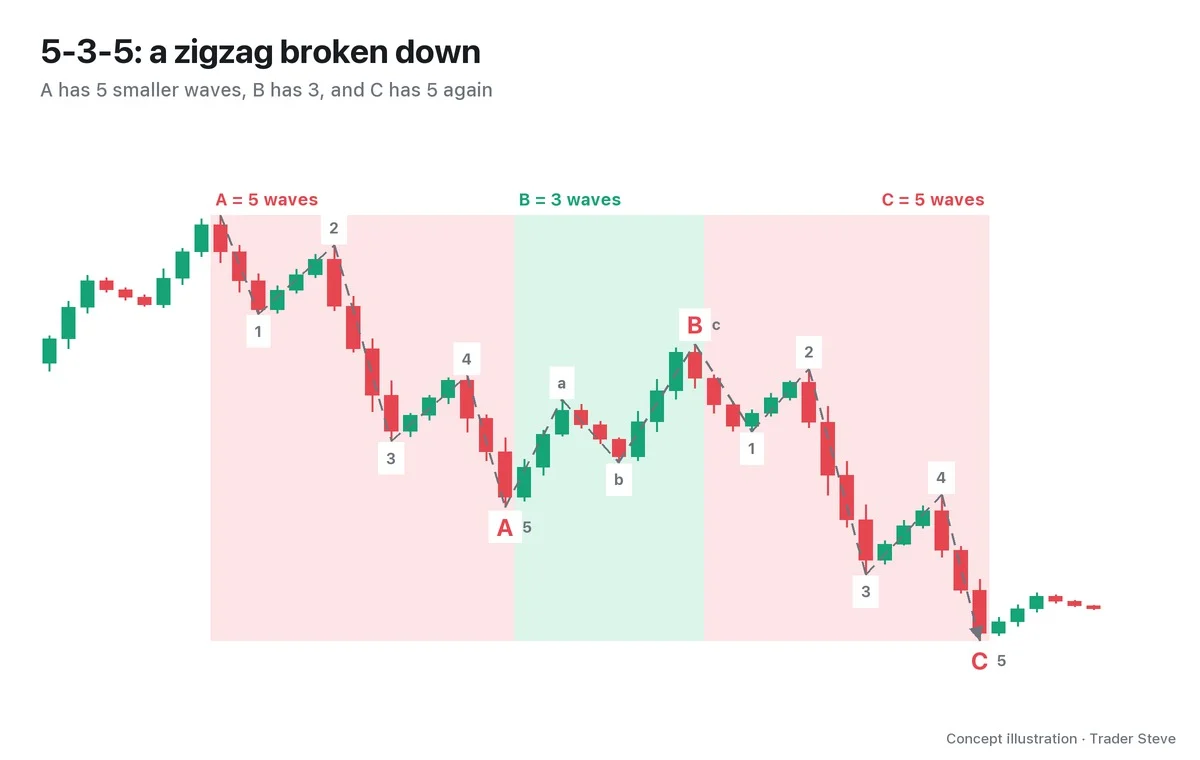
| Wave | Direction | Waves inside | Character |
|---|---|---|---|
| A | direction of the correction | 5 | a small impulse wave |
| B | opposite direction | 3 | a small corrective wave |
| C | direction of the correction | 5 | a small impulse wave |
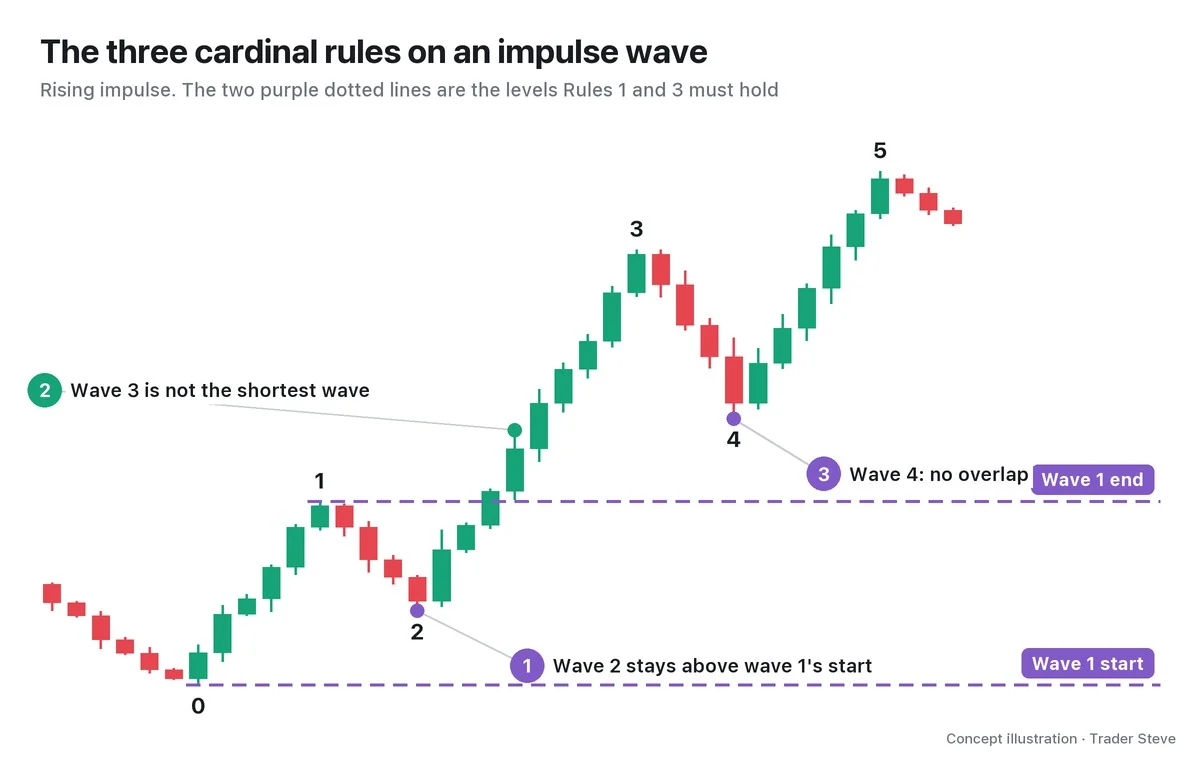
The key point is that the insides of A and C are impulse waves. So the impulse wave rules apply as-is to the five waves inside A and C. B, on the other hand, is a three-wave correction, so it can be a small zigzag itself or some other shape.
This 5-3-5 structure is what separates a zigzag from other corrections. For example, the flat, covered in the next topic, is 3-3-5: A breaks into three waves instead of five, and B retraces almost all of A. Part 2 covers the detailed rules and ratios.
3. Why It Happens: Why Price Bounces Instead of Going in One Move
Elliott Wave theory explains the zigzag as a rhythm of crowd psychology. I look at one more thing: the position of the big money that actually moves price.
"You really can't ignore wave structure. Because rallies and declines always come out as ABC. Always. … It's this, repeated." — Trader Steve, live stream, Aug 20, 2026 (translated from Korean) · ▶ Watch the stream highlights (Korean audio)
"It's not just a matter of belief. The big players who actually move price only make money if they move it this way." — Trader Steve, live stream, Aug 20, 2026 (translated from Korean) · ▶ Watch the stream highlights (Korean audio)
Here is the explanation that followed in the same stream. If you buy a lot of size while pushing price straight up in one direction, price keeps rising as you buy, so your average buy price gets dragged higher. Likewise, if you sell while pushing price straight down, your average sell price ends up low. Either way you end up buying high and selling low, and you lose money. That's why price shakes as it moves. On the way down, it drops once, then bounces to create a place to sell again from higher up, and uses that size to push down once more.
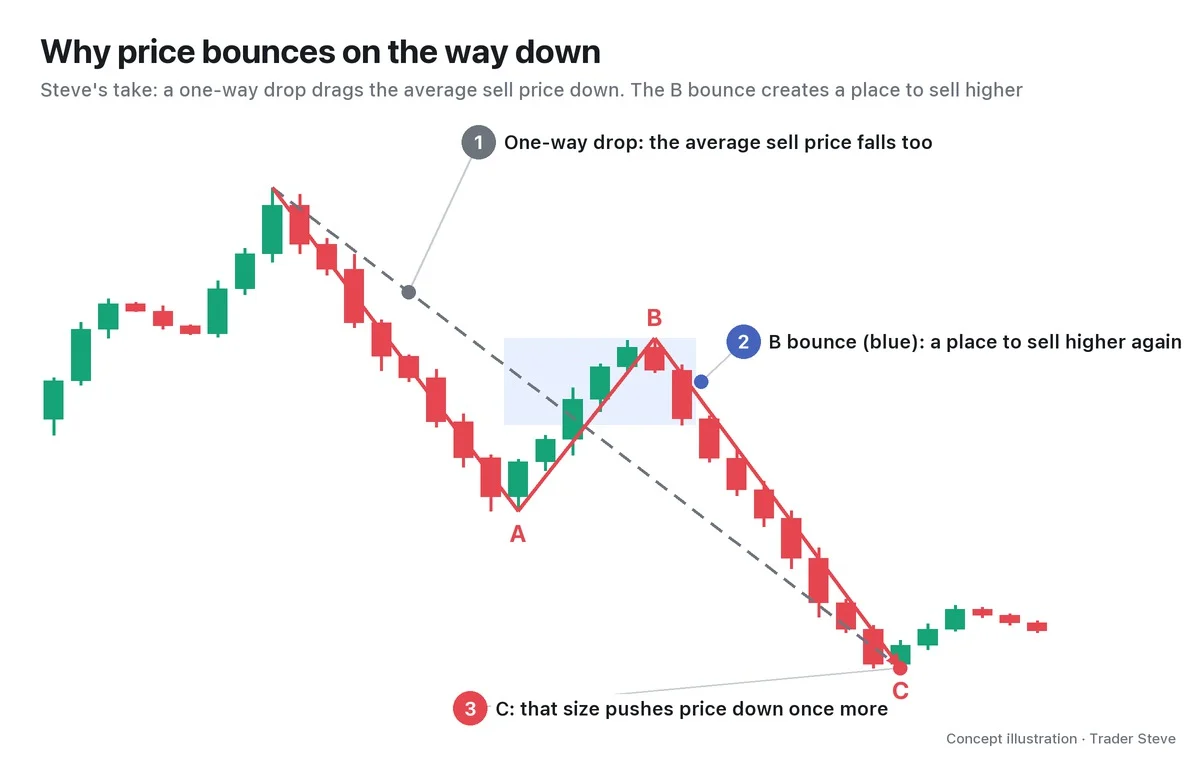
Seen this way, the B bounce may not be "a sign the decline is over" but part of the process of building a better average entry price. That's also why it's easy to mistake B for a trend reversal.
For the record, on the live stream I don't use the term "zigzag." I just call it "ABC." It refers to any move that turns three times on its way, whether up or down.
"Rallies always come out as 1, 2, 3. It goes up as an ABC. And when it comes down, it comes down as an ABC too." — Trader Steve, live stream, Oct 23, 2026 (translated from Korean) · ▶ Watch the stream highlights (Korean audio)
The ABC I talk about has the same shape as the textbook zigzag. Think of the textbook version as a stricter definition that adds the 5-3-5 internal structure and rules on top.
4. The Zigzag Family and Other Corrections
A zigzag can end after one round, or more can follow.
- Single zigzag: one A-B-C
- Double zigzag (W-X-Y): two zigzags joined by a connecting wave (X). It shows up when the first zigzag alone isn't enough of a correction.
- Triple zigzag (W-X-Y-X-Z): three zigzags joined together. It's rare, and three is the limit.
Unlike the sharp zigzag, some corrections drift sideways. The main examples are the flat, where B retraces almost all of A, and the triangle, which swings back and forth five times while narrowing. Part 2 covers how to tell doubles and triples apart from a single zigzag.
5. A Real ETH 4-Hour Example
Let's find the zigzag shape on a real Ethereum (ETH) chart. What follows is one possible count.
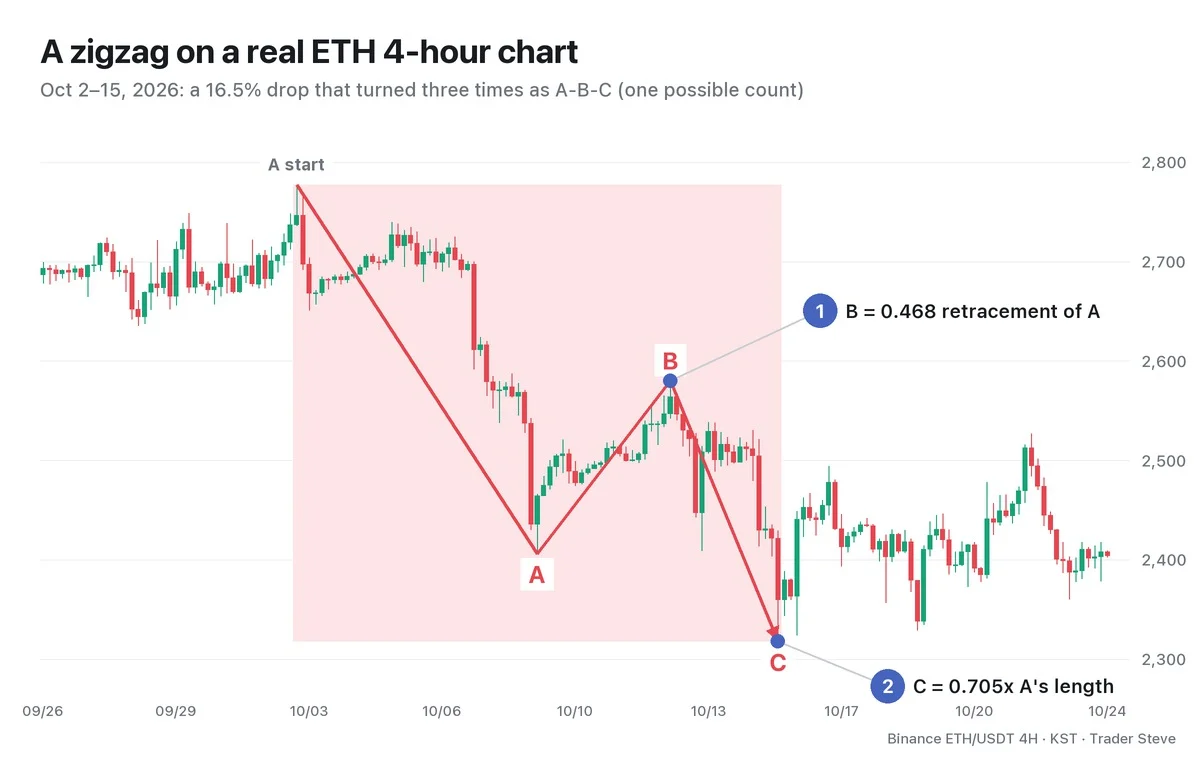
- A: high of 2,777.33 at 17:00 on Oct 2 → low of 2,406.11 at 01:00 on Oct 9 (length 371.22)
- B: bounced to 2,579.88 at 13:00 on Oct 12. It retraced 0.468 of A and stayed well short of A's start at 2,777.33.
- C: low of 2,318.00 at 09:00 on Oct 15. It went below A's end at 2,406.11, and its length was 0.705x A.
B retraced less than half of A, and C went further down past A's end. That's exactly the basic zigzag shape from earlier. Afterward, the bounce high of 2,526.62 at 01:00 on Oct 22 also fell short of the B high at 2,579.88.
Keep in mind that all these numbers were measured after the fact. In the moment, you can't know where B will stop or how far C will go. Part 3 walks through the same chart again, laying retracement ratios and target candidates over this move to build a trading plan.
Key Takeaways
- A zigzag is a sharp correction that turns three times, A-B-C, against the larger trend.
- Its internal structure is 5-3-5: A and C have five waves (small impulse waves), and B has three.
- It often appears after wave 5 of an impulse, in the wave 2 position of an impulse, and in bear-market bounces.
- A one-way move can't give the big players a good average entry, so price bounces along the way. Don't assume a B bounce is a trend reversal.
- A count on a real chart is always one interpretation. The ratios are only confirmed after the fact.
In Part 2, we'll cover the zigzag's rules and guidelines, and how to identify double and triple zigzags.
Related reading: for the basic 5-3 structure and wave degrees, see Elliott Wave Basics (related lesson); for the rules of the five waves inside A and C, see Elliott Wave Impulse Waves (related lesson).
If lining up wave counts with other evidence, like Fibonacci and divergence, across many markets by hand feels tedious, the Omnisight Report below compiles that process for each market.
This lesson adapts the text, figures and live-stream quotes of the Trader Steve TA series for the web, translated from the original Korean. Check the text and figure captions for the timing and interpretation of each real example, and read conceptual diagrams and real charts separately.
Corrections: support@omnisight.report