What Is the AB=CD Pattern? The 1:1 Symmetry of Two Equal Legs
Historical examples for learning · not current prices or trade recommendations.
Contents
Spend enough time on charts and you keep running into the same scene: price pushes once, then pushes again by about the same amount. Harmonic theory calls this rhythm the AB=CD pattern, and it serves as the skeleton of every harmonic pattern, from the Gartley to the Bat. This lesson uses charts to show what an AB=CD is, how the bullish and bearish versions differ, and why price so often reacts near D.
All dates and times are Korea Standard Time (KST, UTC+9). A daily candle is dated by its 09:00 KST open. Intraday times are the open time of each candle.
1. The One-Line Definition: Four Points, Three Legs, Two Equal Legs
Take four swing points (A, B, C and D) and the three legs between them (AB, BC and CD). The AB=CD pattern looks for the point D where the CD leg ends after traveling the same length as the AB leg (1:1).
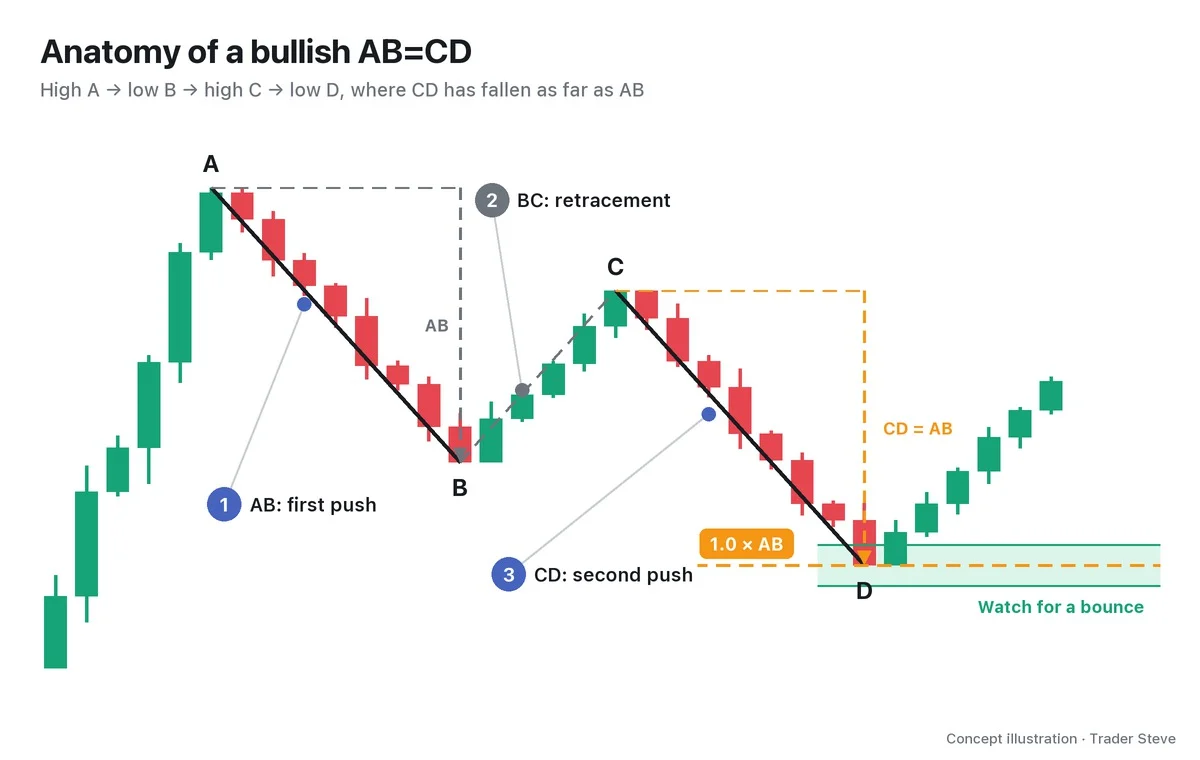
- AB leg: the first push. One large move in the direction of the trend.
- BC leg: the retracement. It gives back part of the first push.
- CD leg: the second push. Price moves again in the same direction as AB.
The key is the two vertical dashed lines in the chart. The gray arrow on the left is the height of AB; the orange arrow on the right is that same height copied onto C. The tip of that arrow is the 1.0 × AB level, the price where D is expected. When I say "it drops 1-to-1" or "a 1-to-1 rally" on the live stream, this is the measurement I mean.
The BC retracement usually lands between 0.382 and 0.886 of AB. Too shallow and it is just a ripple, hard to call a leg; too deep and C starts threatening A, which makes it a different structure. Part 2 goes through the exact identification rules one by one.
2. Bullish and Bearish AB=CD
An AB=CD comes in two directions. The name follows the reaction you expect at D.
| Type | Point order | Where D sits | What to watch at D |
|---|---|---|---|
| Bullish AB=CD (buy setup) | A high → B low → C high → D low | below B | whether the decline stalls and a bounce appears |
| Bearish AB=CD (sell setup) | A low → B high → C low → D high | above B | whether the rally stalls and price reacts lower |
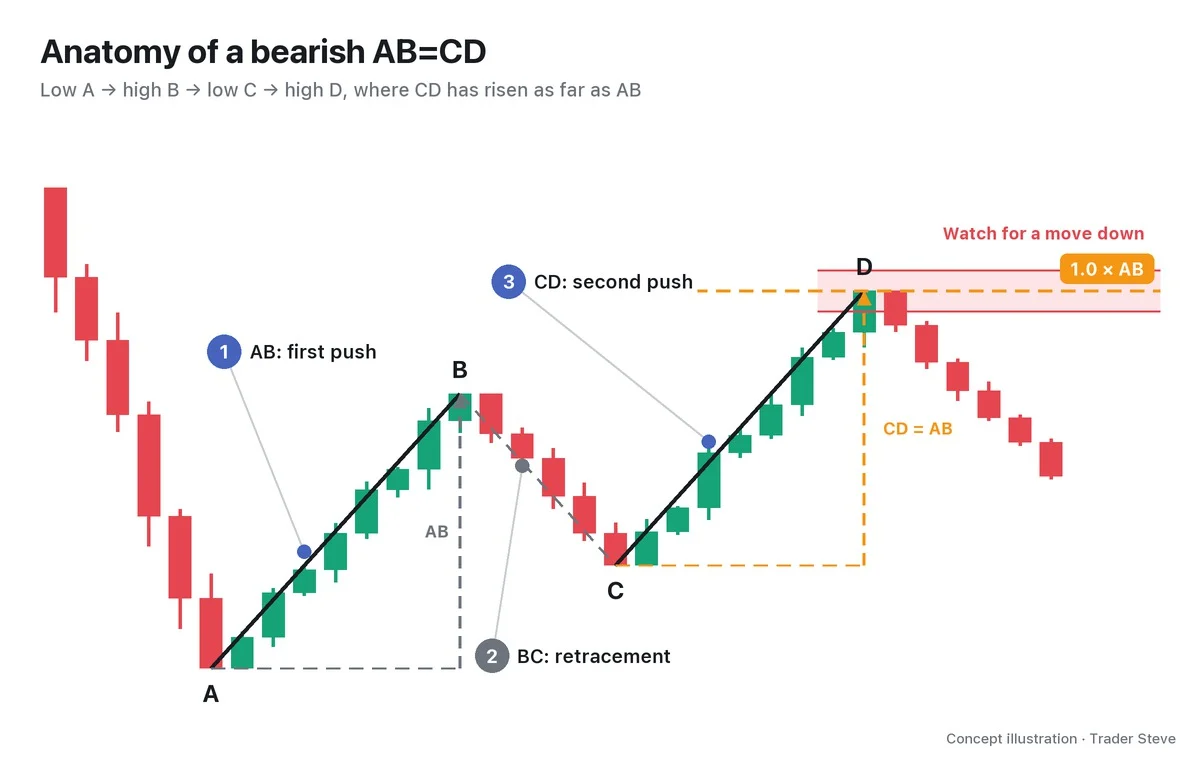
The bullish version is a tool for finding where the second drop inside a downtrend ends; the bearish version finds where the second rally inside an uptrend ends. Either way, D is not a place where price "must turn." It is a place to watch for a reaction.
3. Why It Forms: A Second Push of Similar Force, and Orders Clustering at D
Markets don't move in straight lines; they alternate between pushing and pausing. When price pushes hard in one direction (AB), catches its breath (BC) and then pushes the same way again (CD), the second push often ends at about the same size as the first. It helps to picture the same participants moving price once more with similar force.
Add to that people's memory. Plenty of participants remember how far the first push went, so orders gather near the point where price has moved the same distance again.
- Profit-taking: traders riding the CD leg reduce size near there, thinking "that's about 1-to-1."
- New entries: traders looking for the opposite direction wait for that area and step in.
In the end, D produces a reaction not because of the pattern's name but because orders crowd into that price zone. It's a point I stress on the live stream all the time.
"Stop going on about Elliott Wave counts this and harmonic patterns that. They're all just support and resistance lines. In some places there are a lot of sellers, and in some places there are a lot of buyers." — Trader Steve, live stream, Oct 7, 2026 (translated from Korean) · ▶ Watch this moment (Short, Korean audio)
A, B, C and D are, after all, highs and lows: points in the swing structure. The rules for picking swing highs and lows are in the Basics Swings and Trend topic (related lesson).
"That's the reason every kind of chart analysis uses Dow Theory, which came out in the 1800s, as its base. Elliott Wave? It's all built on structure. All the harmonic stuff, and ICT too: it's all talk about structure." — Trader Steve, live stream, Aug 25, 2026 (translated from Korean) · ▶ Watch this moment (Korean audio)
4. Why AB=CD Is the Skeleton of Harmonic Patterns
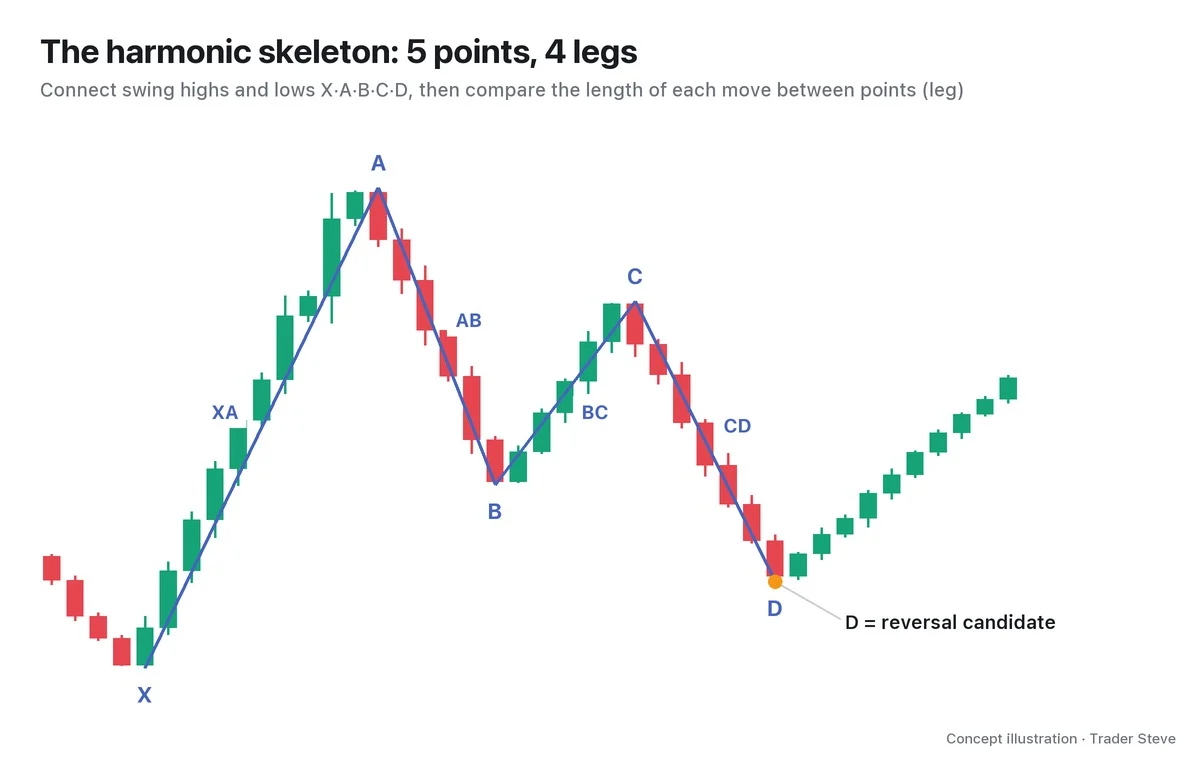
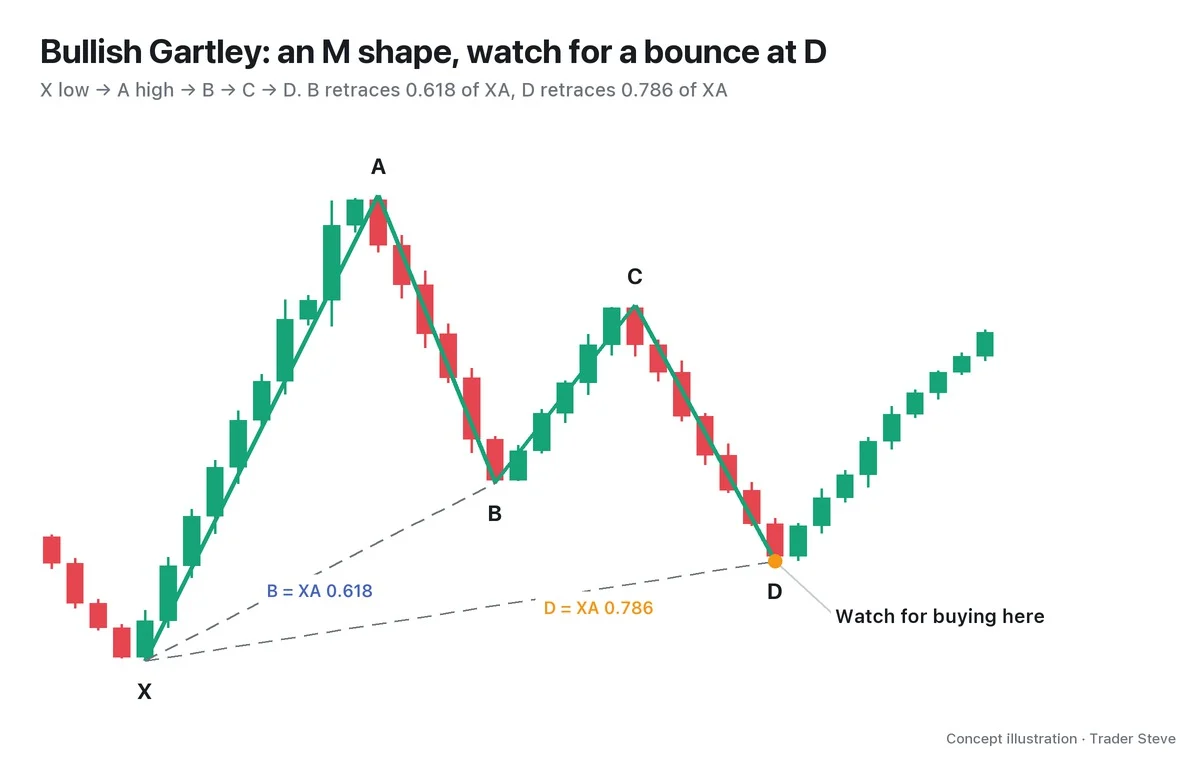
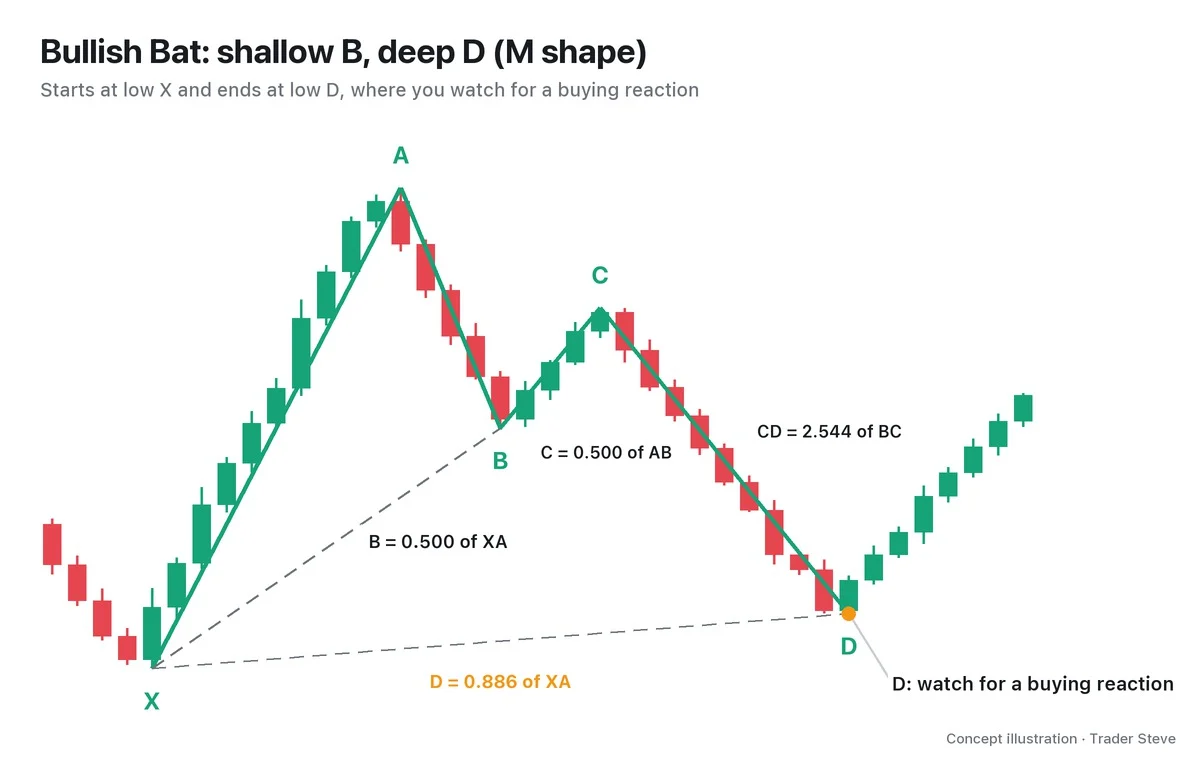
Named harmonic patterns such as the Gartley, the Bat and the Butterfly are drawn with five points: X, A, B, C and D. Cover up the leading X, and the four points left form an AB=CD (or one of its extended versions).
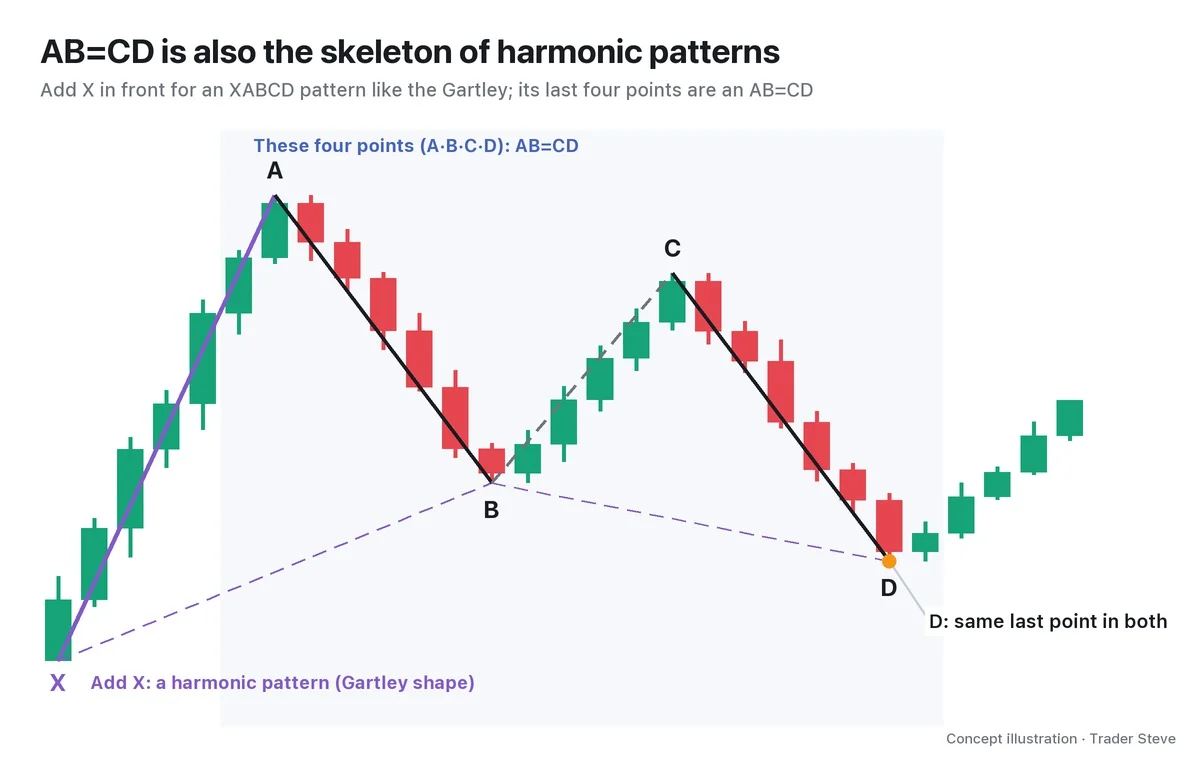
That's why it pays to learn the AB=CD first when you study harmonic patterns. The other patterns are close to this same skeleton with one extra condition on top: "at what percentage of the move from X to A does D end?" The ratio table for each pattern and the overall map are in the Harmonic Basics topic (related lesson), and the Fibonacci ratios behind them are in the Basics Fibonacci topic (related lesson).
5. A First Look at a Real Chart: Ethereum Daily, Fall 2024
Here is a real example that came out fairly close to the textbook shape.
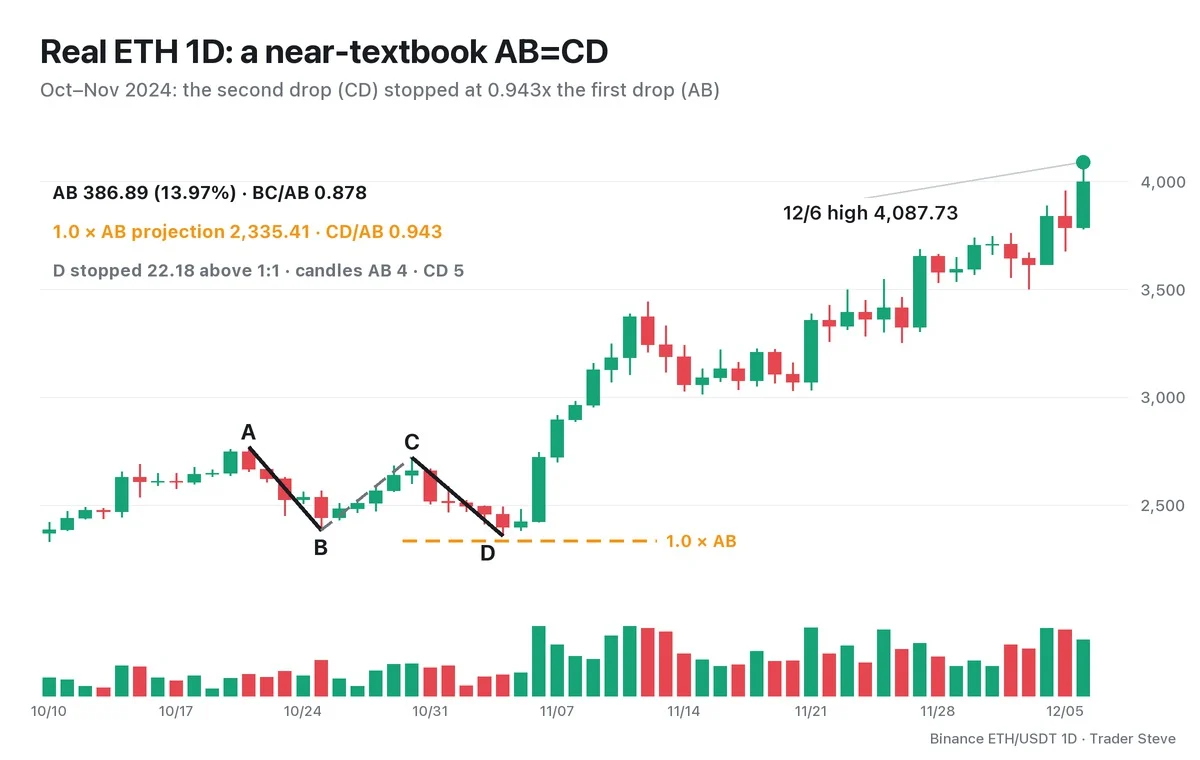
- A Oct 21 high 2,769.48 → B Oct 25 low 2,382.59. The AB leg is 386.89 (13.97%).
- C Oct 30 high 2,722.30. BC retraced 0.878 of AB, inside the 0.382–0.886 range.
- D Nov 4 low 2,357.59. CD was 0.943x AB.
Subtract the AB length from C and the 1:1 level is 2,335.41. The actual low stopped 22.18 above it. The candle counts were similar too: 4 for AB, 5 for CD. Afterward, price dipped only to 2,380.74 the next day, and by Dec 6 it had climbed to 4,087.73.
The point to take from this example is that D did not touch the 1:1 line exactly. On real charts, two legs are rarely equal down to the decimal. So treat D not as a single price but as a zone around 1:1. Part 2 shows how to measure that zone two ways (the reciprocal ratio), and Part 3 shows how to split entries, stops and targets inside it.
Key Takeaways
- An AB=CD looks for the point D where CD has traveled the same length as AB (1:1) in a four-point, three-leg structure.
- In the bullish version, D is below B (a place to watch for a bounce); in the bearish version, D is above B (a place to watch for a move down).
- Price reacts at D because participants who remember the size of the first push place orders near it. In the end, it is support and resistance.
- The last four points of harmonic patterns like the Gartley and the Bat are an AB=CD.
- D is a zone around 1:1, not a single point, and it is only a place to watch for a reaction, not a confirmed signal.
In Part 2, we'll cover the rules for picking A, B, C and D precisely, along with the BC–CD reciprocal ratio table.
If repeating this calculation by hand for every market gets tedious, the Omnisight Report, which pulls several theories together in one place, is worth a look.
This lesson adapts the text, figures and live-stream quotes of the Trader Steve TA series for the web, translated from the original Korean. Check the text and figure captions for the timing and interpretation of each real example, and read conceptual diagrams and real charts separately.
Corrections: support@omnisight.report