What Is a Harmonic Pattern? XABCD and the PRZ, Explained Simply
Historical examples for learning · not current prices or trade recommendations.
Contents
Gartley, Bat, Crab. There are plenty of names, but every harmonic pattern comes down to one framework: five points and a handful of ratios. This lesson uses charts to show how to read XABCD, the skeleton of a harmonic pattern, and what the potential reversal zone (PRZ) — the single most important idea in harmonics — actually is.
1. The One-Line Definition: Five Points and a Reversal Candidate Measured by Ratios
A harmonic pattern is the shape you get when you connect five swing highs and lows on a chart (X, A, B, C, D) in order and the ratios between the lengths of the legs (a leg is one move between two points) match Fibonacci ratios. When the ratios fit, the area around the last point, D, is treated as a candidate zone where price may change direction.
The starting point is a chart H.M. Gartley printed on page 222 of his 1935 book Profits in the Stock Market, which is why it is still sometimes called the "222 pattern." Fibonacci ratios were added later, and Scott Carney organized the approach under the names "harmonic trading" and PRZ.
2. Reading the Five Points and Four Legs
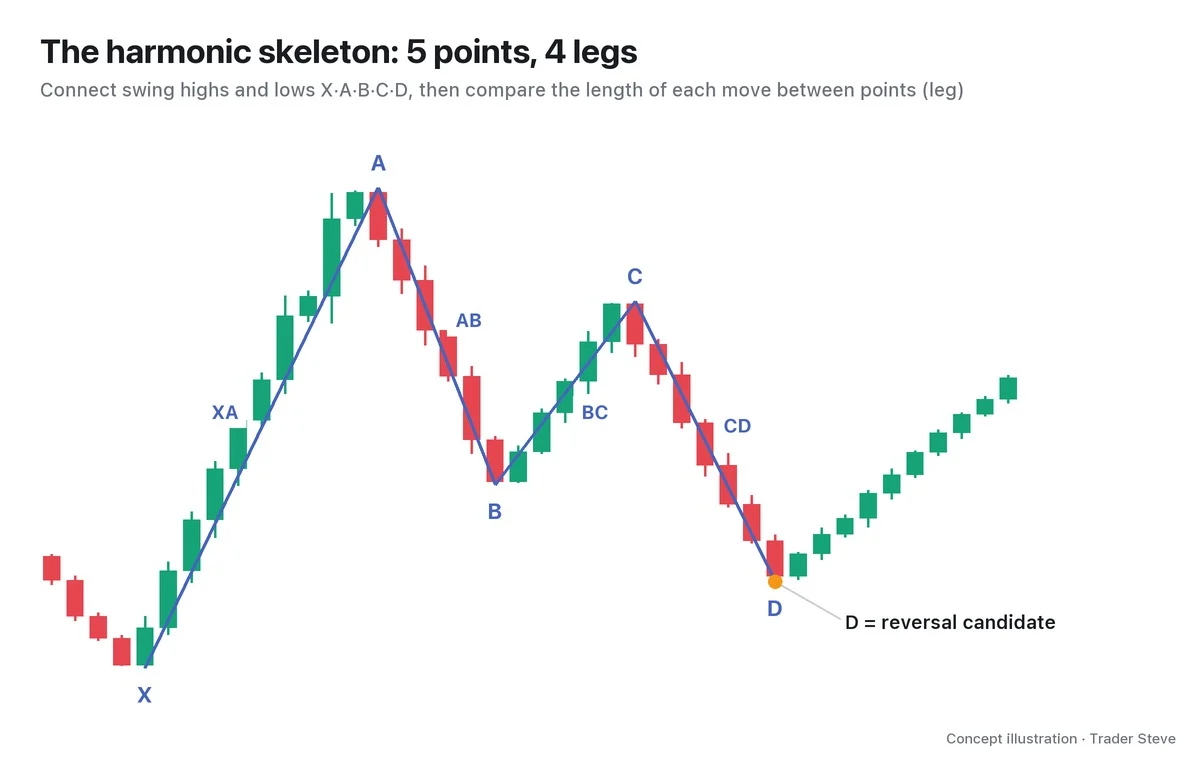
Here is how to read the points and legs.
- XA: the first large move. It is the yardstick for every ratio that follows.
- AB: how much of XA is retraced. The depth of B does more than anything else to decide the pattern's name (Part 2).
- BC: how much of AB is retraced in turn.
- CD: the final leg. The whole point of harmonics is to calculate in advance where this leg may stop.
The key point is that X, A, B, C and D are all wick extremes of confirmed swing highs and lows. This is not a tool for picking any candle you like until the ratios fit. The chart above is a hypothetical chart with X at 100 and A at 130. B at 111.46 retraced 0.618 of XA, and C at 122.92 retraced 0.618 of AB.
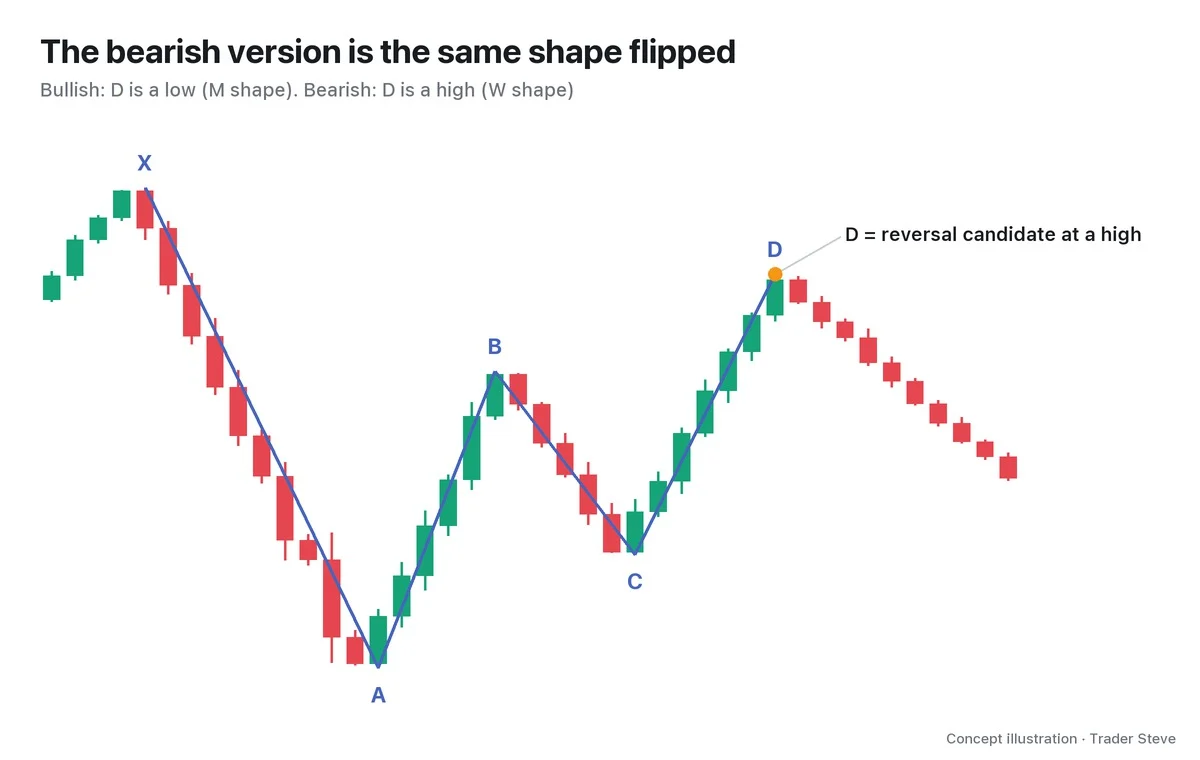
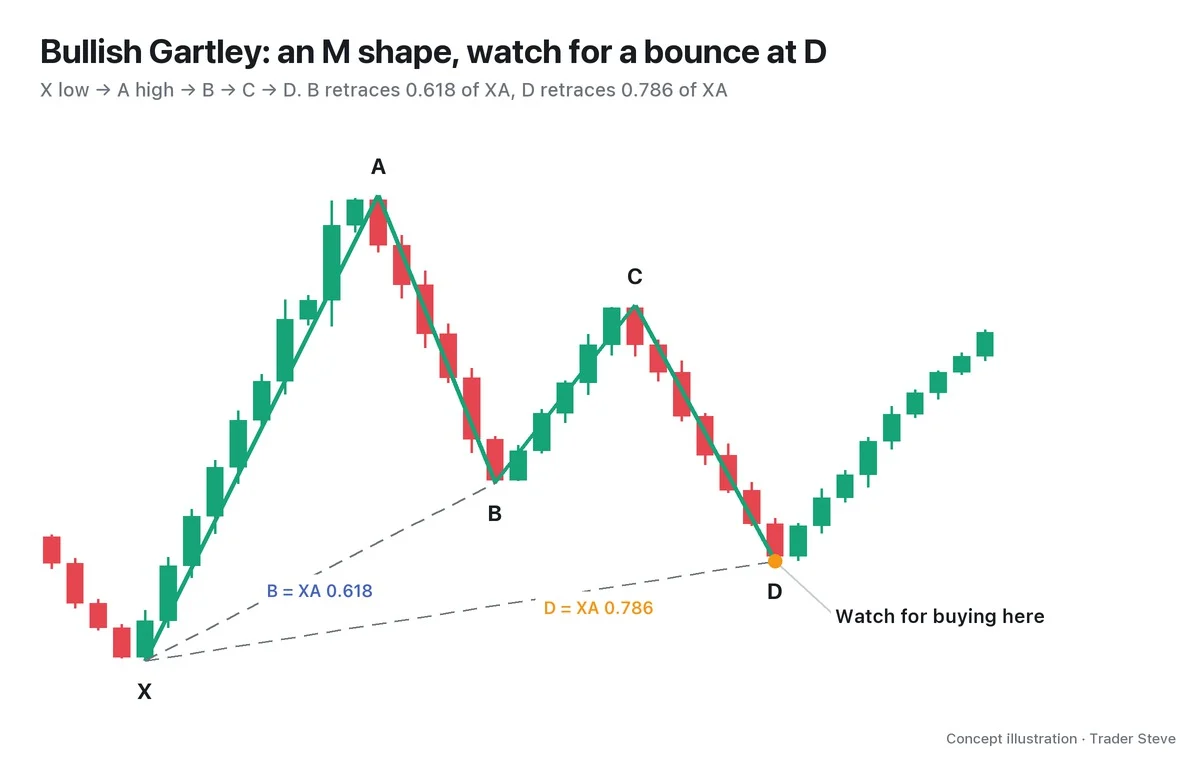
In a bullish pattern, D is a low — the place to look for a bounce — and the zigzag looks like the letter M. In a bearish pattern, D is a high and the zigzag looks like a W. The ratios you calculate are identical; only the direction is reversed.
3. PRZ: Not a Single Line, but a Zone Where Measurements Cluster
In harmonics, D is not set by one ratio. You check whether two or three prices measured in different ways cluster in one place. That price zone where the measurements cluster is called the potential reversal zone (PRZ).
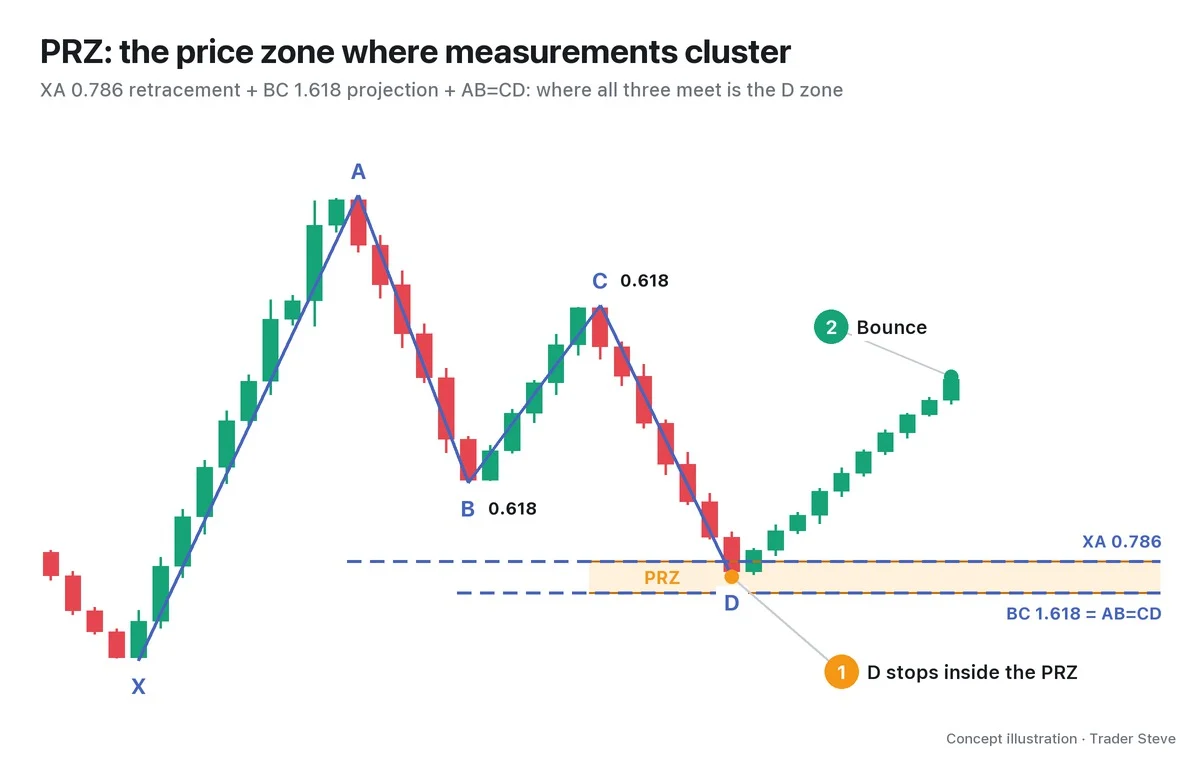
Let's work it out on the hypothetical chart in the figure.
- XA retracement: coming down from A at 130 by 0.786 of the XA length of 30 gives 106.42.
- BC projection: coming down from C at 122.92 by 1.618x the BC length of 11.46 gives 104.38.
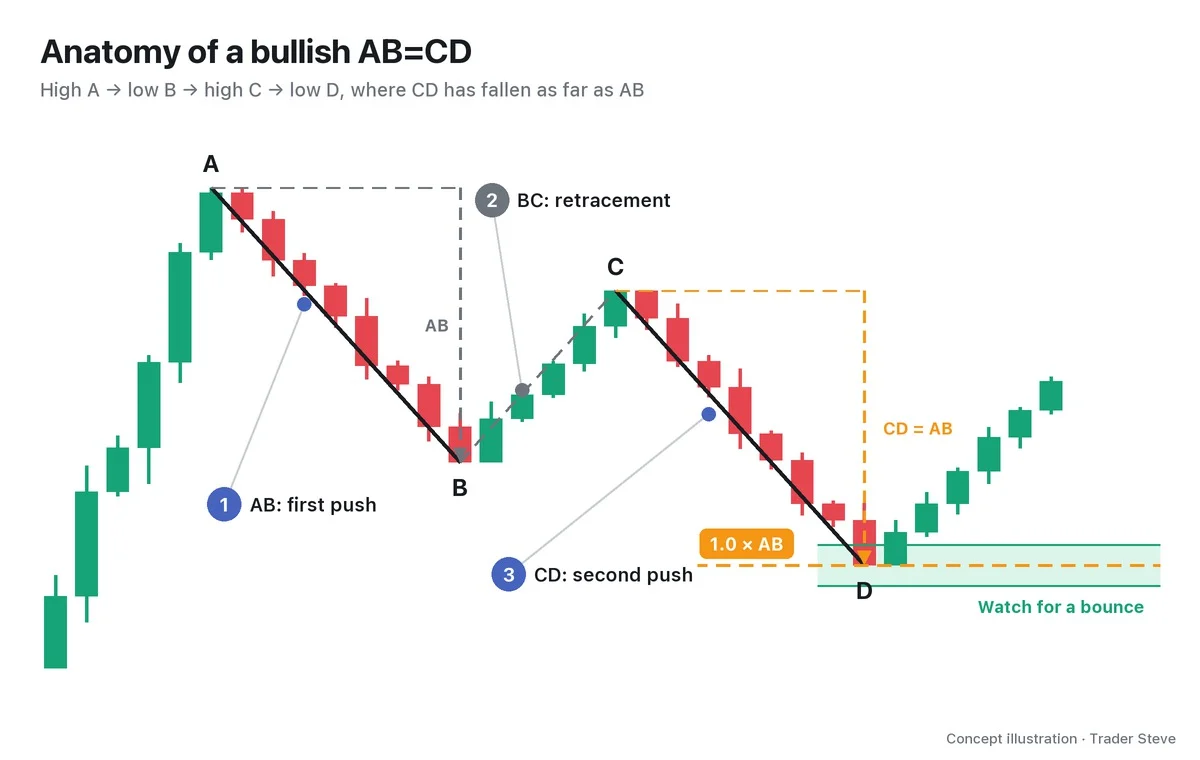
- AB=CD: if CD falls the same length as AB (18.54), it reaches 104.38 from C.
The three measurements land in a narrow zone, 104.38–106.42. That is the PRZ. When three different yardsticks point to the same place, you have more reasons to watch it.
Traders who never use harmonics think this way too. On a live stream, looking at a KOSPI chart (South Korea's main stock index), I put it like this:
"If it comes down to here, the 1:1 decline roughly lines up, and on a retracement of the whole rally it's the 0.705 line. Uncanny, right? The idea is that the most ideal entry point can be pinned down to a spot like this." — Trader Steve, live stream, Oct 18, 2026 (translated from Korean) · ▶ Watch the stream highlights (Korean audio)
Two different measurements — a 1:1 length (the same idea as AB=CD) and a retracement ratio — met at one spot. For reference, 0.705 is not a harmonic ratio; it is a value used in ICT. The numbers differ, but the PRZ idea is the same: look for the place where several measurements overlap.
4. Why Expect a Reaction There?
Price does not turn around by magic just because the ratios fit. I see two reasons.
First, Fibonacci ratios are levels a lot of people watch. If many traders leave orders at the same price zone, buying and selling really do collide there. Second, in the end that place is support or resistance. I don't put special faith in harmonics on their own, and on live streams I always say something like this:
"Build a strategy and find a way to maximize your risk-to-reward within it. That's all the trading you guys need to do. Don't talk to me about Elliott Wave counts this, harmonic patterns that — it's all just support and resistance lines. Where there are a lot of sellers, and where there are a lot of buyers." — Trader Steve, live stream, Oct 7, 2026 (translated from Korean) · ▶ Watch this moment (Short, Korean audio)
So this series treats harmonics as one way of measuring support and resistance with ratios. Their value is not in guessing pattern names but in narrowing down, with numbers, "where buying and selling are likely to bunch up."
5. A Real Example: The ETH 4-Hour Chart
On real charts, this series separates the default tolerance (±5% relative) from the registered exceptions listed in Harmonic Basics Part 2. Ratios that are already given as a range get no extra default tolerance.
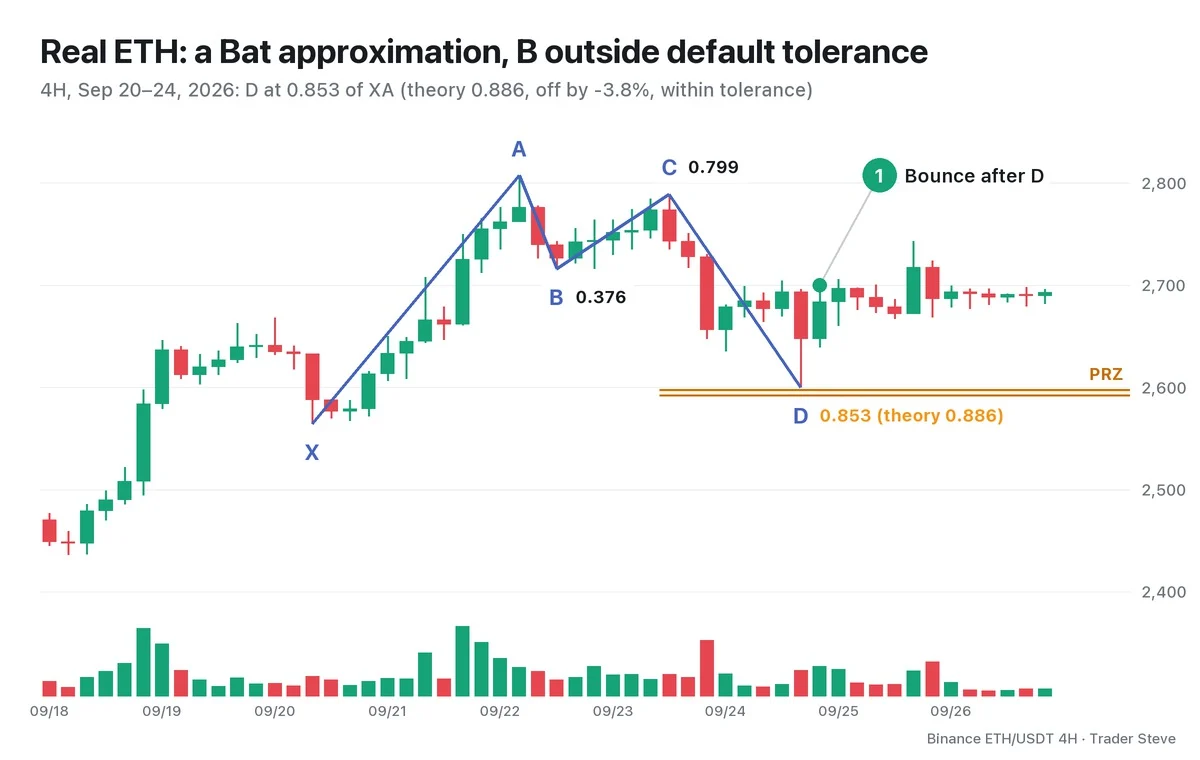
All the points were picked from swing highs and lows on the 4-hour chart.
| Point | Time (KST) | Price | Ratio |
|---|---|---|---|
| X | Sep 20, 09:00 | 2,564.33 | — |
| A | Sep 22, 05:00 | 2,807.34 | — |
| B | Sep 22, 13:00 | 2,715.91 | AB/XA 0.376 |
| C | Sep 23, 13:00 | 2,789.00 | BC/AB 0.799 |
| D | Sep 24, 17:00 | 2,600.15 | AD/XA 0.853, CD/BC 2.584 |
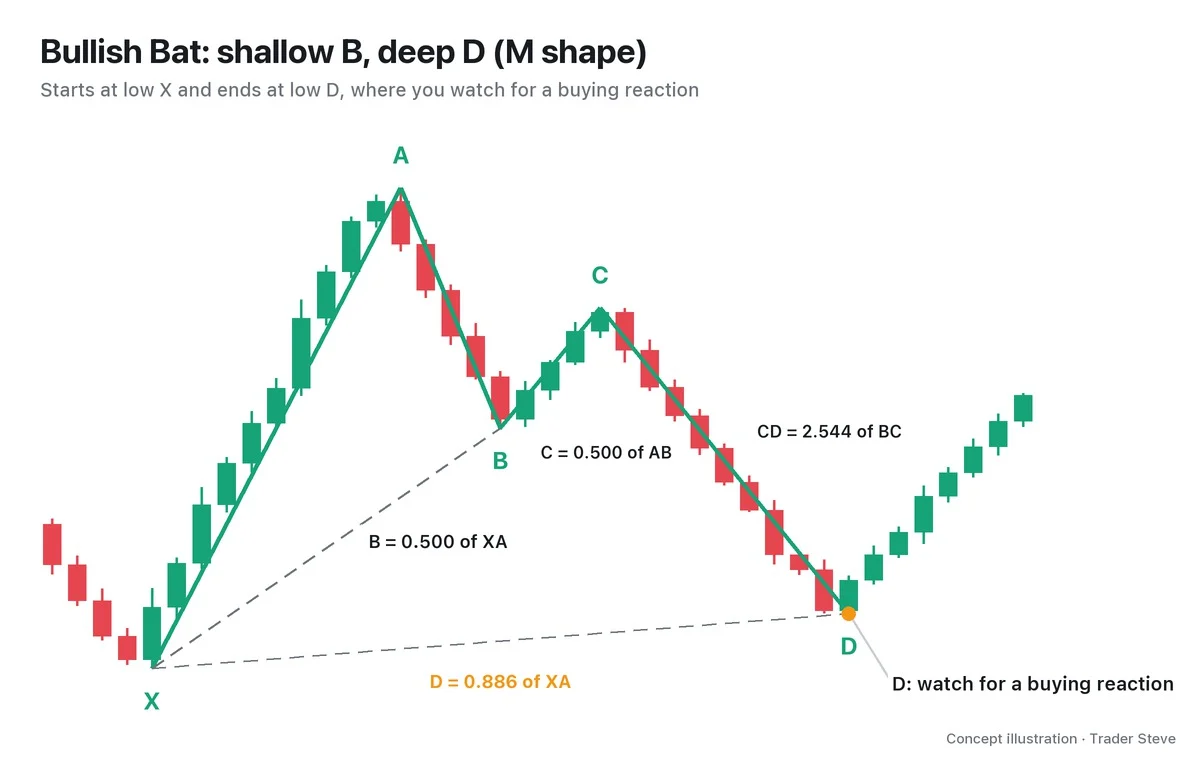
A shallow B at 0.376 of XA combined with a deep D near 0.886 is a shape close to a Bat. B at 0.376 is outside the default range (0.382–0.5), so this is an approximation outside the default tolerance. It does fall within the registered exception for the Bat (B 0.35–0.55), but it is not counted as passing the default criteria.
The PRZ is the zone formed by the XA 0.886 retracement at 2,592.0 and the BC 2.618 projection at 2,597.7. AB=CD (1:1) is far away at 2,697.6, so only two measurements overlapped in this case. The actual D stopped at 2,600.15, 2.5 above the upper edge of the PRZ. Price then bounced on the very next candle, at 21:00 on Sep 24, to the 0.382 retracement of the D→A distance (2,679.3), and by 17:00 on Sep 25 it reached the 0.618 retracement (2,728.2). For 30 candles after D, price did not fall below X.
One point needs stressing here. The PRZ is a candidate zone for a reversal, not a confirmed reversal point. In Part 4 we'll look at failures where every ratio fits and price still drives straight through.
The basis for the ratios is covered in Fibonacci retracement (see Basics Fibonacci, basics/fibonacci), how to pick the swings that become the points in Swing Highs and Lows and Trend (see Basics Swings and Trend, basics/swing-trend), and the view that harmonics are ultimately support and resistance in Basics Support and Resistance (related lesson).
Key Takeaways
- A harmonic pattern connects five swing highs and lows (X, A, B, C, D) and checks whether the ratios of the leg lengths match Fibonacci ratios.
- In a bullish pattern D is a low (M shape); in a bearish pattern D is a high (W shape). The math is the same.
- The PRZ is the price zone where different measurements cluster, such as the XA retracement, the BC projection and AB=CD.
- Harmonics are ultimately a tool for measuring support and resistance with ratios. The PRZ is only a reversal candidate, not a confirmed signal.
In Part 2, we'll cover the ratio table for each pattern and the order for drawing XABCD.
Picking swings and calculating three or four ratios by hand every time takes a fair amount of time. If you want an analysis that pulls several lines of evidence together in one place, take a look at the report below.
This lesson adapts the text, figures and live-stream quotes of the Trader Steve TA series for the web, translated from the original Korean. Check the text and figure captions for the timing and interpretation of each real example, and read conceptual diagrams and real charts separately.
Corrections: support@omnisight.report