What Is the Butterfly Pattern? A Harmonic Reversal That Goes Beyond X
Historical examples for learning · not current prices or trade recommendations.
Contents
In most harmonic patterns, the final point D finishes inside the starting point X. One pattern is different: D pushes beyond X, makes a new low (or a new high), and only then turns. That is the Butterfly pattern. This lesson uses charts to show what a Butterfly looks like, why traders look for a reversal at the spot where D runs past X, and what kind of pattern it really is.
All dates and times are Korea Standard Time (KST, UTC+9). A daily candle is dated by its 09:00 KST open; intraday times are each candle's open time.
1. The One-Line Definition: B Goes Deep, D Goes Past X
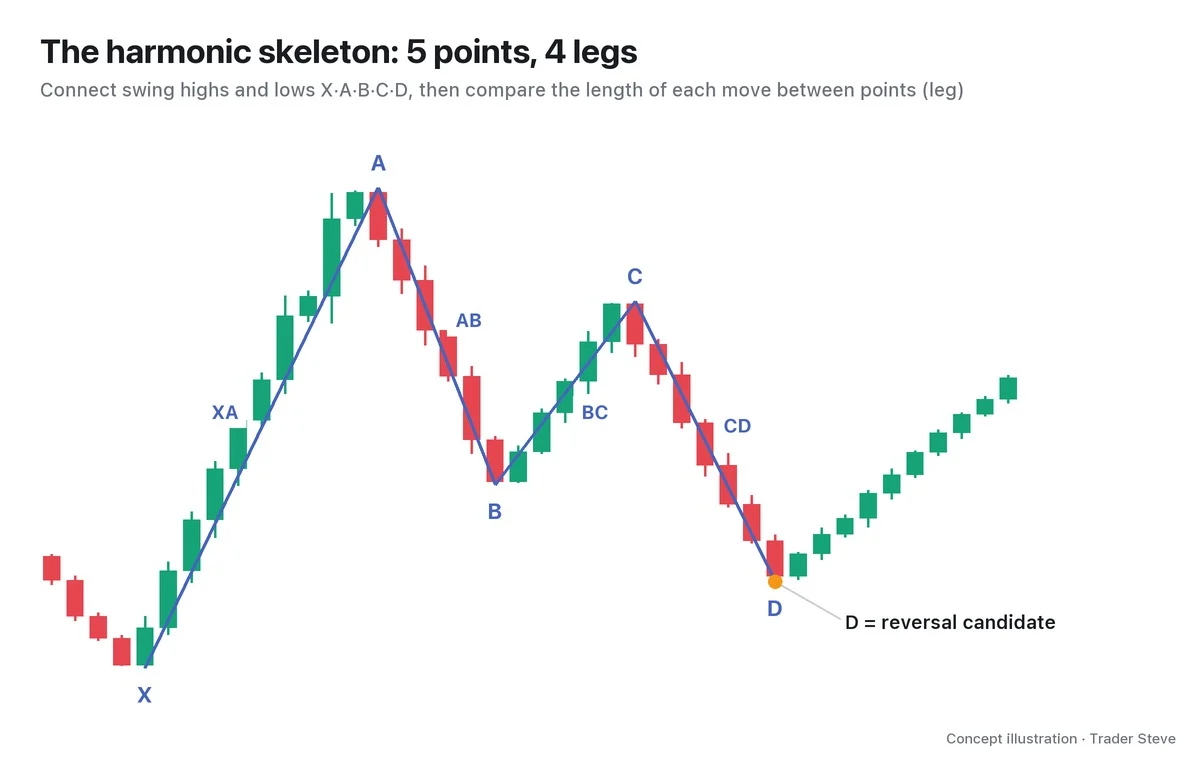
The Butterfly is a harmonic reversal pattern drawn through five points: X, A, B, C and D. It is generally credited to Bryce Gilmore, who first introduced it, with Scott Carney later defining its ratios. Two ratios give it its name.
- B: retraces about 78.6% (0.786) of the XA leg. That is a fairly deep retracement.
- D: runs past X to 1.27 times the length of the XA leg. This is not a retracement but an extension.
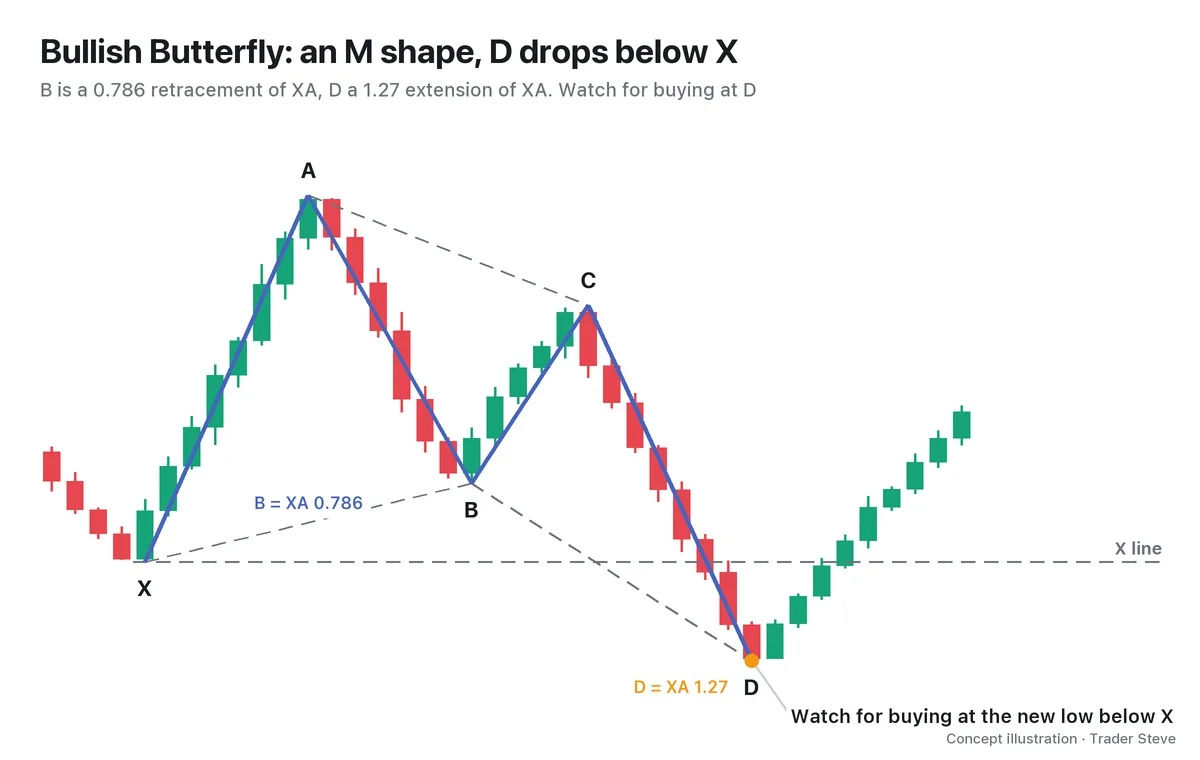
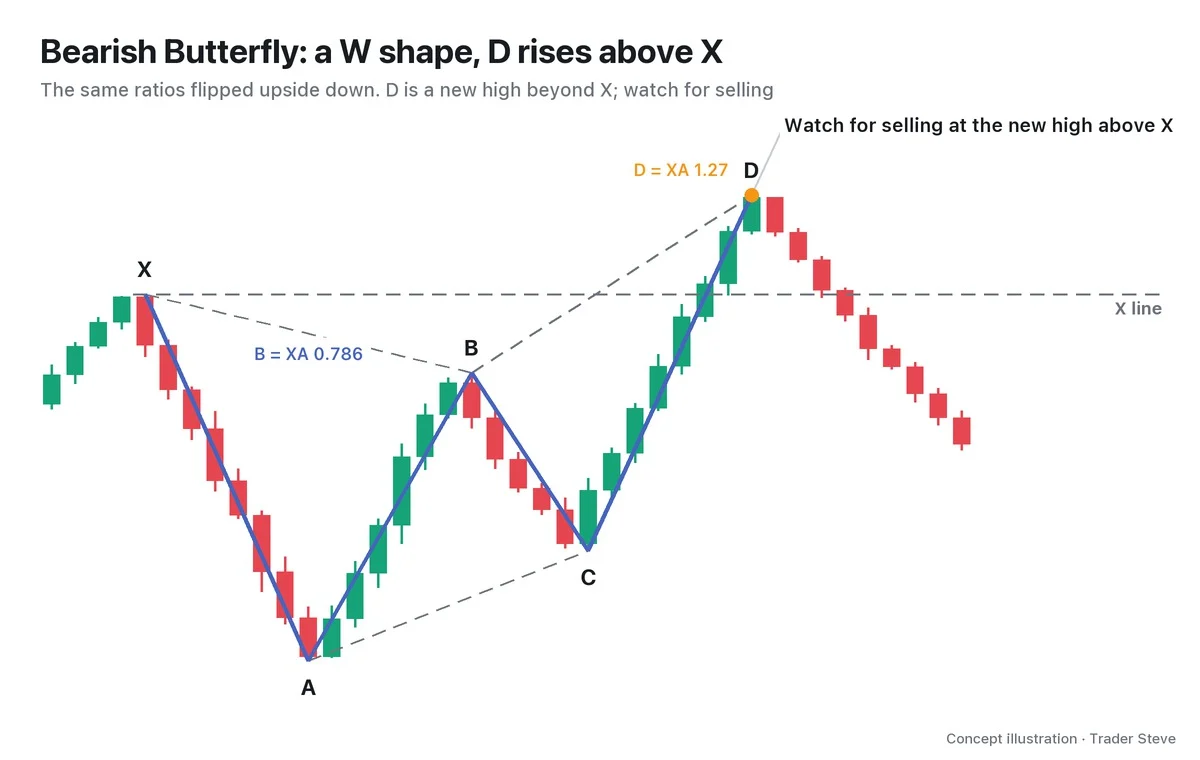
The four solid blue lines are the legs X→A→B→C→D, and the gray dashed lines are guides connecting XB, BD and AC. Once the guides are drawn, two triangles join like a pair of wings, which is where the name "Butterfly" comes from. C is a retracement inside the AB leg; in the illustration it sits at 0.618 of AB. Part 2 lays out the range for C and the rest of the ratio criteria in a table.
The thing to watch most closely in this pattern is where D sits relative to X. In the illustration, D has dropped below the X line. In other words, the spot where you look for a reversal only appears after X, which looked like a floor, has been broken once.
2. Bullish Butterfly (M) and Bearish Butterfly (W)
Like other harmonic patterns, the Butterfly comes in two directions.
| Type | Five points | Shape | Where D sits | Reaction to watch |
|---|---|---|---|---|
| Bullish Butterfly | X low → A high → B low → C high → D low | M | new low below X | buying |
| Bearish Butterfly | X high → A low → B high → C low → D high | W | new high above X | selling |
3. Why D Goes Beyond X
If B has retraced 78.6% of XA, price has given back nearly the entire rally. To anyone watching the chart, price came down close to X and then rose again, so it is easy to read X as a floor (a possible double bottom). Traders who enter off X then put most of their stops just below X.
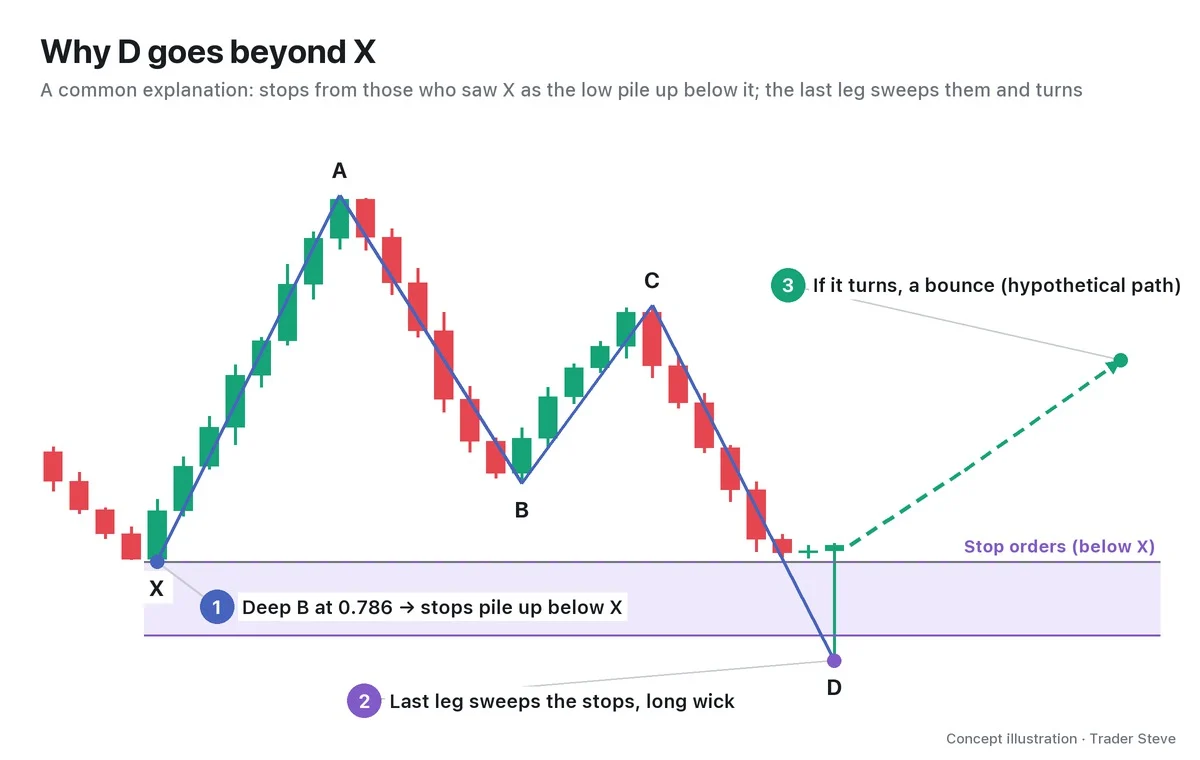
When the final leg after C (CD) breaks below X, the stop orders clustered under X fill all at once. Stops come out as market sell orders, so for anyone who wants to buy large size, that is a chance to absorb a lot at once. The usual way to explain the Butterfly is that D is the spot where price absorbs that stop-loss supply and turns.
But this is an interpretation — "this is how it is explained" — not a law. Price can just as easily sweep the stops below X and keep falling. Part 5 stacks the stop-order supply and liquidity sweeps together from an ICT perspective.
4. What Kind of Pattern It Is: Not a Prediction, but a Way to Measure a Countertrend Spot
D is the end of the prior move stretching out one more time. In a bullish Butterfly, it is the end of a decline that broke X and fell to a new low, so thinking about a buy there means a countertrend entry against the move that just happened. I once said this about countertrend spots on the live stream:
"When you get a picture where the direction turns completely and heads up like this, you're better off not going countertrend if you can help it. The right thing is to wait until that runaway upward trend has completely run its course. … And if it breaks through the upper wick, then it's goodbye." — Trader Steve, live stream, Aug 24, 2026 (translated from Korean) · ▶ Watch the stream highlights (Korean audio)
Applied to the Butterfly, this means that while the D leg is stretching out, you first check whether that stretch has ended, and if price breaks through the spot where you planned the reversal and keeps going, you drop the plan. You also check which way the bigger trend points.
"The big overall trend is still up. … So since this is a short taken countertrend, it honestly isn't a trade I'd really want to recommend. What's best? Wait until price comes down to here. … If the low below here breaks, that's the stop." — Trader Steve, live stream, Oct 12, 2026 (translated from Korean) · ▶ Watch this moment (Korean audio)
So the Butterfly is not a tool for calling "price will definitely turn here." It is a tool for measuring in advance a spot where, if price does turn, the stop is short and the target is far, so the risk-to-reward ratio is good. Waiting and the stop line come before the entry. Part 3 calculates exactly where to put the stop-loss and the targets.
5. One Look at a Real Chart: BTC Daily, Jun 2025
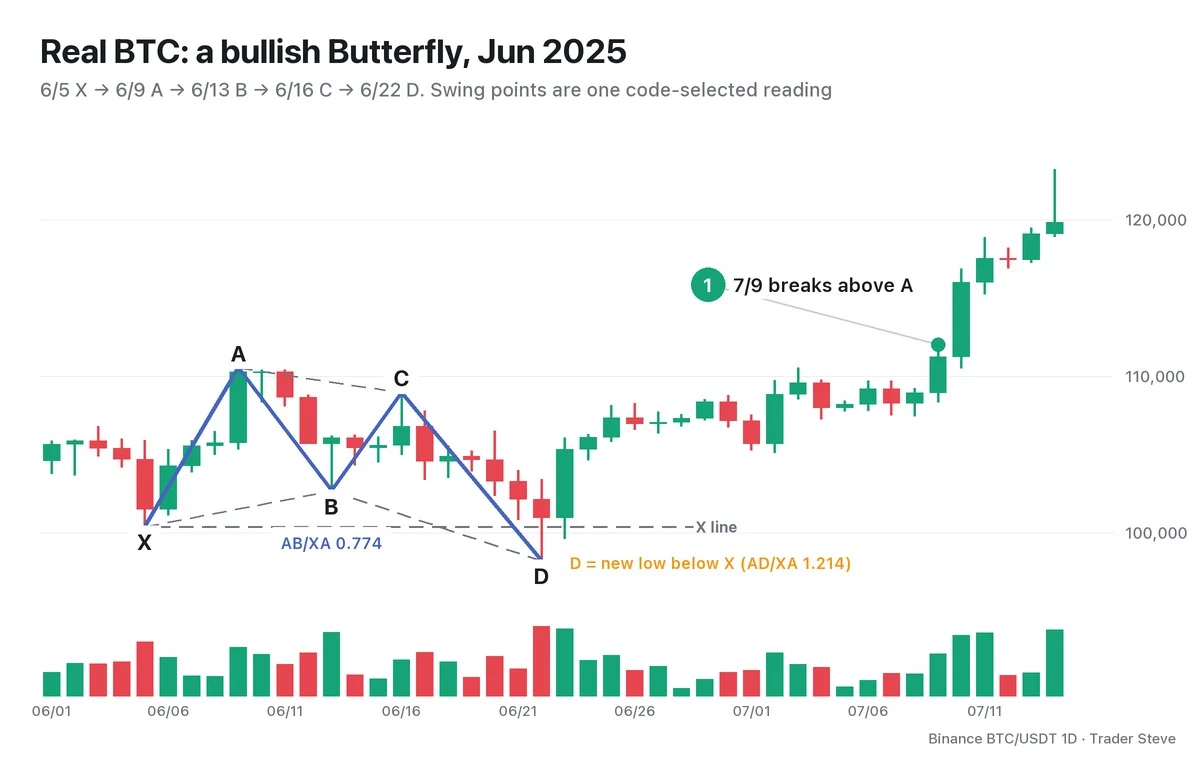
Picking the daily swing highs and lows of Bitcoin (BTC) with code and connecting the five points gives the following:
- X Jun 5 low 100,372 → A Jun 9 high 110,530
- B Jun 13 low 102,664 (AB/XA 0.774)
- C Jun 16 high 108,952 (BC/AB 0.799)
- D Jun 22 low 98,200 (AD/XA 1.214)
B is close to the textbook 0.786, and D is a new low about 2,170 below X. But D did not reach the textbook 1.27x (97,630); it stopped at 1.214x. Real charts rarely match textbook ratios exactly, and Part 2 sets out how much tolerance to allow.
Let's also check what came next. The next day, Jun 23, the high of 106,074 retraced more than 61.8% of the AD leg, and without going back below D in the meantime, price broke above the A high on Jul 9. Of course, this is an example picked after seeing the result. D is a swing that is confirmed only after the fact, so at the time it was nothing more than "a spot where price might turn."
Measure the same Jun 22 low against a bigger swing (May 6 low → May 22 high) and it retraces 0.741 of that rally, so it also reads as a Gartley. The same spot changes its name depending on which swings you take as X and A. Harmonic Gartley Part 5 (related lesson) covers this reading.
6. The One-Line Difference From the Gartley
The difference from the Gartley, the pattern it is most often confused with, fits on one line.
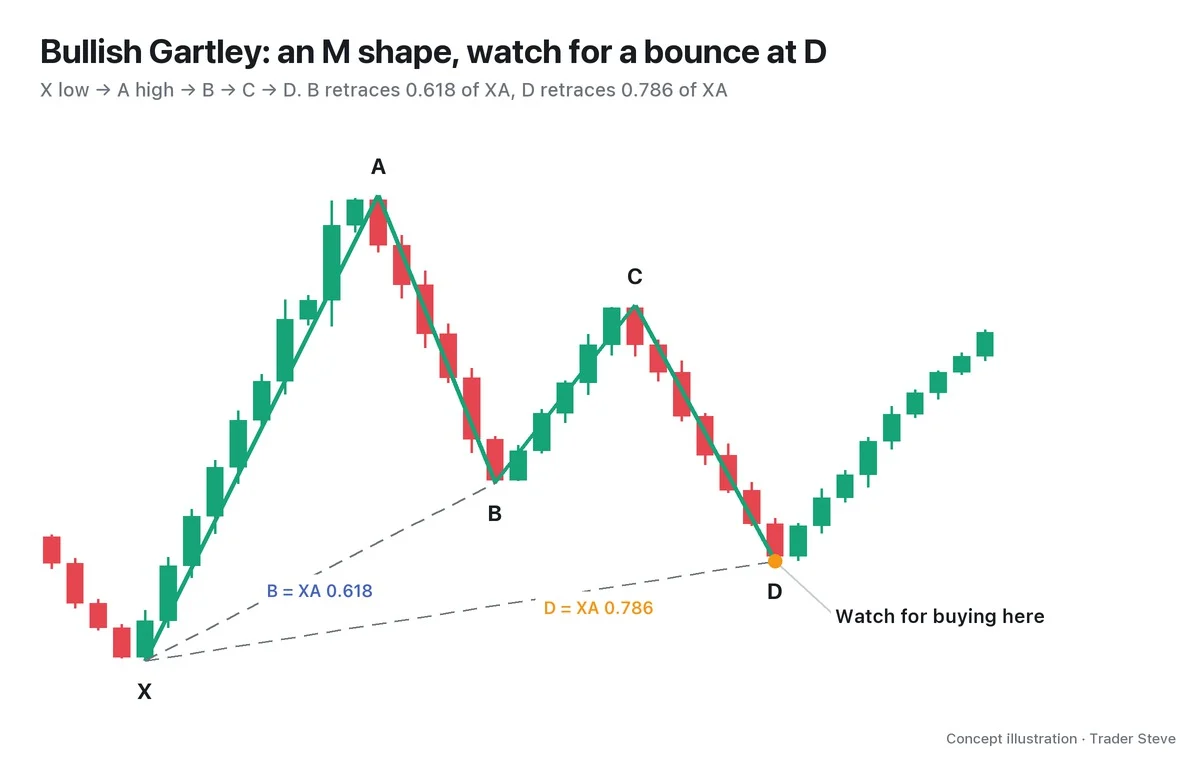
- Gartley: B at 0.618 of XA, D at a 0.786 retracement of XA. D stays inside X.
- Butterfly: B at 0.786 of XA, D at a 1.27 extension of XA. D goes beyond X.
Whether D has crossed X is the first dividing line you can see. Part 2 compares them in a table that includes the Bat and the Crab.
See also: Harmonic Basics (XABCD and the potential reversal zone (PRZ), harmonic/basics), Fibonacci retracement and extension (Basics Fibonacci, basics/fibonacci), and the liquidity sweep that runs through stop orders (ICT Liquidity Sweeps, ict/liquidity-sweep).
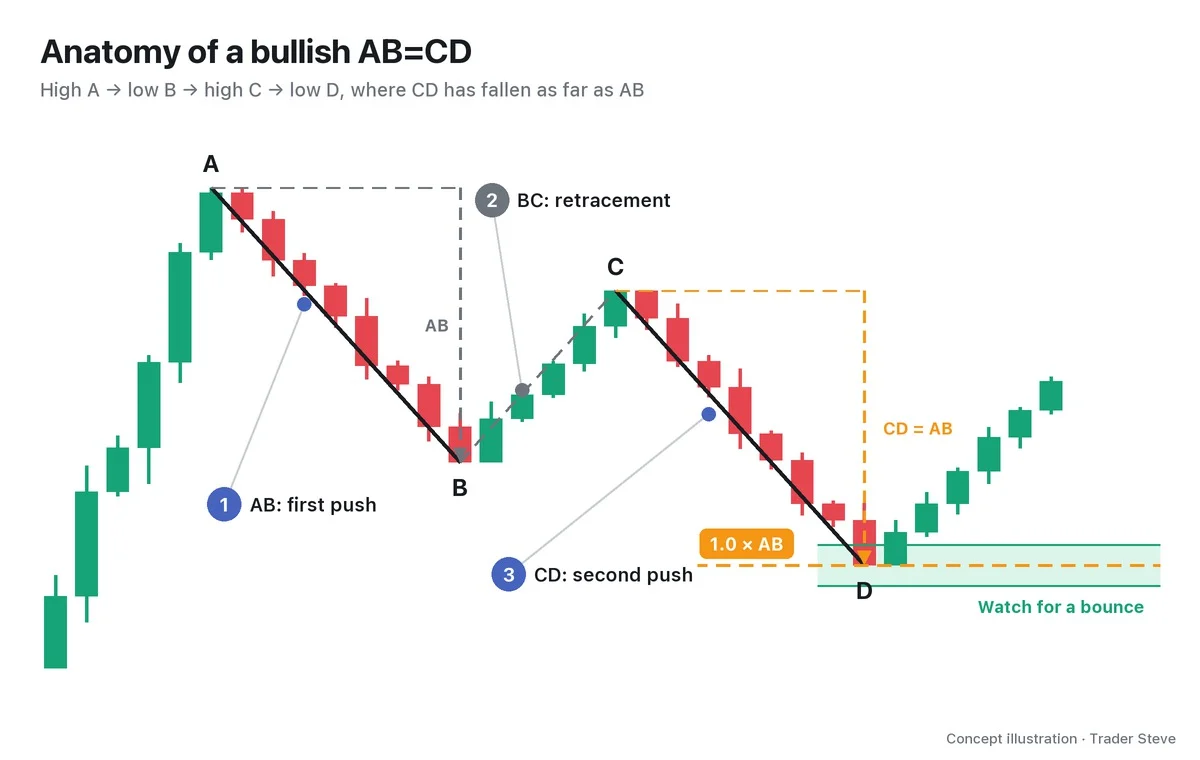
The shared case H-BTC-2025-06-BF is the BTC daily chart X 100,372 → A 110,530 → B 102,664 → C 108,952 → D 98,200. The same case group, H-BTC-2025-06, is measured by Harmonic AB=CD Part 4 (related lesson) as equal-length legs across four points, and by Gartley Part 5 (harmonic/gartley/blog05, H-BTC-2025-06-G) with a larger XA.
Key Takeaways
- The Butterfly is a five-point XABCD harmonic pattern: B is a 0.786 retracement of XA, and D is a 1.27 extension of XA.
- The bullish version is an M shape with D at a new low below X; the bearish version is a W shape with D at a new high above X.
- A common explanation for D going beyond X is that it sweeps the stop orders stacked past X and turns, but it is not a law.
- It is a countertrend pattern that goes against the prior move, so waiting and the stop line come before any attempt to call the turn.
- Real charts don't match textbook ratios exactly (D on the Jun 2025 BTC daily chart was 1.214). Check the numbers.
In Part 2, we'll cover checking the Butterfly's ratios leg by leg, the order in which to draw it, tolerance, and a checklist.
This lesson adapts the text, figures and live-stream quotes of the Trader Steve TA series for the web, translated from the original Korean. Check the text and figure captions for the timing and interpretation of each real example, and read conceptual diagrams and real charts separately.
Corrections: support@omnisight.report