Harmonic PRZ Confluence: Why Stack Divergence and ICT on the Same Zone
Historical examples for learning · not current prices or trade recommendations.
Contents
Harmonic Basics Part 5 (related lesson) previewed spots where prior-low liquidity and a fair value gap (FVG) overlap the potential reversal zone (PRZ). Ratios converging only tells you where to look. This lesson uses charts to show what harmonics, divergence and ICT each tell you, and why you read them together at the same spot.
1. What Happens When You Look at the PRZ Alone
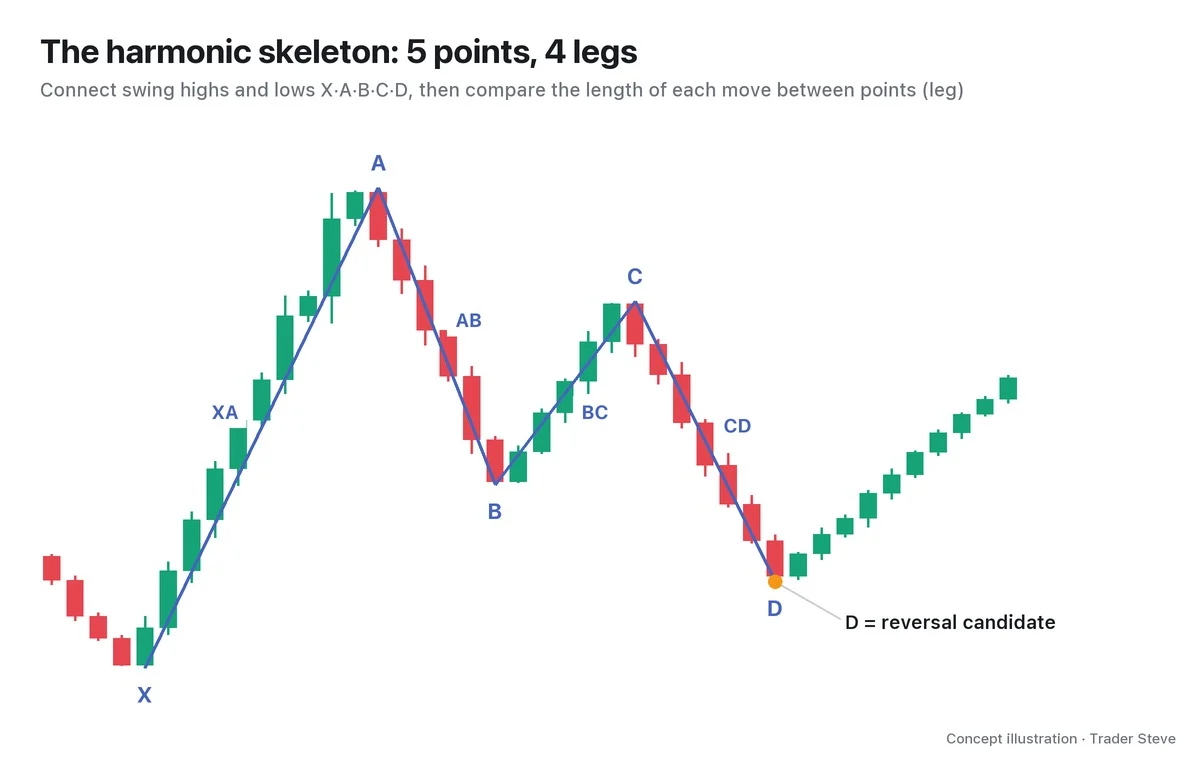
The potential reversal zone (PRZ) is a band where prices measured with several ratios cluster together. A harmonic pattern connects five swing points — X, A, B, C and D — and narrows down the zone where D is likely to land.
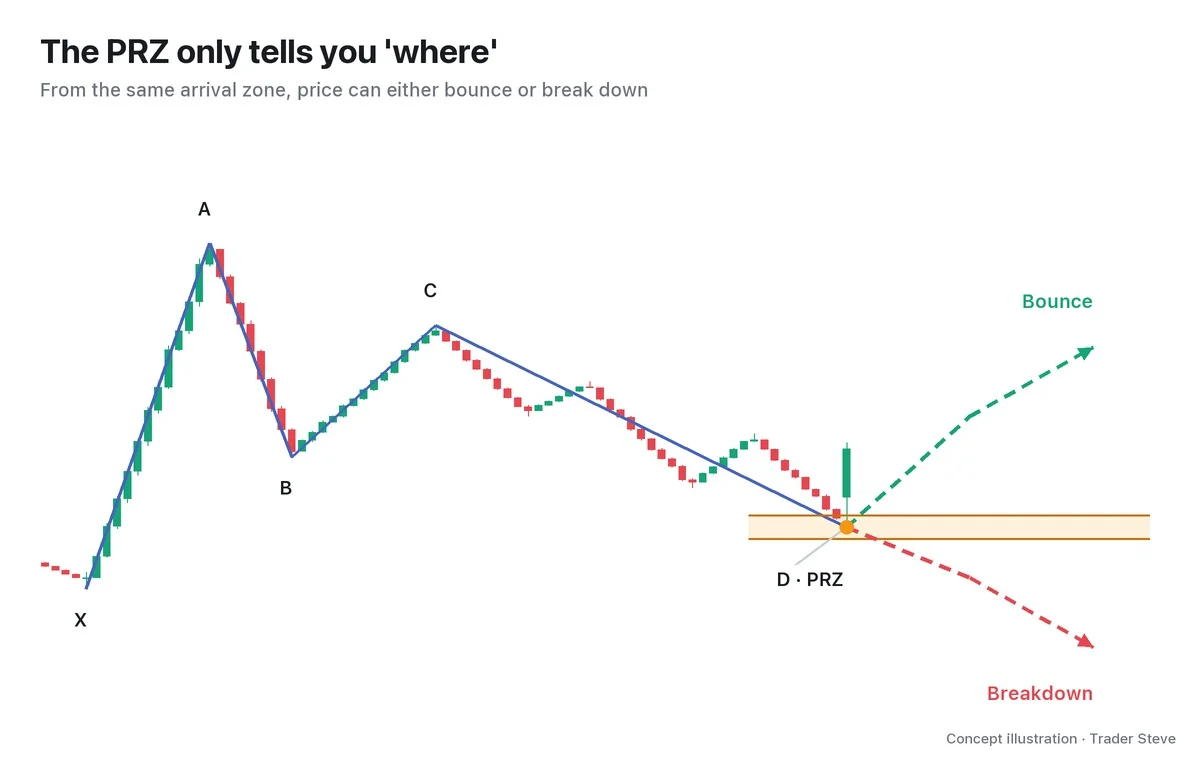
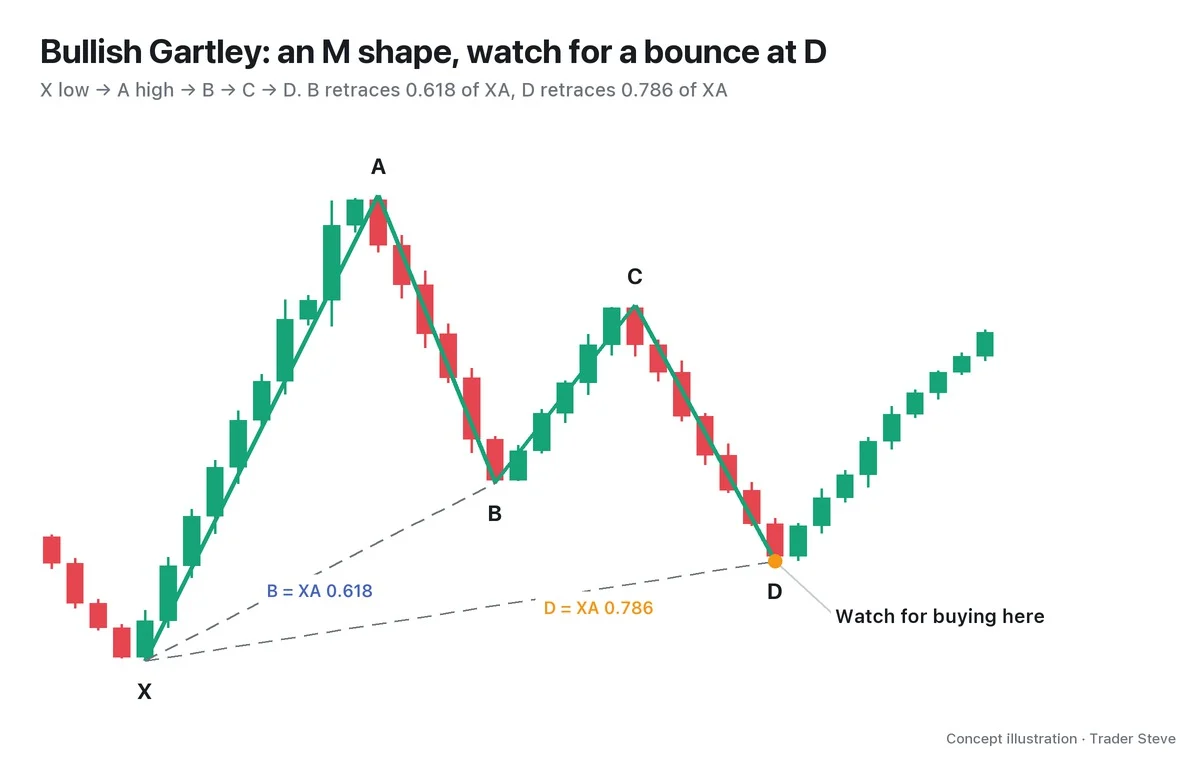
The Gartley-style pattern in the figure runs X 100 → A 130 → B 111.46 → C 122.92 → D 105.4. The prices measured by the XA retracement, the BC projection and AB=CD cluster at 104.38–106.42. The band is 6.8% of the XA length wide.
Yet price can come down to the same band and turn one time, then keep getting pushed lower the next. Think of the PRZ as a destination circled on a map. A bus doesn't stop automatically just because it reached the destination. You also have to see whether it slowed down and whether the driver actually hit the brakes. Adding those two checks is what this part is about.
2. What Confluence Means: Answers to Different Questions Overlapping
Confluence is when evidence that answers different questions overlaps at the same price zone and the same time. On a live stream, I explained why I look at several perspectives together:
"Sometimes it works and sometimes it doesn't. So I threw all of it in. Like bibimbap — like stone-pot bibimbap — I threw everything in, then found the strongest reference lines I could, where the perspectives overlap: the so-called confluence zone." — Trader Steve, live stream, Oct 7, 2026 (translated from Korean) · ▶ Watch this moment (Korean audio)
The key word here is "overlap." Putting three names on the same Fibonacci line is not the same as checking ratios, momentum and price action separately.
| Layer | Question it asks | Tool to check |
|---|---|---|
| ① Harmonics | Where should I look? | The PRZ where ratios converge |
| ② Divergence | Has momentum faded? | Comparing lows/highs of price and the Relative Strength Index (RSI) |
| ③ ICT | Who moved price? | The candle close after a sweep, the structure shift, the FVG |
Harmonics show the location, divergence shows the momentum, and ICT shows the footprints. You are matching up the answers to several questions — not picking the spot with the most names on it. The quote describes stacking several perspectives; it is not a description of harmonic trading.
3. Reading All Three Layers on One Chart
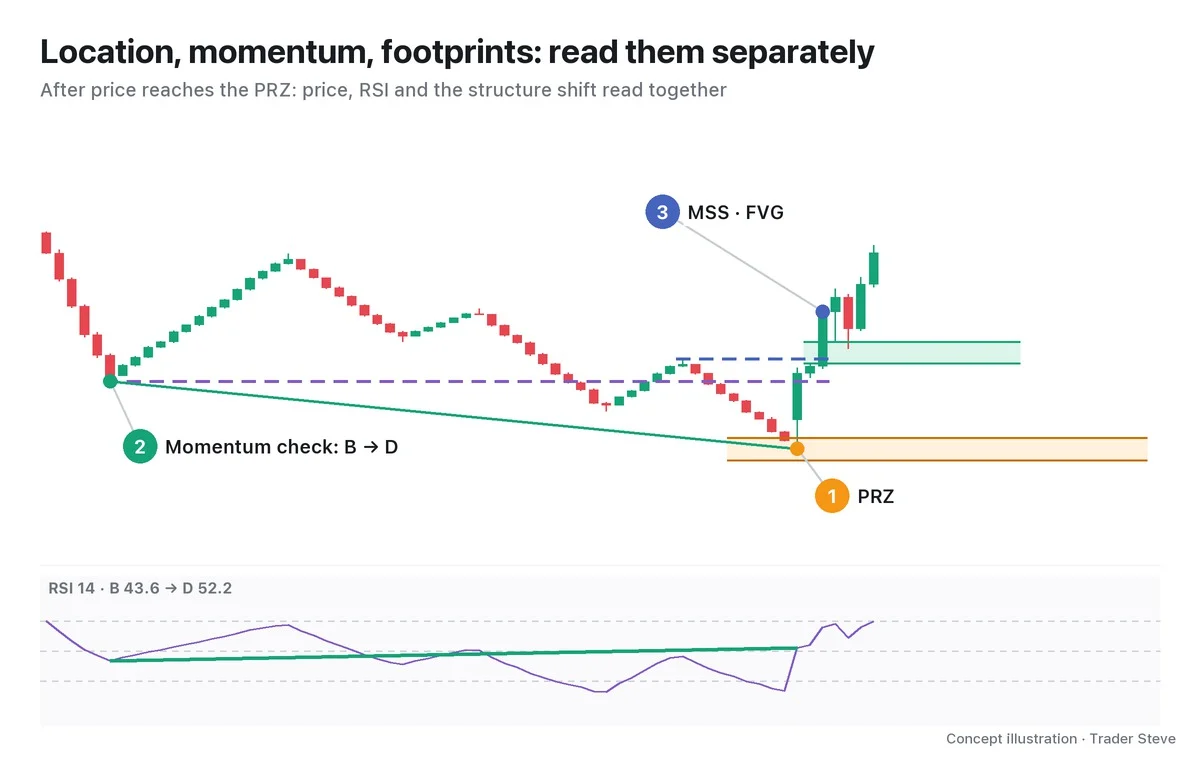
- ① Location: price has come down to the orange band. First, watch what happens in the zone where the ratios converge.
- ② Momentum: price made a D lower than B, but the Relative Strength Index (RSI) 14 rose from 43.6 at B to 52.2 at D. A lower low in price with a higher low in the indicator is called a regular bullish divergence. The figure is an example that compares B and D directly, even though they are far apart.
- ③ Footprints: D pushed below B and closed back inside, then price closed above the last bounce high inside CD. Read this market structure shift (MSS) together with the fair value gap (FVG) left by a strong-bodied candle.
If the indicator flagged the change in momentum first, the last layer shows price itself turning around. When ICT asks "who moved price?", it means reading these order footprints. Candles alone can't identify who placed the orders.
Comparing price with the indicator continues in Divergence Basics (related lesson), and the empty range between three candles continues in ICT FVG (related lesson). For now, it's enough to remember that the three layers do different jobs.
4. Why Harmonic D So Often Meets Liquidity
Below a prior low, stop-loss orders from existing buyers and orders that chase a break of the low can pile up. This is called sell-side liquidity (SSL). A move that pokes below the prior low and comes back is a liquidity sweep.
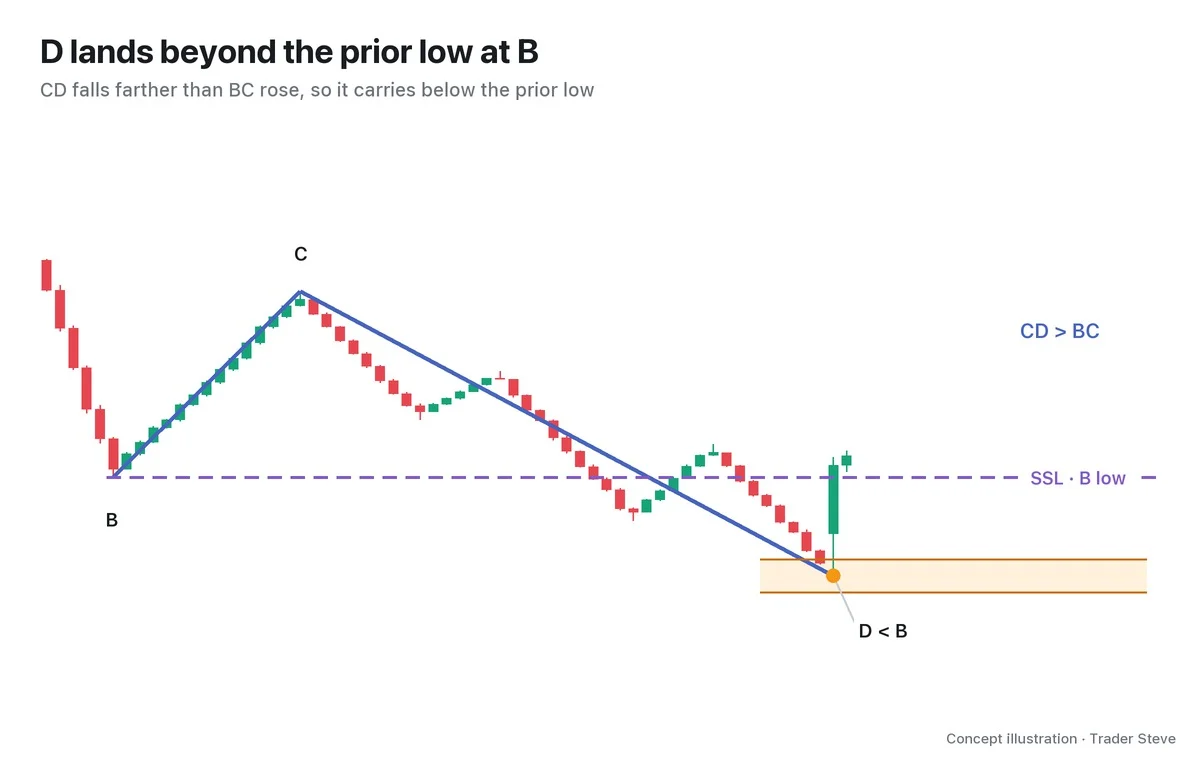
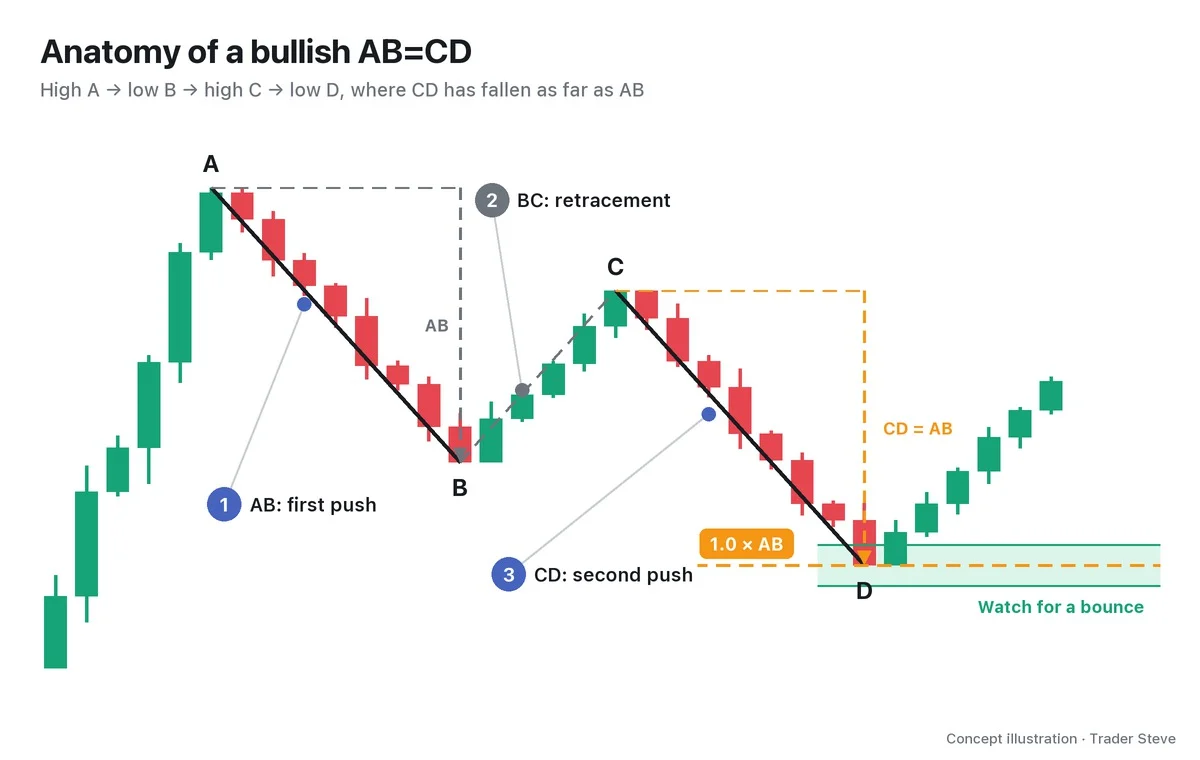
In classic XABCD structures such as the Gartley, Bat, Butterfly and Crab, where CD is 1.272x BC or more, D necessarily goes beyond B. It travels farther than the distance from C back to B. In the figure, too, CD/BC is 1.529, so D at 105.4 is lower than B at 111.46.
The extension patterns, the Butterfly and the Crab, go past the starting point X as well. Bearish patterns do the opposite and go above the prior high. This is a structural reason harmonics and ICT so often point to the same place.
Still, breaking a low and coming back are two separate facts. If the wick goes below the low but the candle closes back inside — a swing failure pattern (SFP) — it leaves a footprint showing price poked below and then reversed. ICT Liquidity Sweeps (related lesson) covers this in more detail.
5. Real BTC: A Low Where the Answers to Three Questions Came Together
This is the Bitcoin (BTC) 12-hour chart from Jan 20 to Feb 20, 2023. It is an approximate bullish Deep Crab, picked after seeing the later candles.
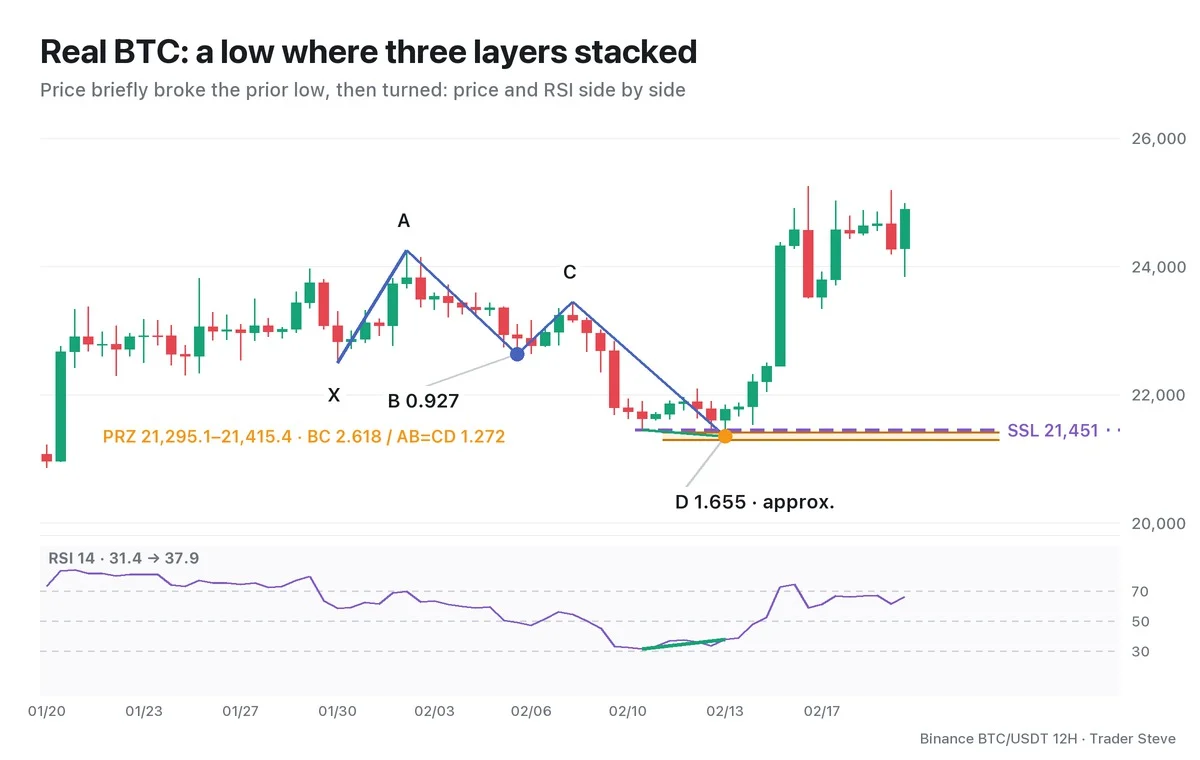
- Location: X Jan 30 21:00 → A Feb 2 09:00 → B Feb 6 09:00 → C Feb 8 09:00 → D Feb 13 21:00. B's AB/XA is 0.927, 4.6% larger than the textbook 0.886, and D's AD/XA is 1.655, 2.3% larger than 1.618. That's why I classify it as an approximation. The three measurements converge within 6.9% of XA.
- Momentum: price fell from the 21,451.00 low at 21:00 on Feb 10 to D at 21,351.07, but RSI on the same two candles rose 31.4→37.9.
- Footprints: the D candle wicked below the prior low and closed at 21,773.97. An old bullish FVG of 21,219.6–22,422.0, created by the 21:00 candle on Jan 20, also overlapped the PRZ. At 21:00 on Feb 14, price closed above 22,090, the last bounce high inside CD, confirming the MSS. All times are Korea Standard Time (KST, UTC+9).
On the zigzag, D is confirmed only after 4 more candles have passed. The D and the divergence in the figure are points marked in hindsight; at the time, you would have had to check each candle close and the move that followed, one by one. This historical chart case is separate from the live stream quoted above.
"In the big picture, a zone like this can be called a confluence zone. Because several perspectives overlap there, the report gives guidance that it's a zone worth a try." — Trader Steve, live stream, Oct 7, 2026 (translated from Korean) · ▶ Watch the stream highlights (Korean audio)
As the phrase "worth a try" suggests, overlap adds evidence for your decision. Even when all three layers line up, the reversal is not confirmed.
If PRZ width / XA is 5% or less, it is strict convergence; more than 5% up to 10%, relaxed convergence; more than 10%, no convergence. The width is the difference between the lowest and highest of the calculation lines stated in each chart.
Key Takeaways
- The PRZ is a band that narrows down where to watch for a reaction.
- Divergence compares two swings in the same direction to see whether momentum has faded.
- Because D goes beyond the prior swing, harmonic zones and liquidity often meet.
- The candle close after a sweep, the MSS and the FVG are footprints left by price.
- On real charts, keep approximate ratios and a D confirmed in hindsight separate.
In Part 2, we'll cover the order for checking the three layers one by one, with a checklist.
If repeating this process across many markets feels tedious, the Omnisight Report, which pulls several perspectives together, is worth a look.
This lesson adapts the text, figures and live-stream quotes of the Trader Steve TA series for the web, translated from the original Korean. Check the text and figure captions for the timing and interpretation of each real example, and read conceptual diagrams and real charts separately.
Corrections: support@omnisight.report