What Is the Crab Pattern? A Harmonic Reversal at the 1.618 XA Extension
Historical examples for learning · not current prices or trade recommendations.
Contents
Every so often on a chart, price breaks the prior low, keeps falling for a long way, and then comes back with a long wick. The Crab pattern is a harmonic pattern that looks for a possible reversal at the end of a move like that, one that has stretched far beyond its starting point. This lesson uses diagrams to cover the two shapes of the Crab, how the Deep Crab differs, and why the last leg runs so unusually long.
All dates and times are Korea Standard Time (KST, UTC+9). A daily candle is dated by its 09:00 KST open. Intraday times are the open time of each candle.
1. The One-Line Definition: Five Points, with D Going Beyond X
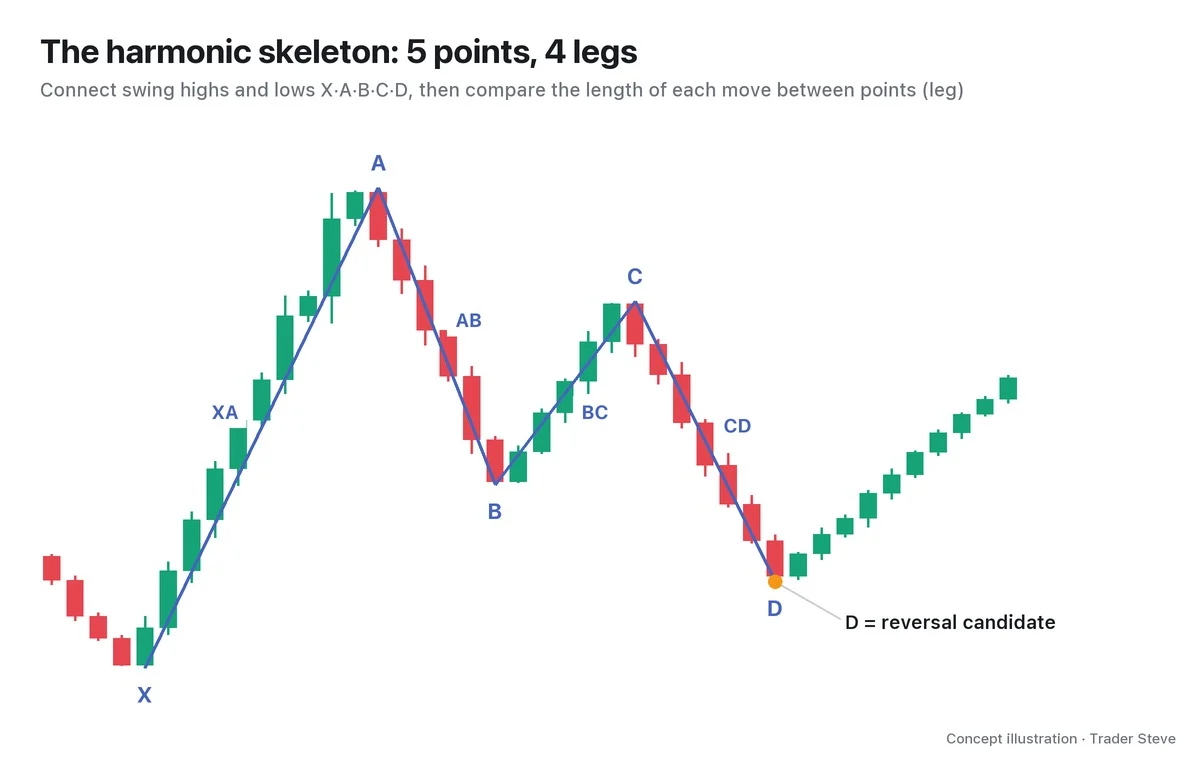
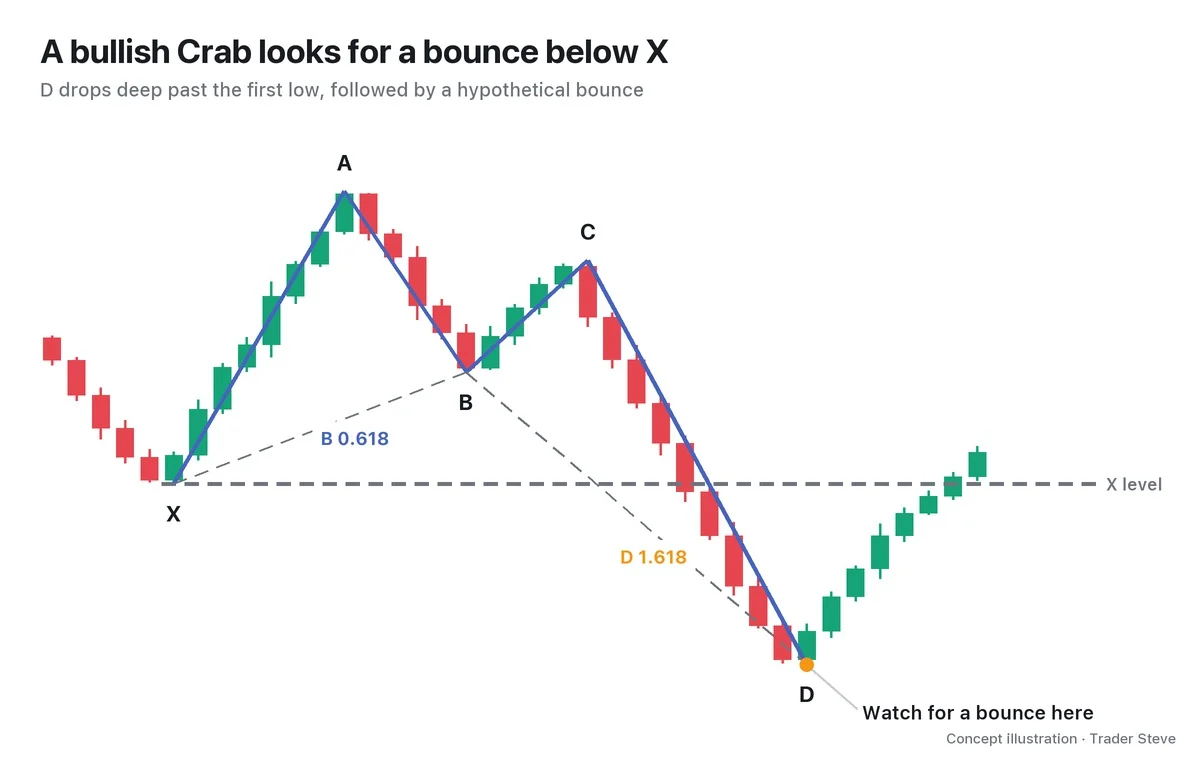
The Crab is a pattern that connects five swing points, X, A, B, C and D, and looks for the spot where D stretches to the 1.618 extension of XA.
- XA: the first rise, from the X low to the A high.
- B: the low that retraces part of that first rise. For the Crab, the standard is 0.382–0.618 of XA.
- C: the high where price rises again from B but stays inside A.
- D: the endpoint, where price comes a long way down from C and makes a new low below X.
Here, 1.618 is the length of AD divided by the length of XA. X is where price, coming down from A, has given back the whole first rise; D forms after price falls further still. If you read it as "price falls another 1.618x XA below X," you will measure the depth wrong.
Think of standing a tape measure next to the first step of a staircase: it measures all the way down past the starting floor, X. Remember the Crab as the pattern in which D travels especially far. The basics of the five points and the potential reversal zone (PRZ) are covered in Harmonic Basics (related lesson).
2. The Bullish and Bearish Versions Are Mirror Images
A Crab is named for the reaction you watch for at D, not for the direction the final CD leg moved.
| Type | Shape of the five points | Where D sits | What you watch for at D |
|---|---|---|---|
| Bullish Crab | M shape | a new low below X | whether the deep drop stops and bounces |
| Bearish Crab | W shape | a new high above X | whether the sharp rally stops and gets pushed back |
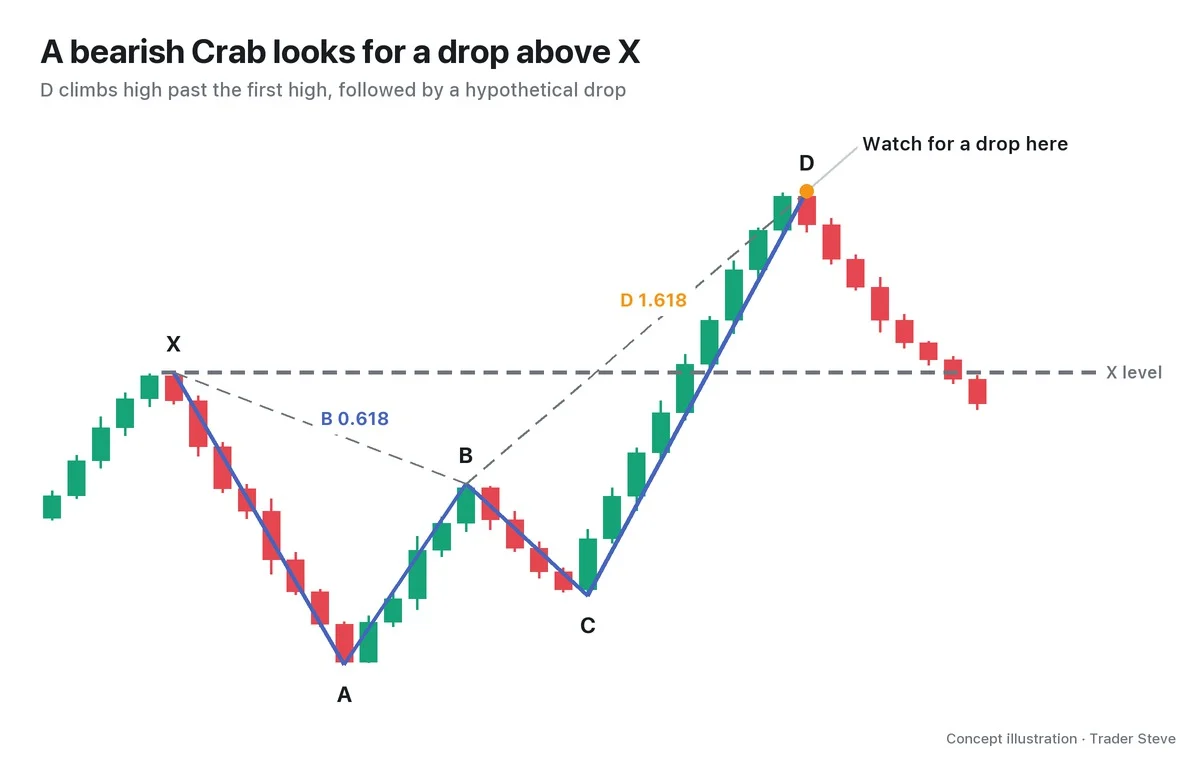
The bullish version looks for a bounce after price breaks a low; the bearish version looks for a drop after price clears a high. The heart of a bullish Crab is watching where price stops after it has come all the way down.
3. In a Deep Crab, B Comes Down Close to X
The Deep Crab is a variation in which B retraces deeply, to 0.886 of XA. In the bullish version, B comes down close to the first low, X, so the two lows look like a double bottom.
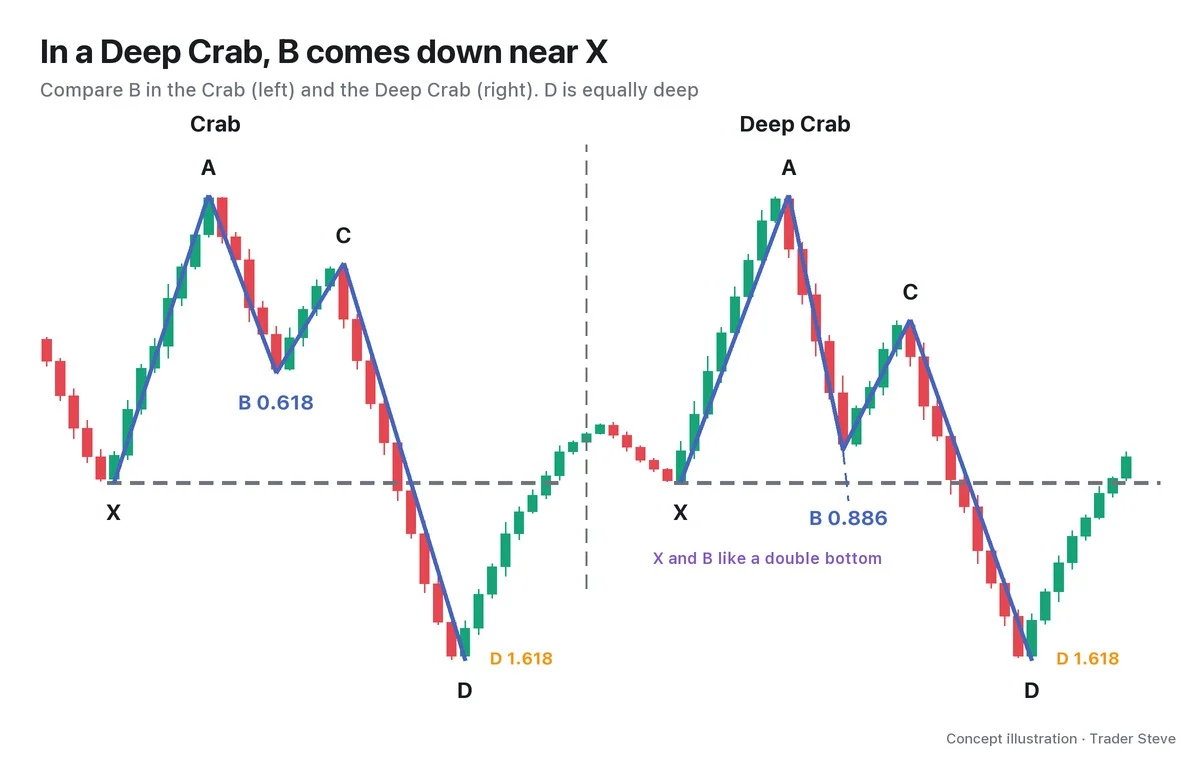
B is what tells the two apart; for both, the D standard is 1.618 of XA. B comes close to X, price rises to C, and then the final CD leg pushes beyond both lows.
Rather than memorizing the whole ratio table from the start, I tell people to check two things first: "How far back did B come?" and "Did D go beyond X?" The formal ranges and the drawing steps are covered in Part 2.
4. Why the Last Leg Travels So Far
In the bullish version, X is the low where the earlier bounce began. Traders who bet on a rise with that area as their reference may place stop-loss orders below X. When B comes back down close to X, as in a Deep Crab, orders that use the area below both lows as their stop reference can pile up as well.
If price breaks below that area, stop-loss selling and forced liquidations can overlap and make the drop steeper. The long CD of a Crab is explained as a final move that sweeps through the size sitting beyond X in one pass. In the bearish version it works the other way: short stop-loss and liquidation orders above X can push the rally even higher.
What you watch for here is price stabbing deep and then recovering with a wick. On a live stream, I described a move of this kind that I was hoping for. It was not a comment about the Crab itself; it was the move I wanted to see in Bitcoin (BTC) at the time.
"This move has to finish within a day. Within a day, on the daily chart, it stabs all the way down like this, then puts in a wick and pushes back up… a move with that kind of feel, where it rips up on the daily, fakes one more little step down, and then goes straight up — don't we need something like that? Personally, I'm really hoping for that, even praying for it, but I don't know how it'll go." — Trader Steve, live stream, Aug 26, 2026 (translated from Korean) · ▶ Watch the stream highlights (Korean audio)
Candles alone cannot tell you who owns the orders or how large the liquidations were. Treat this as an explanation that helps you understand how size builds up and gets absorbed. This idea connects to ICT Liquidity Sweeps (related lesson).
5. A First Look at the Real Shape: A New BTC High
Let's look at the Bitcoin (BTC) 12-hour chart from summer 2025. This is an approximate case picked after the outcome was known, and D, too, is a swing confirmed only after later candles printed.
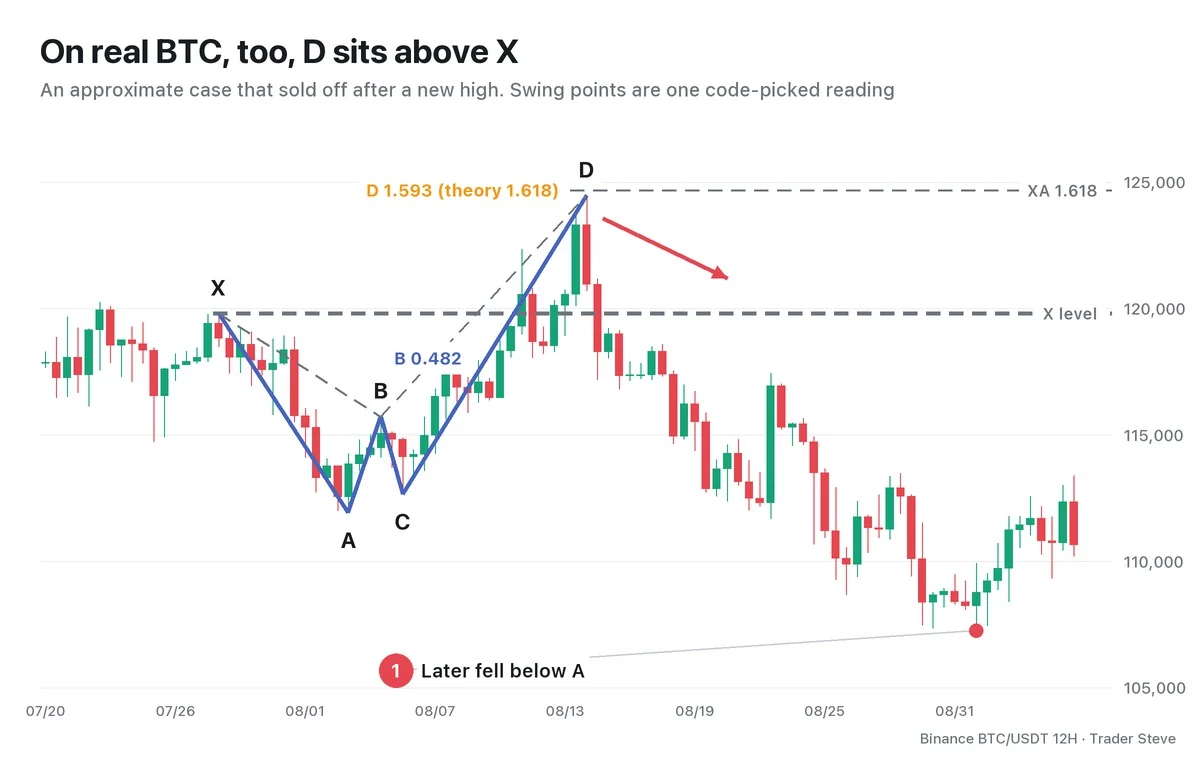
- X is 119,800 on Jul 28, and A is 111,920 on Aug 3.
- B is 115,720 on Aug 4. AB/XA is 0.482.
- C is 112,650 on Aug 5, and D is 124,474 on Aug 14. D went beyond X and set a new all-time high on Binance at the time.
The extension at D is 1.593, slightly short of the theoretical 1.618. The calculated XA 1.618 price is 124,669.84, and the actual D stopped 195.84 below it. On the other hand, the final CD divided by BC is 3.851. That exceeds not only the textbook upper bound of 3.618 but also this series' tolerance upper bound of 3.80, so I do not call this a complete, textbook Crab.
Price was pushed lower afterward, and on Aug 22 it fell below A. The lesson here is the habit of recording both where D landed outside X and which ratios fell outside the standard.
Here is a comment about the end of an extension on a different asset. It is not a verdict on the BTC chart above or on a Crab.
"If you weigh it purely on risk-to-reward right now, it's an almost absurdly good spot to short. A truly ridiculous spot. … The retracement probably hit exactly 1.618 — wow, uncanny. A picture where it taps the 1.618 retracement exactly and comes down." — Trader Steve, live stream, Aug 28, 2026 (translated from Korean) · ▶ Watch the stream highlights (Korean audio)
Read the "1.618 retracement" in this quote as a 1.618 extension beyond the initial move. The point is to look at the end of an extension through the lens of risk-to-reward. With a Crab, too, you check the actual reaction at D and the ratios separately.
6. D Sits at a Different Depth from the Other Patterns
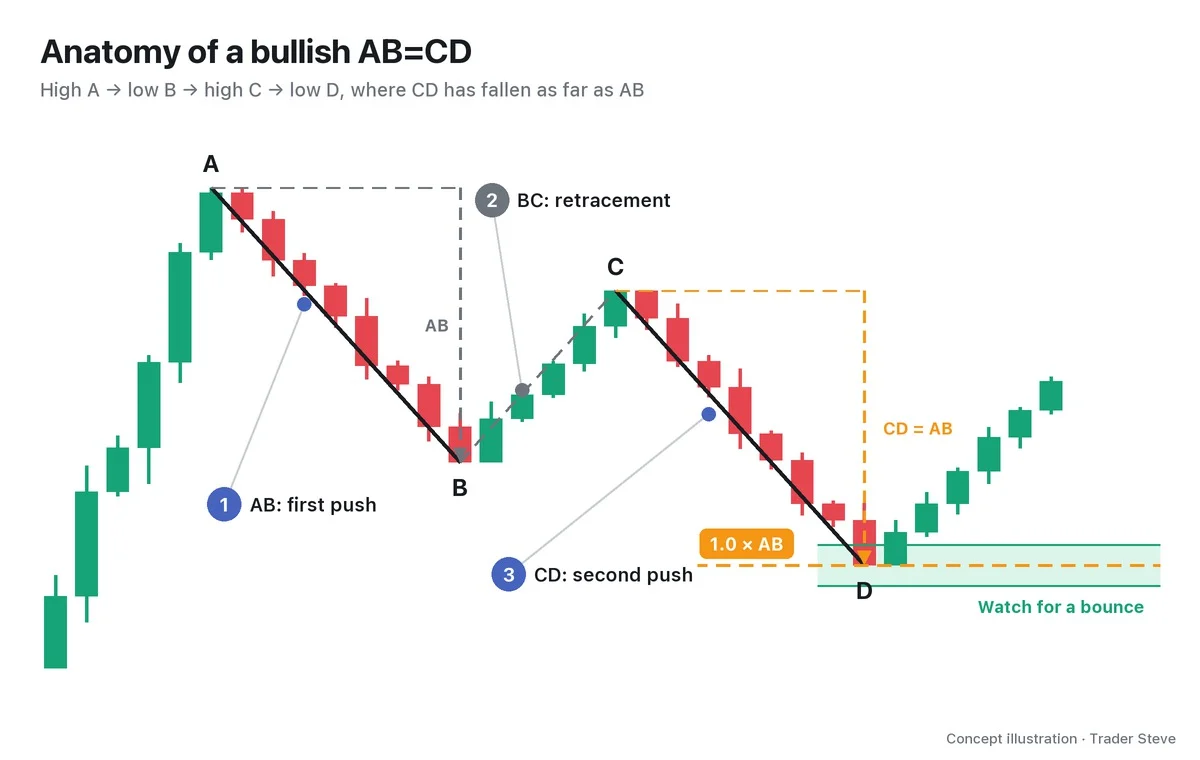
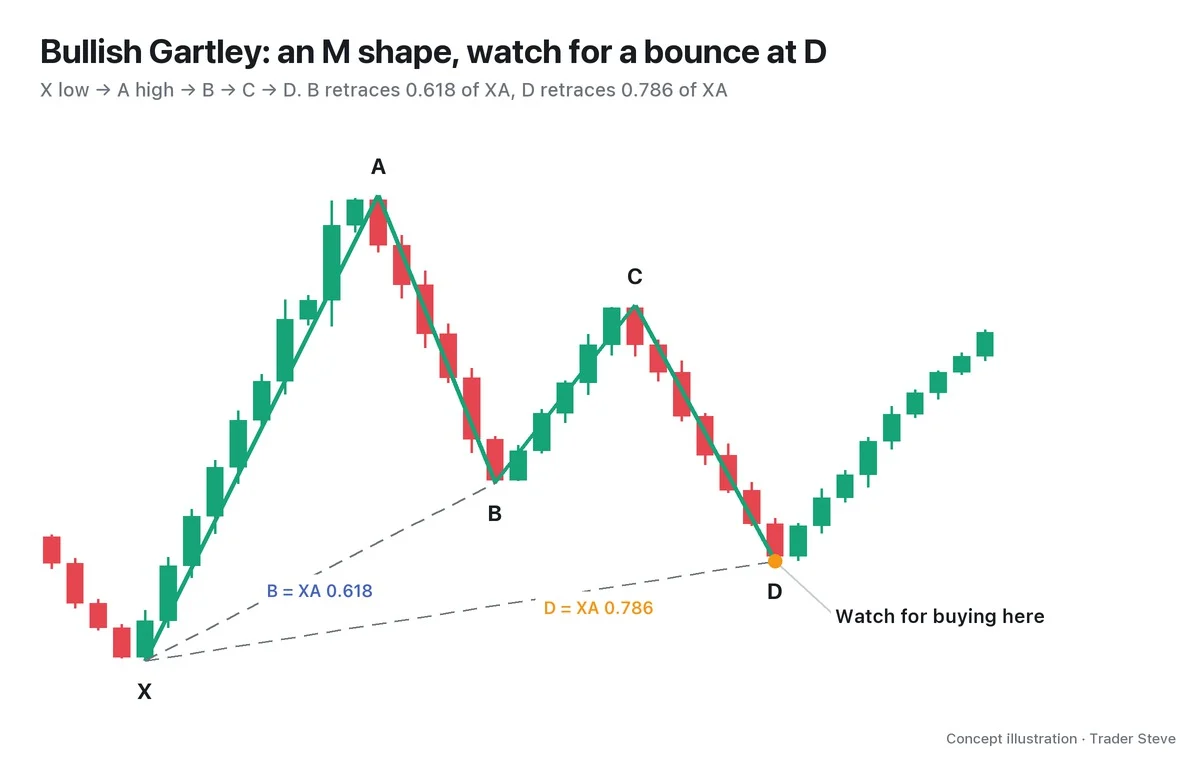
Comparing just the headline D standard in one line: Gartley at 0.786 of XA, Butterfly at 1.27, Crab at 1.618. As you move from an inner retracement to an outer extension, the endpoint gets farther away. For more, read Harmonic Butterfly (related lesson), which covers the 1.27 extension, and Basics Fibonacci (related lesson) for how the ruler is laid out. The concept ratios can also be checked against Scott Carney's descriptions of the Crab and Deep Crab.
If PRZ width / XA is 5% or less, it is strict convergence; more than 5% up to 10%, relaxed convergence; more than 10%, no convergence. The width is the difference between the lowest and highest of the calculation lines stated in each chart.
Key Takeaways
- The Crab is a five-point pattern in which D goes beyond X and stretches to 1.618 of XA.
- The bullish version watches for a reaction at a new low below X; the bearish version, at a new high above X.
- In the Deep Crab, B is deep at 0.886, while D stays at the same 1.618.
- The long CD is explained as a move that sweeps through the stop-loss and liquidation size beyond X.
- In the BTC case, D is at 1.593, but CD/BC 3.851 is out of range, so I classify it as an approximation.
In Part 2, we'll cover the order for picking X, A, B, C and D, the ratio table, and a checklist for drawing the PRZ.
If repeating these calculations by hand for every market gets tedious, the Omnisight Report, which brings several theories together, may help.
This lesson adapts the text, figures and live-stream quotes of the Trader Steve TA series for the web, translated from the original Korean. Check the text and figure captions for the timing and interpretation of each real example, and read conceptual diagrams and real charts separately.
Corrections: support@omnisight.report