What Is the Cypher Pattern? The XC 0.786 Retracement After a Breakout
Historical examples for learning · not current prices or trade recommendations.
Contents
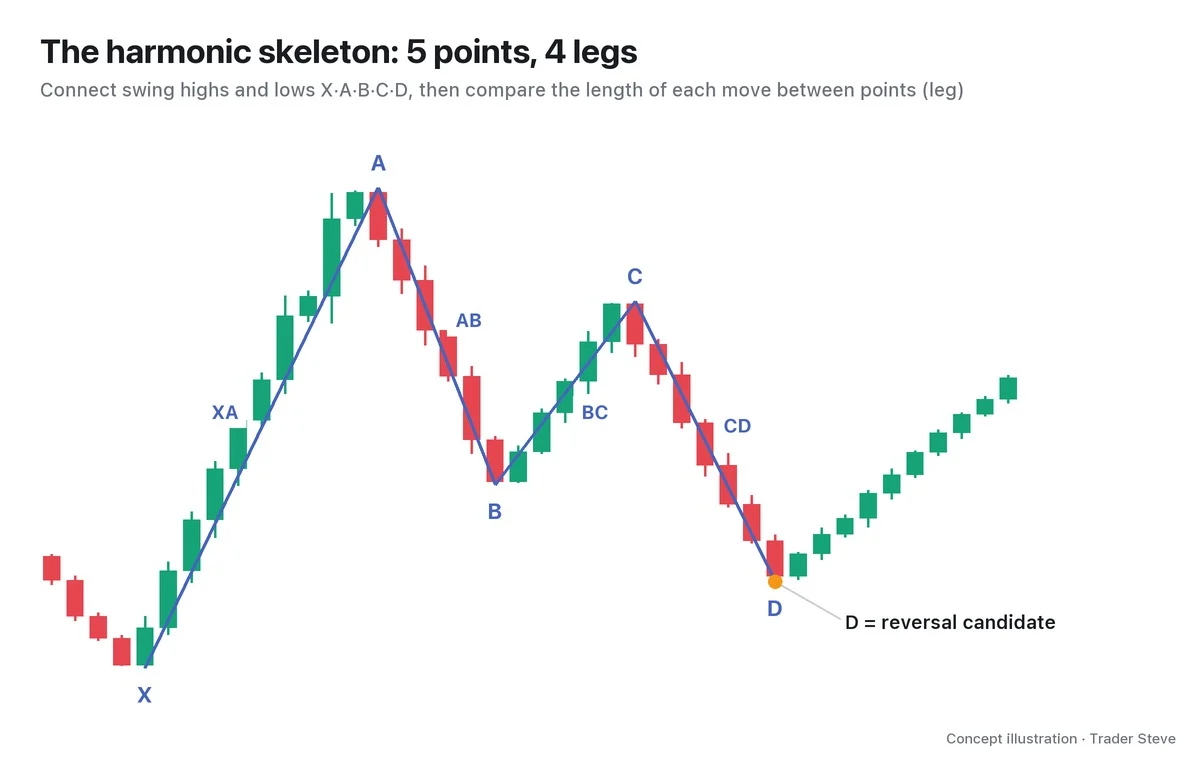
On a chart you will often see price clear a prior high and then get pushed back down hard. It is a confusing spot: did the breakout fail, or is price just catching its breath? The Cypher pattern is a harmonic pattern that groups this move into five swing highs and lows. This lesson uses charts to show what a Cypher is, why C breaks out and D then retraces deeply, and what leg you measure that depth on.
All dates and times are Korea Standard Time (KST, UTC+9). A daily candle is dated by its 09:00 KST open. Intraday times are the open time of each candle.
1. The One-Line Definition: C Goes Beyond A, D Retraces Deep Into XC
A Cypher connects five swing points, X, A, B, C and D, and looks for the spot where C goes beyond A and D retraces 0.786 of the whole XC leg. Let's start with the bullish version.
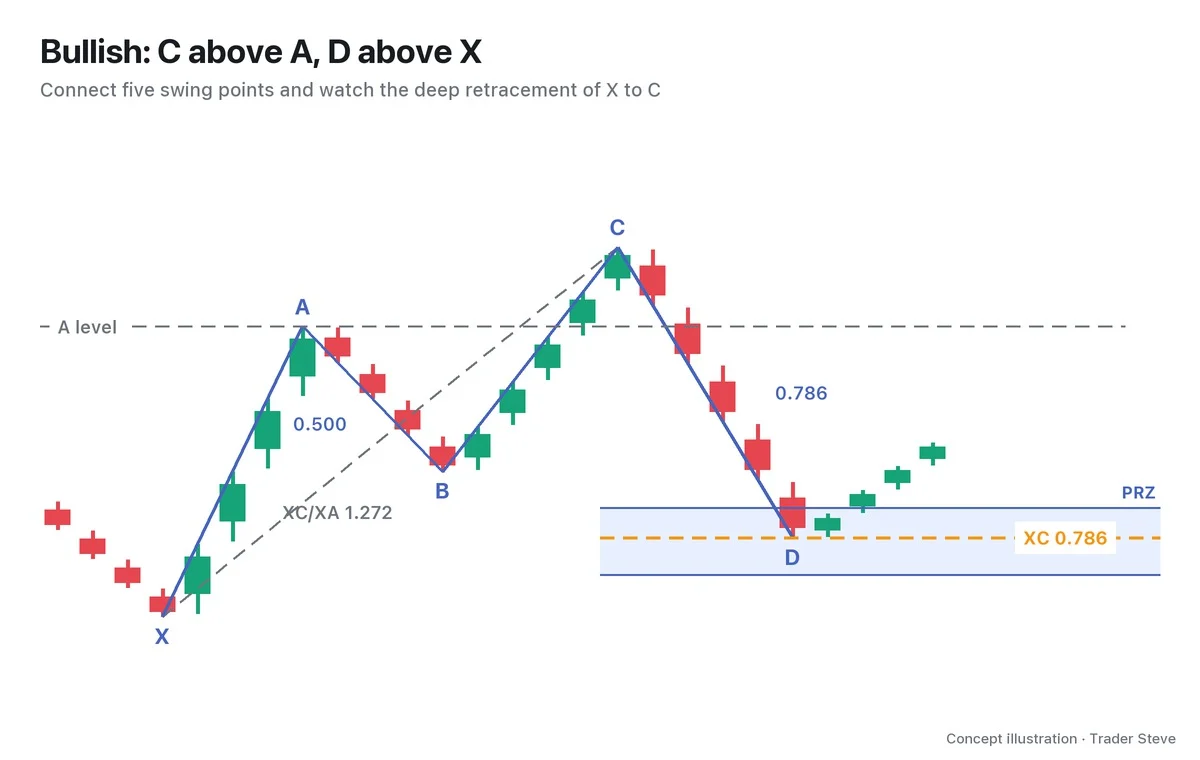
- XA leg: the first rally, from the X low to the A high.
- AB leg: a partial retracement of that first rally. The textbook range is 0.382–0.618 of XA.
- C: price rises again from B and makes a high above A. At this point the XC length is 1.272–1.414 of XA.
- D: price comes down from C to the spot that retraces 0.786 of the whole move from X to C. In the bullish version, D sits above X.
In the chart, 0.500 is AB/XA, 1.272 is XC/XA and 0.786 is CD/XC. These numbers do not measure the same leg, so get into the habit of reading the denominator along with the number. At first, rather than memorizing every number, just remember "C clears the prior high, and D holds the starting point X."
2. Bullish and Bearish Are Mirror Images
A Cypher is named after the direction of the reaction you watch for at D.
| Type | Where C is | Where D is | What you watch for at D |
|---|---|---|---|
| Bullish Cypher | a high above A | a low above X | whether the decline stops and price bounces |
| Bearish Cypher | a low below A | a high below X | whether the rally stops and price turns down |
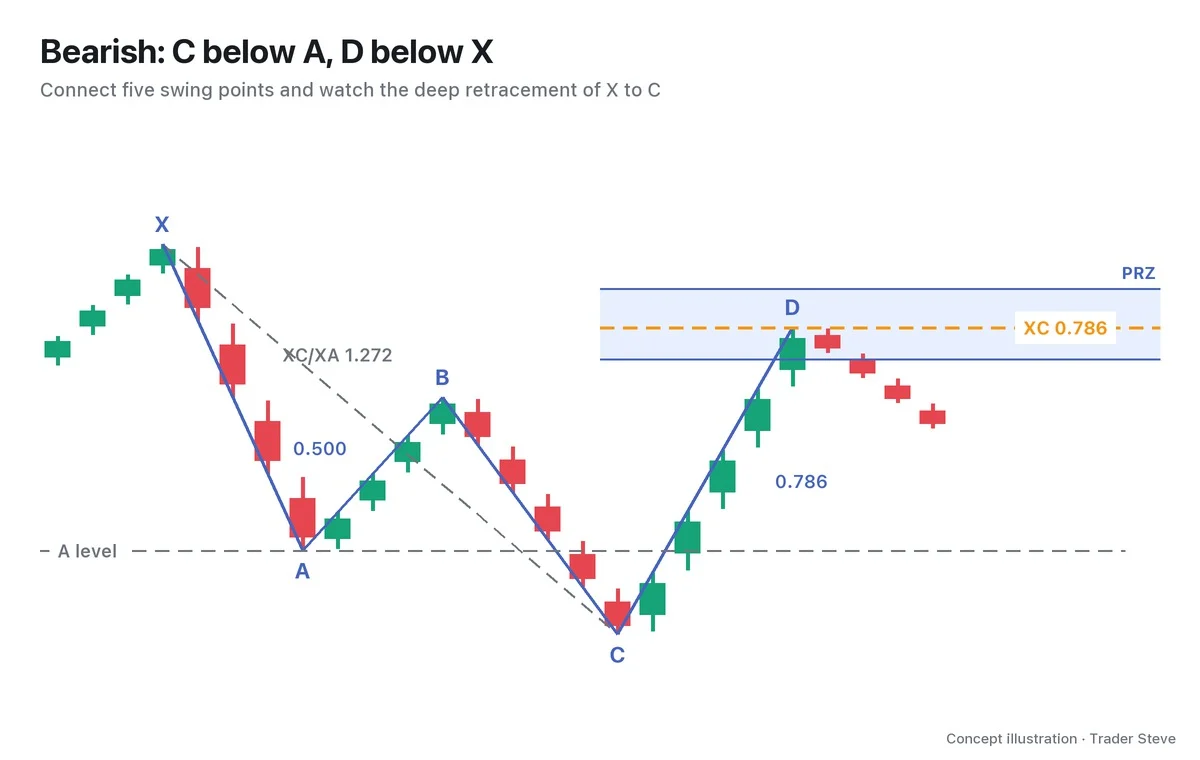
Where the bullish version looks for a bounce after a deep decline, the bearish version looks for a downside reaction after a deep rally. Flip the shape upside down and the rule stays the same: D is measured on XC. If the five points or the potential reversal zone (PRZ) are new to you, you may want to read Harmonic Basics (related lesson) first.
3. Two Things That Set It Apart From Other Harmonics
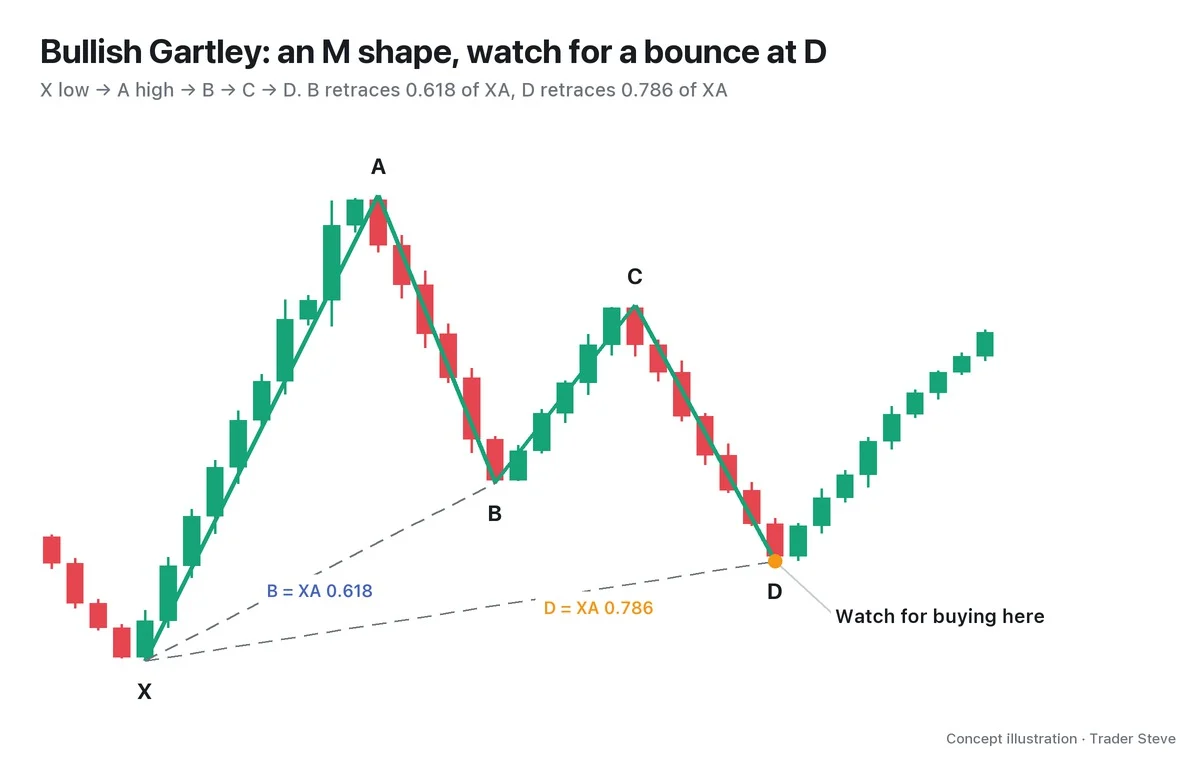
Put it next to familiar harmonic patterns like the Gartley and the Bat, and what stands out about the Cypher is that C sticks out beyond A.
- C goes beyond A. In the bullish version, C must make a new high above the prior high. Calling a C that stopped inside A a Cypher gets the order backwards.
- You lay the ruler on XC for D. If you carry over the XA retracement you know from the Gartley, D ends up in a different place. A Cypher has traveled further, out to C, so the ruler has to stretch all the way from X to C.
Think of XA as the height of the first flight of stairs, and XC as the total height after climbing one more flight on top. To measure how far price has come down from the top at C, you have to use the total height, not just the first flight.
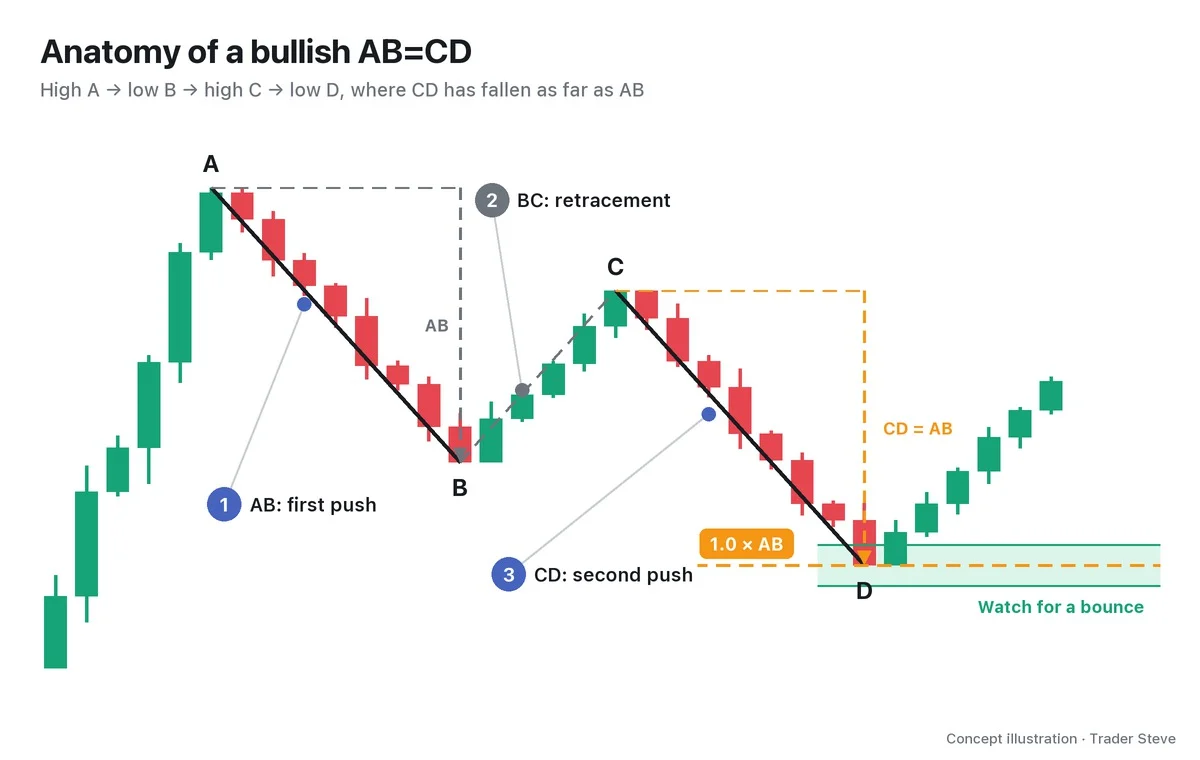
Sources disagree on how to measure C. This series judges C by XC/XA and notes BC/AB for reference only. Even when you see the same 1.272, check first which leg it divides. The basics of these ratios are covered in Basics Fibonacci (related lesson).
4. Why a Breakout Is Followed by a Deep Retracement
In the bullish version, the moment C clears A is the moment price makes a higher high (HH). You can also read it as a break of structure (BOS). On a live stream I explained what comes after a high is broken like this. I wasn't describing the Cypher itself, but it helps you understand the skeleton of the pattern.
"Say price takes out this line here and goes above it. Then a structural shift happens. It has made a higher high. So the next step is a structure of higher lows." — Trader Steve, live stream, Sep 2, 2026 (translated from Korean) · ▶ Watch the stream highlights (Korean audio)
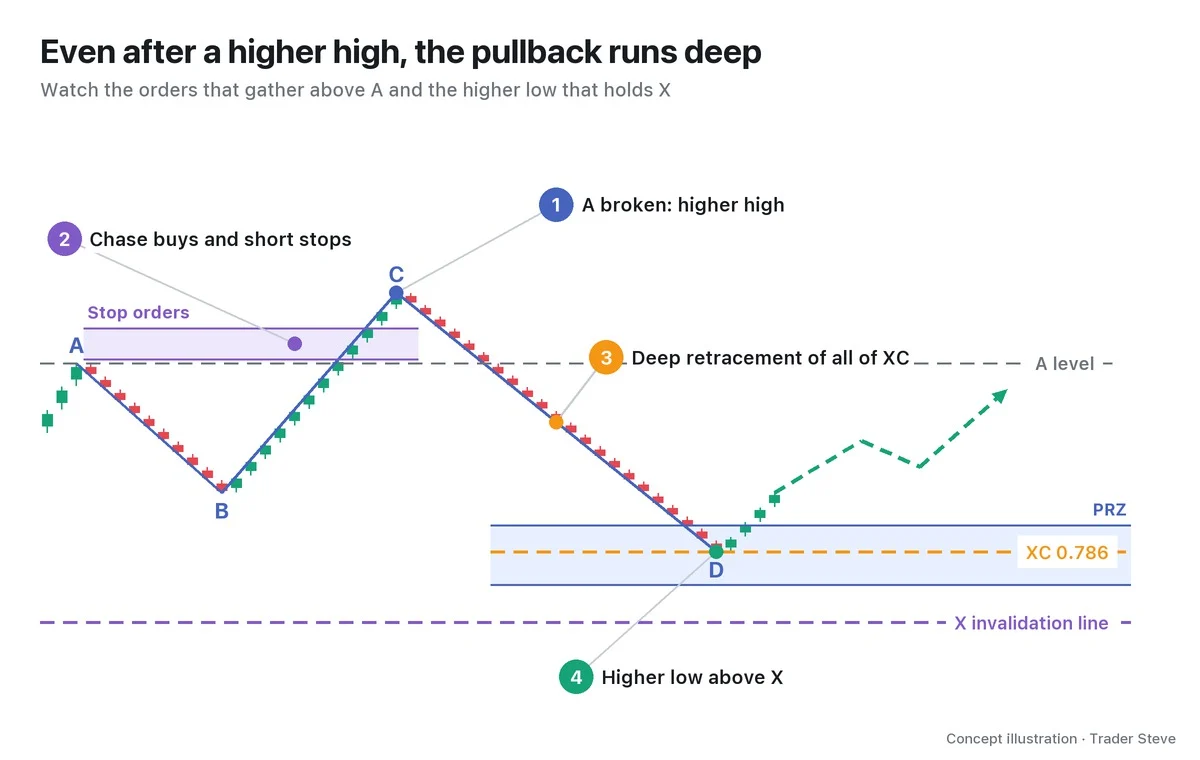
Here is the same idea in terms of order flow. When price clears A, buy orders chasing the breakout can hit the market together with stop orders from short positions parked above A. Once that size is absorbed and follow-through buying dries up, price gets pushed back down. The Cypher describes a retracement that comes in deep but still holds X. Candles alone can't tell you who actually placed the orders, so treat this as an explanation for understanding the move.
"Because it made a higher high, next it goes looking for the point where it makes a higher low." — Trader Steve, live stream, Sep 4, 2026 (translated from Korean) · ▶ Watch the stream highlights (Korean audio)
The key point is that even if D is lower than B, as long as it is above X, it is a higher low (HL) relative to X. Coming halfway down the stairs doesn't mean you've gone below the floor you started on. Conversely, if D breaks X, the bullish setup is invalid. This structure ties into Basics Swings and Trend (related lesson), and telling breakouts apart ties into ICT BOS and CHoCH (related lesson).
5. A First Look at a Real Chart: A Weak C on the BTC Daily
Real charts don't match the textbook numbers exactly. Let's look at the Bitcoin (BTC) daily chart from summer 2024. This is an approximate case picked after seeing the outcome, and D is also a swing that was confirmed only after the later candles printed.
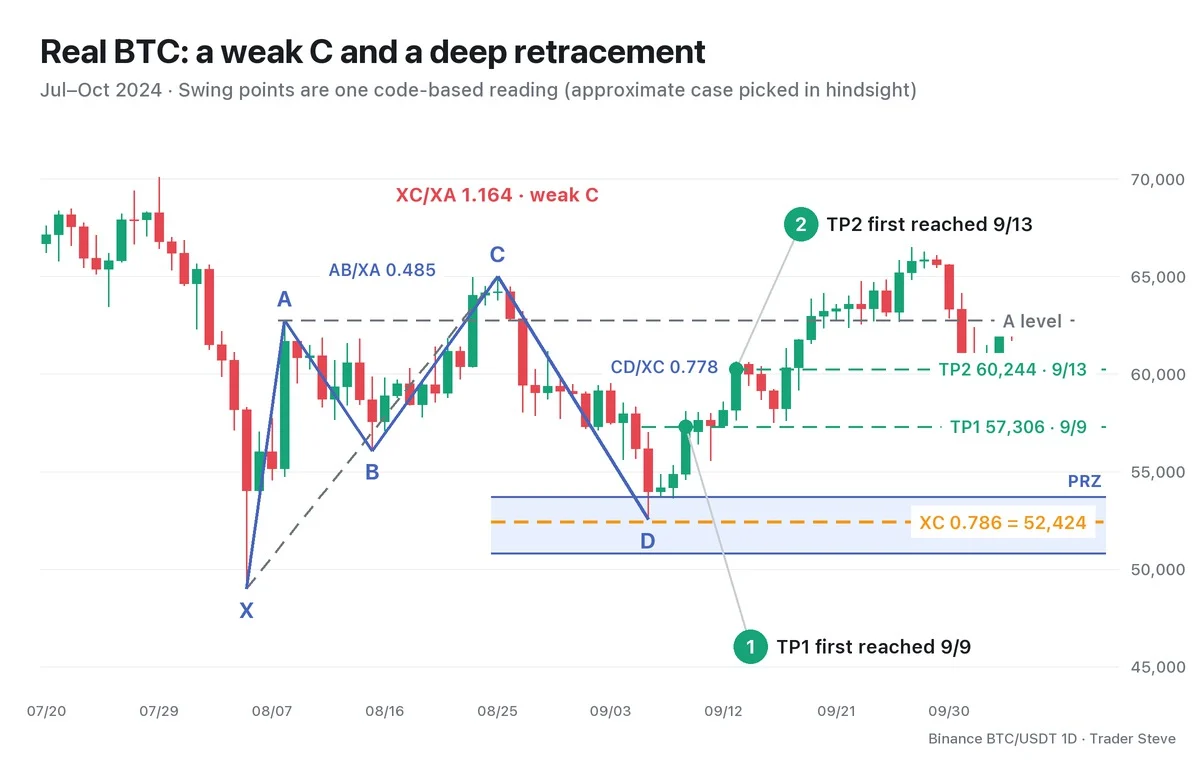
- X 49,000 on Aug 5 → A 62,745 on Aug 8 → B 56,079 on Aug 15. AB/XA is 0.485.
- C cleared A at 65,000 on Aug 25. But XC/XA is 1.164, short of the textbook 1.272–1.414. Even though it falls within this series' tolerance range, I label it a "weak C." For reference, BC/AB is 1.338.
- D at 52,550 on Sep 6 stayed above X. CD/XC is 0.778, and the XC 0.786 reference line is 52,424. The actual D stopped 126 above that line.
After that, price first reached the CD 0.382 and 0.618 retracement lines (the take-profit levels TP1 and TP2), 57,306 and 60,244, on Sep 9 and Sep 13 respectively. In this lesson, treat them only as lines for checking the reaction. How to calculate and use targets is covered in Part 3.
The lesson here is not "the Cypher called it" but recording in numbers where the case matches the textbook and where it doesn't. That C cleared A and whether C extended far enough are two separate checks. D, too, is not pinned to a single price: you watch for a reaction in the 0.705–0.886 band centered on XC 0.786.
The shared case H-BTC-2024-08-C is the BTC daily chart 49,000→62,745→56,079→65,000→52,550. Gartley Part 1 (harmonic/gartley/blog01, H-BTC-2024-08-G) adds 70,080 in front and starts one swing earlier. The two belong to one case group that shares four points; they are not two names for the same five points.
Key Takeaways
- A Cypher is a harmonic pattern whose five points include a C that goes beyond A.
- You look for D at 0.786 of the whole XC leg, not of XA.
- The bullish version looks for a higher low above X; the bearish version looks for a lower high below X.
- In the BTC case, C at 1.164 is a "weak C" outside the textbook range, and I label the case approximate.
- If X breaks, the bullish setup is invalid. The PRZ is a zone for watching the reaction.
In Part 2, we'll cover the order for picking X, A, B, C and D, the ratio table and the tolerance, as a checklist.
If repeating these calculations by hand for every market gets tedious, the Omnisight Report, which compiles several theories for you, may be worth a look.
This lesson adapts the text, figures and live-stream quotes of the Trader Steve TA series for the web, translated from the original Korean. Check the text and figure captions for the timing and interpretation of each real example, and read conceptual diagrams and real charts separately.
Corrections: support@omnisight.report