What Is the 5-0 Pattern? The First 50% Retracement After a Trend Shift
Historical examples for learning · not current prices or trade recommendations.
Contents
You'll often see a chart break one more low and then suddenly rally above the previous high. At that moment it's easy to get stuck between chasing the move and waiting for a pullback. This lesson uses diagrams to explain what the 5-0 pattern (read "five-oh," also called the Five-Zero pattern) is and where you measure the first retracement after the trend has changed.
1. The One-Line Definition: The First Pullback After the Trend Breaks
The 5-0 is a harmonic pattern that uses ratios to measure the last new low of a downtrend (B) → a strong rally that breaks that trend (C) → the first 50% retracement of that move (D). For the bearish version, read it upside down.
In a normal downtrend, bounces stall below the previous high. Once C clears that high, though, the story changes. The idea behind the 5-0 is to watch the next move down and check whether the newly formed upward flow holds.
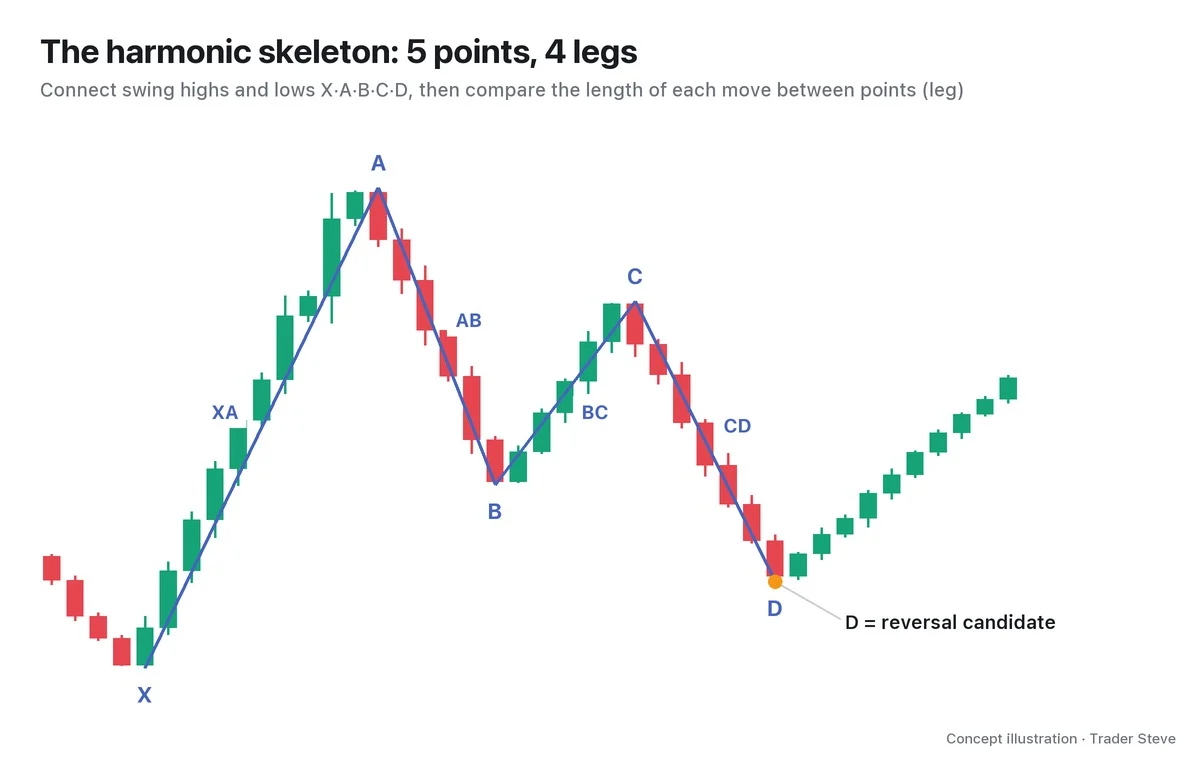
An easy way to remember the name: "D sits at 50% of BC." That is a memory aid, not the official origin of the name. The pattern was laid out by Scott Carney; like other harmonics, you connect the turning points and compare the lengths of each leg.
2. Six Points, Not Five
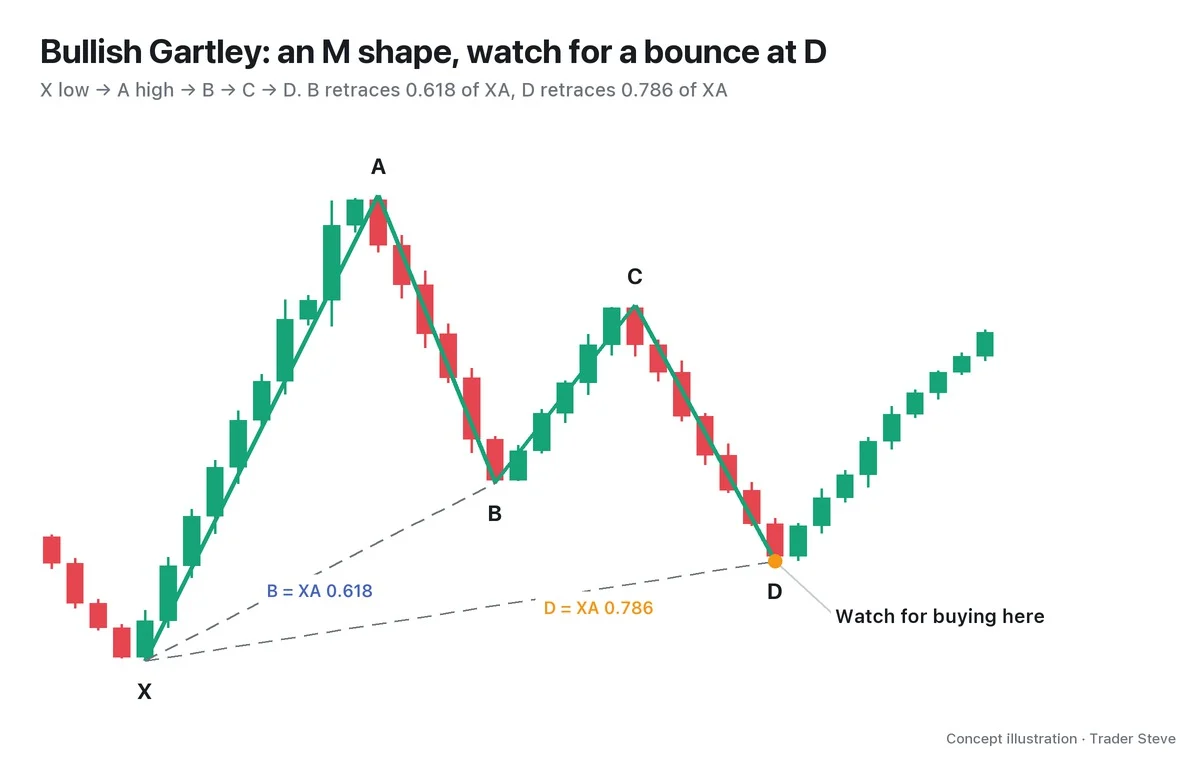
In front of the familiar X, A, B, C and D from the Gartley and the Bat, the 5-0 adds one more starting point, 0 (the origin). Let's start with the bullish version.
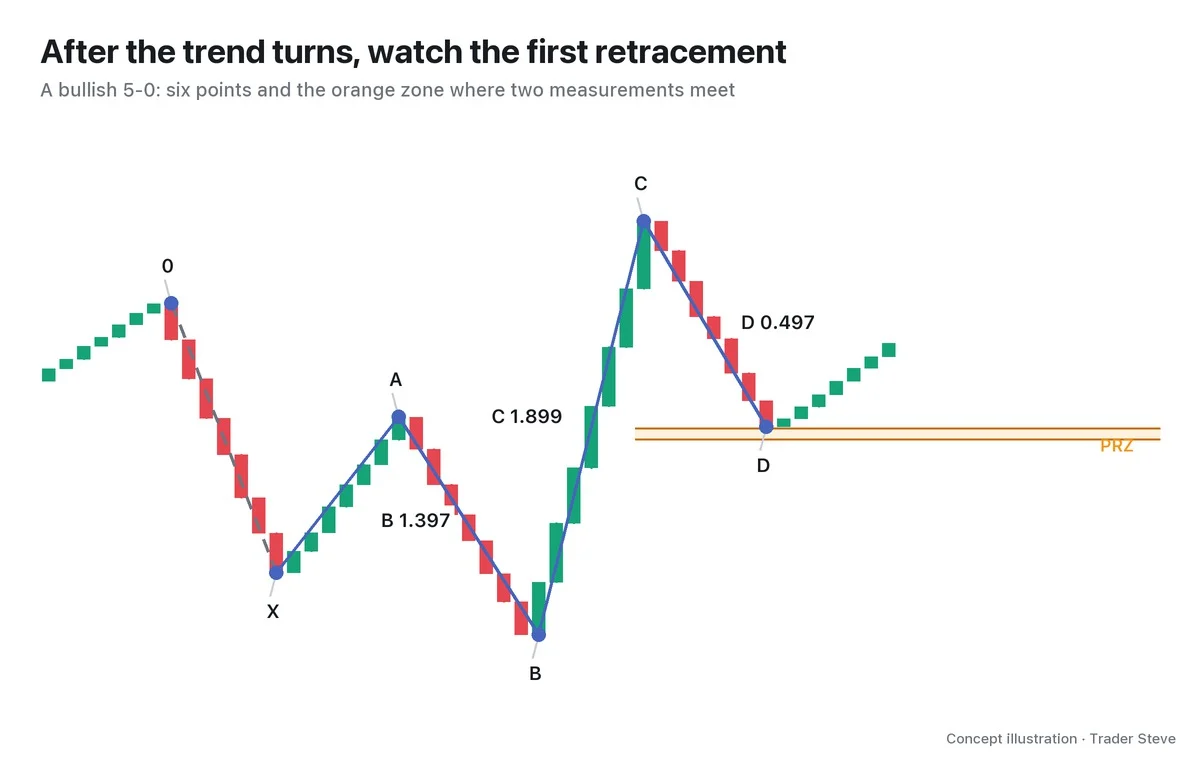
- 0, X, A: the earlier flow that came down and bounced. 0 has no ratio condition of its own.
- B: a low below X. The existing downtrend makes its last new low.
- C: a high above A. A strong rally clears the previous high.
- D: a low that retraces roughly half of the rise from B to C.
In the diagram, B 1.397 is AB/XA, C 1.899 is BC/AB and D 0.497 is CD/BC. These were re-measured from the wick extremes of illustrative candles, so D differs slightly from exactly 0.5. Don't just read the numbers — read which leg was divided by which.
There are four differences from other harmonic patterns. There are six points, and B and C each push beyond X and A respectively. And D is measured from BC, not from XA. That's why the 5-0 doesn't slot straight into the retracement-type vs. extension-type classification, which sorts patterns by whether D falls inside or outside XA. Here, the ruler is BC — the leg that most recently changed the trend.
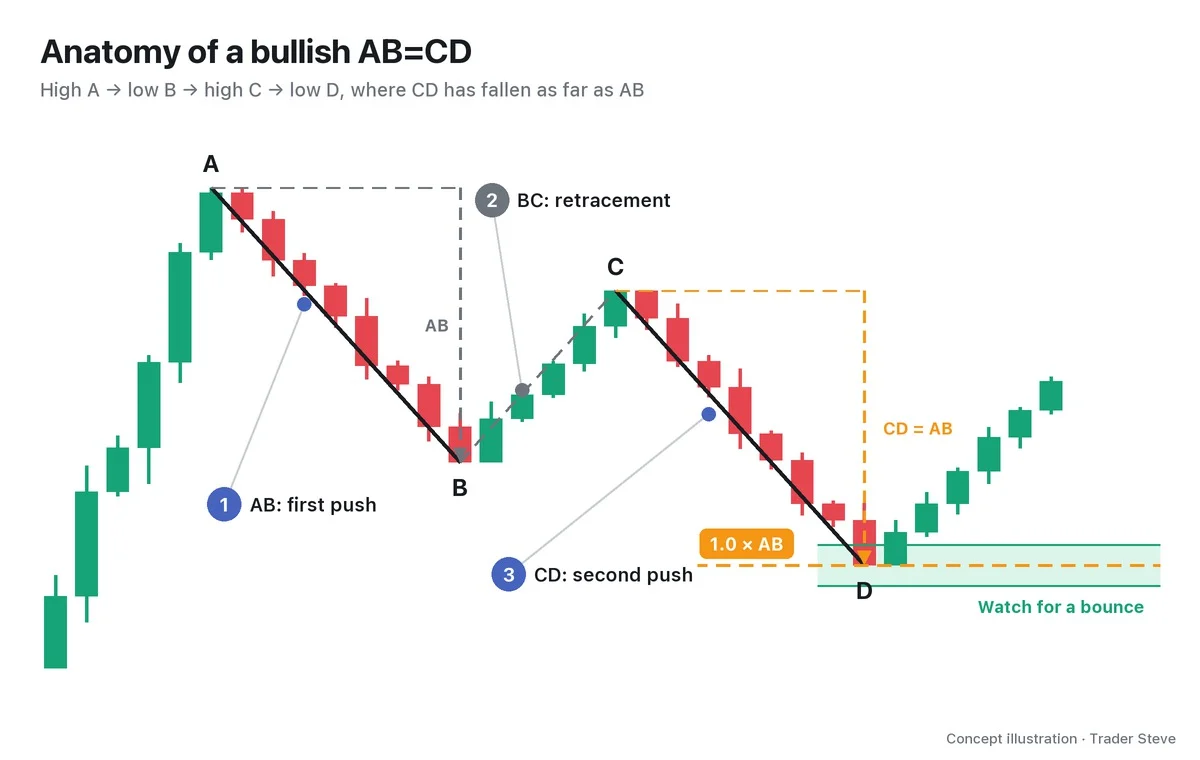
When you look at D, you check not only half of BC but also the reciprocal AB=CD: a retracement from C equal to the length of AB. Where the two measurements meet is the potential reversal zone (PRZ). Think of it as a price band in which to watch for a reaction.
3. Why Price Retraces Half After a Structure Change
Seen as order flow, the bullish 5-0 plays out in three scenes.
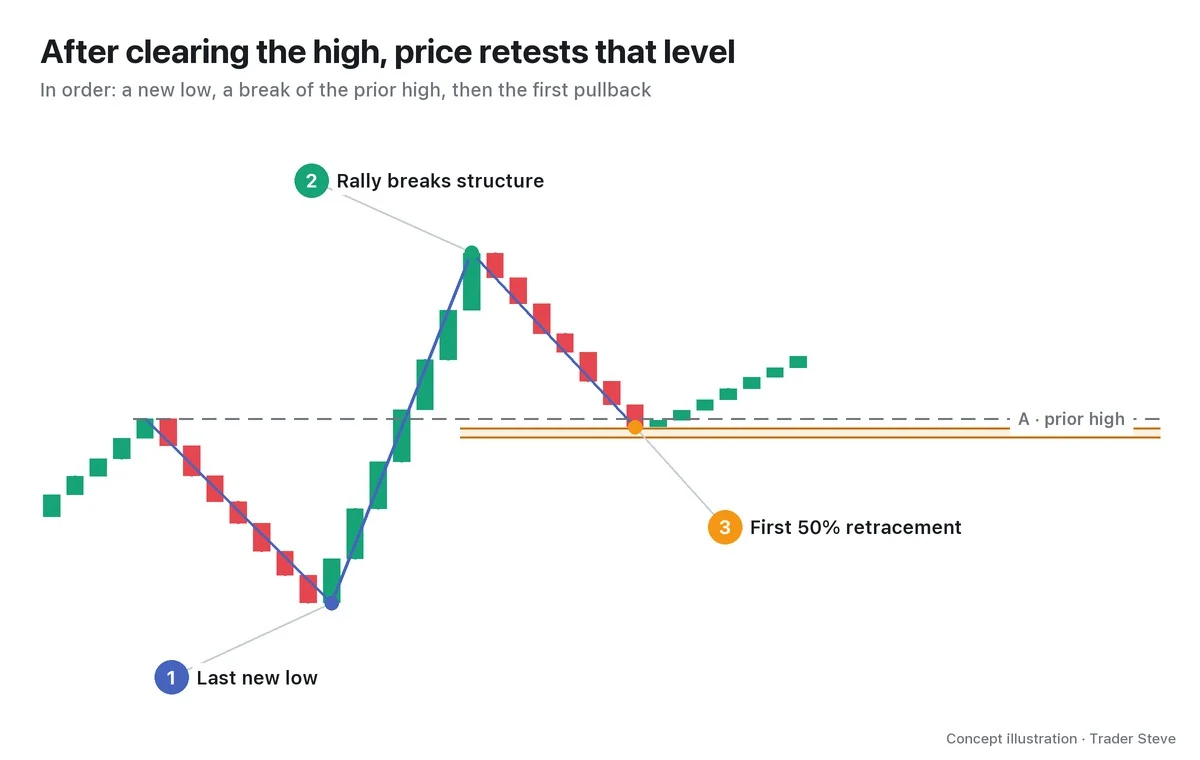
- B breaks the last low. This is where stop-losses from existing longs and fresh selling from traders reacting to the drop can pile up.
- C clears the prior high. If price absorbs that selling and then rallies hard enough to clear A, the pattern of lower highs is broken.
- The first pullback comes at D. Profit-taking hits after the sharp rally, and late buyers wait for a lower price.
The reason to watch the area around the halfway point is that you can weigh three things together there: the average entry price of the new buyers, the support/resistance flip at the broken A, and the reciprocal AB=CD. Candles alone can't tell you participants' actual average entry prices, so treat this as an explanation for understanding how orders collide.
As an analogy, it's like pushing through a door that had been shut and then stepping back onto the threshold. You check whether A, which used to block price like a ceiling, now holds it up like a floor. The tendency of the 5-0's D to land near A is something we'll work through with numbers in the next part.
I said this on a live stream while explaining a structure change on SOXL (a 3x leveraged semiconductor exchange-traded fund). It wasn't a lesson on the 5-0; I'm connecting it here as a way of reading the order of highs and lows.
"We got a rally that broke this structure that had been coming down. … It has now shifted into a structure that's raising both the lows and the highs. … Up, down, up, down, and now it's come back down again, so there's every chance it finds support here and gets pulled back up there." — Trader Steve, live stream, Aug 27, 2026 (translated from Korean) · ▶ Watch the stream highlights (Korean audio)
4. The Bullish and Bearish 5-0 Are Mirror Images
The direction of the pattern is the direction of the reaction you watch for at D.
| Type | How B and C move | What to watch at D |
|---|---|---|
| Bullish 5-0 | new low below X → new high above A | whether the upward flow holds on the first pullback |
| Bearish 5-0 | new high above X → new low below A | whether the downward flow continues on the first bounce |
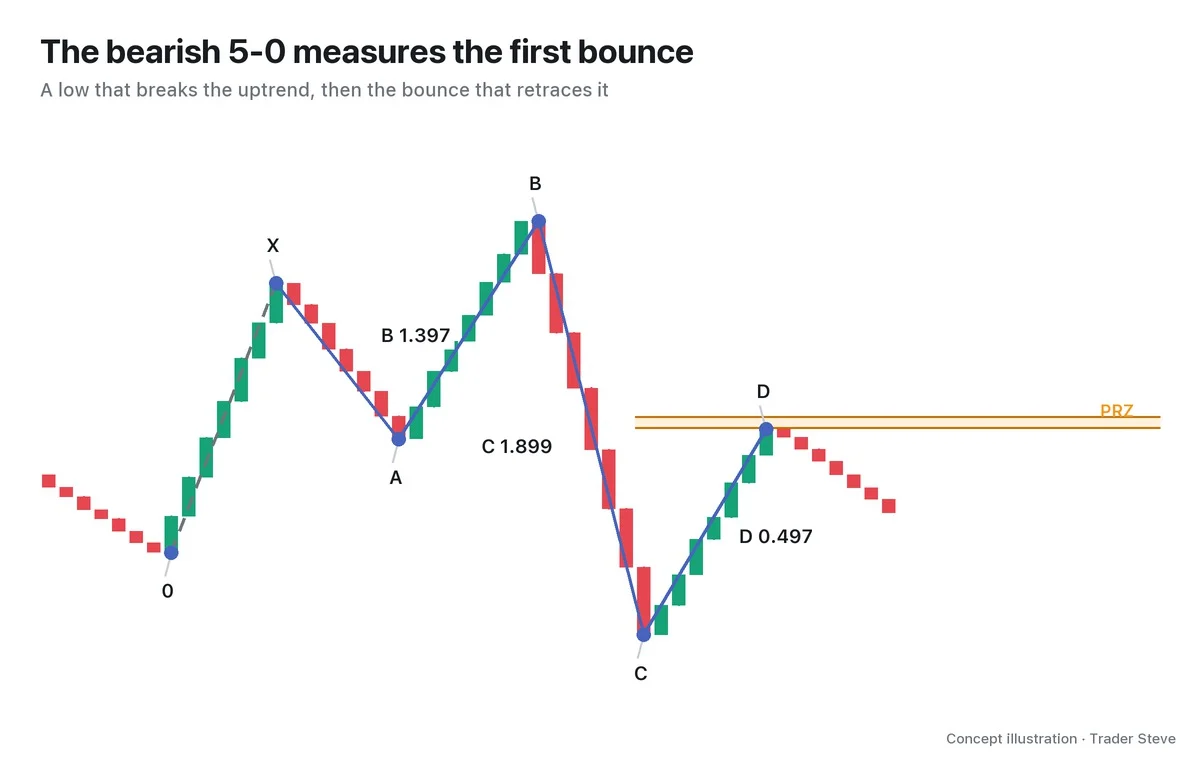
In the bearish version you still put the ruler on BC. Even with up and down swapped, the sequence is the same: "a move that breaks the trend, then the first retracement." Carney introduced the Shark as the stage that comes before the 5-0, and a reversal at the end of a Shark can lead into a 5-0. The details are covered in Harmonic Shark (related lesson).
5. A Real-Chart Preview: Three Measurements Converging on ETH
Let's look at a bearish 5-0 on the Ethereum (ETH) 4-hour chart in December 2025. This is an approximate case picked after the outcome was known, and D is a swing that was confirmed only after the candles that followed it. All times are Korea Standard Time (KST, UTC+9).
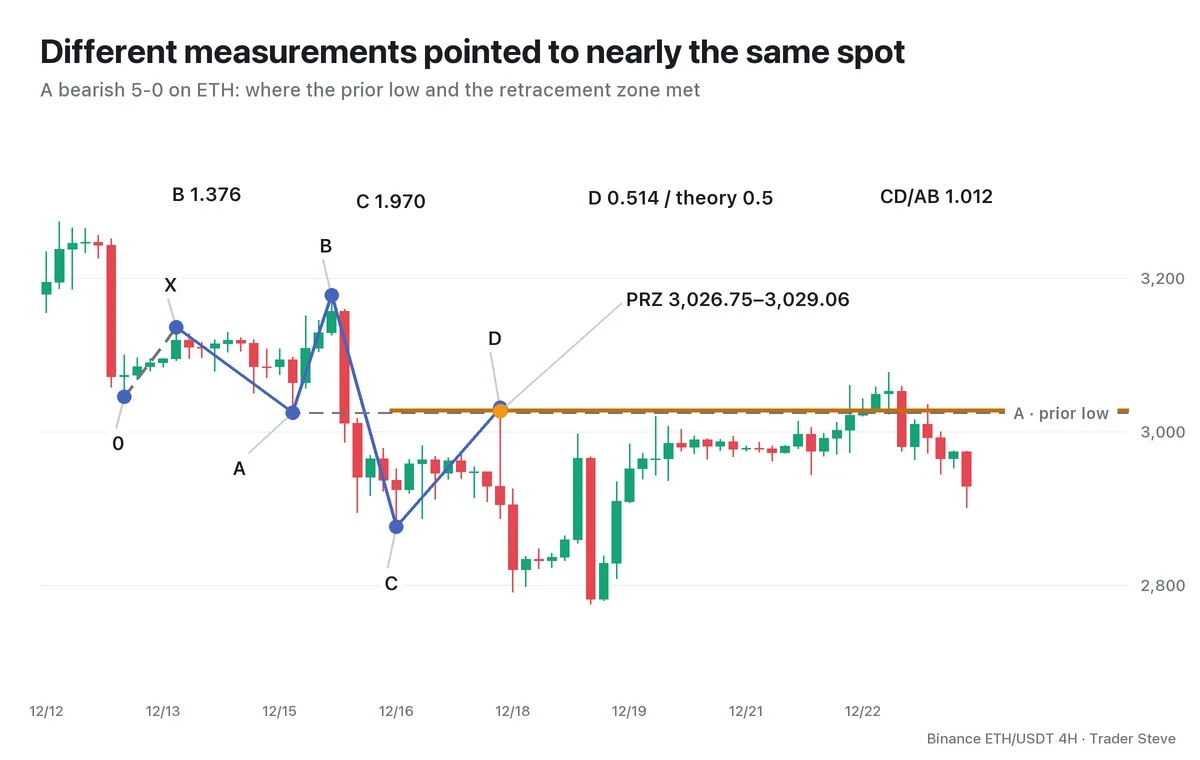
- A, the prior low: 3,024.44.
- The two measurements: half of BC is 3,026.75 and the reciprocal AB=CD is 3,029.06. The space between them is the PRZ.
- D's actual high: 3,030.92 at 21:00 KST on Dec 17. That is 1.86 above the PRZ and about 0.21% away from A.
AB/XA is 1.376 and BC/AB is 1.970. CD/BC is 0.514, about 2.8% larger than the theoretical 0.5 but within this series' ±5% tolerance. CD/AB is 1.012, so the two legs are about the same length. In other words, A, the two measurements and D all landed within a span of 6.48.
The next candle, at 01:00 on Dec 18, dropped hard, below the C low. But by 21:00 on Dec 22, the 30th candle after D, price had climbed back above 0.618 of BC, the deeper retracement reference. The reaction was big, but it didn't last forever.
What I want to stress here is the idea of a structure change followed by the first retracement, more than the pattern's name. My skeptical view of harmonics and the basis of the PRZ are laid out in Harmonic Basics (related lesson). If you want to get comfortable with the order of highs and lows first, read Basics Swings and Trend (related lesson) alongside this lesson.
Key Takeaways
- The 5-0 connects six points: 0, X, A, B, C and D.
- B extends the existing trend one more time; C breaks the prior high (or low) and changes the structure.
- D is measured as the first 50% retracement of BC, not of XA.
- Watch for a reaction in the zone where half of BC and the reciprocal AB=CD meet.
- The ETH D was an approximate 0.514, and by the 30th candle after the reaction, price had recovered 0.618 of BC.
In Part 2, we'll lay out a checklist covering the order for picking the six points, the ratio conditions, and why D tends to land near A.
If repeating this process by hand for every market gets tedious, the Omnisight Report is worth a look.
This lesson adapts the text, figures and live-stream quotes of the Trader Steve TA series for the web, translated from the original Korean. Check the text and figure captions for the timing and interpretation of each real example, and read conceptual diagrams and real charts separately.
Corrections: support@omnisight.report