What Is the Gartley Pattern? XABCD Structure and the 0.786 Retracement
Historical examples for learning · not current prices or trade recommendations.
Contents
When you start studying harmonic patterns, the first name you run into is the Gartley pattern. Five points covered in Fibonacci numbers make it look intimidating, but the skeleton is surprisingly simple. This lesson uses charts to show what a Gartley is, and why the numbers 0.618 and 0.786 in particular are attached to it.
All dates and times are Korea Standard Time (KST, UTC+9). A daily candle is dated by its 09:00 KST open. Intraday times are the open time of each candle.
1. The One-Line Definition: A Deep Pullback Inside an Uptrend, Measured in Ratios
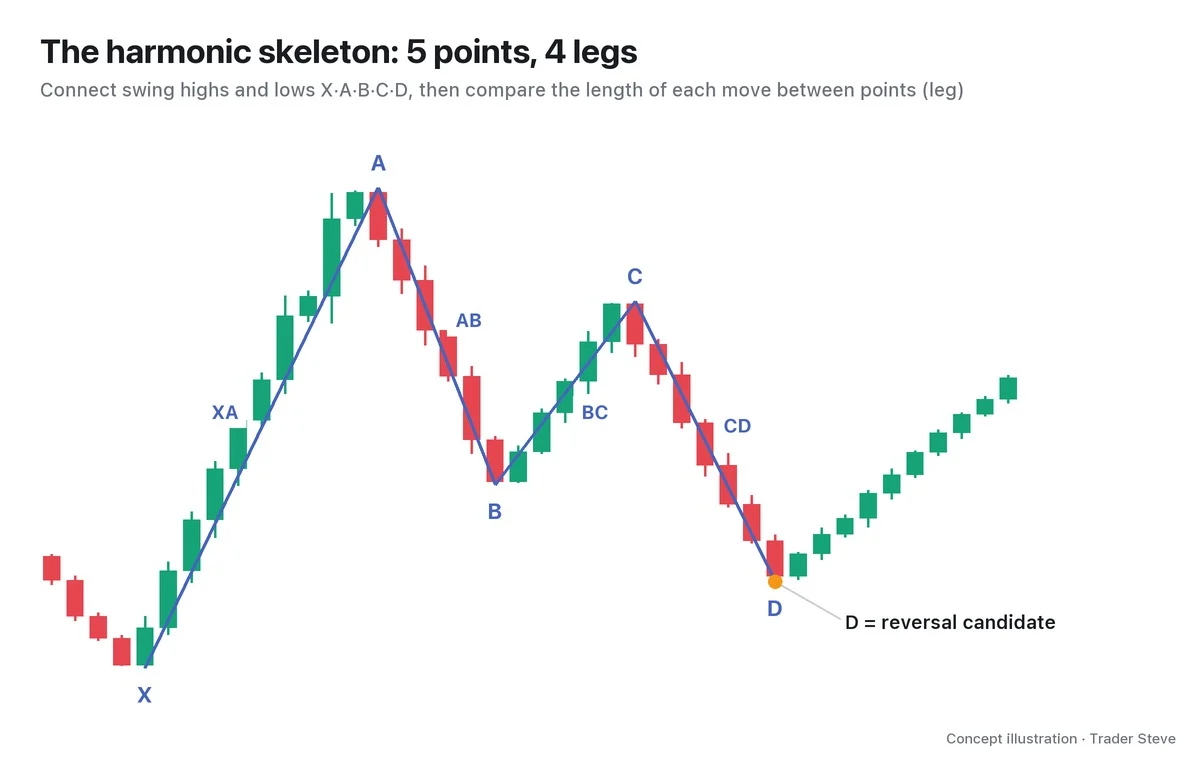
A Gartley is a retracement pattern that uses Fibonacci ratios to measure a deep pullback after a large rally. You label five swing highs and lows on the chart X, A, B, C and D, then compare the lengths of the four legs that connect them (XA, AB, BC and CD). This five-point structure is called XABCD.
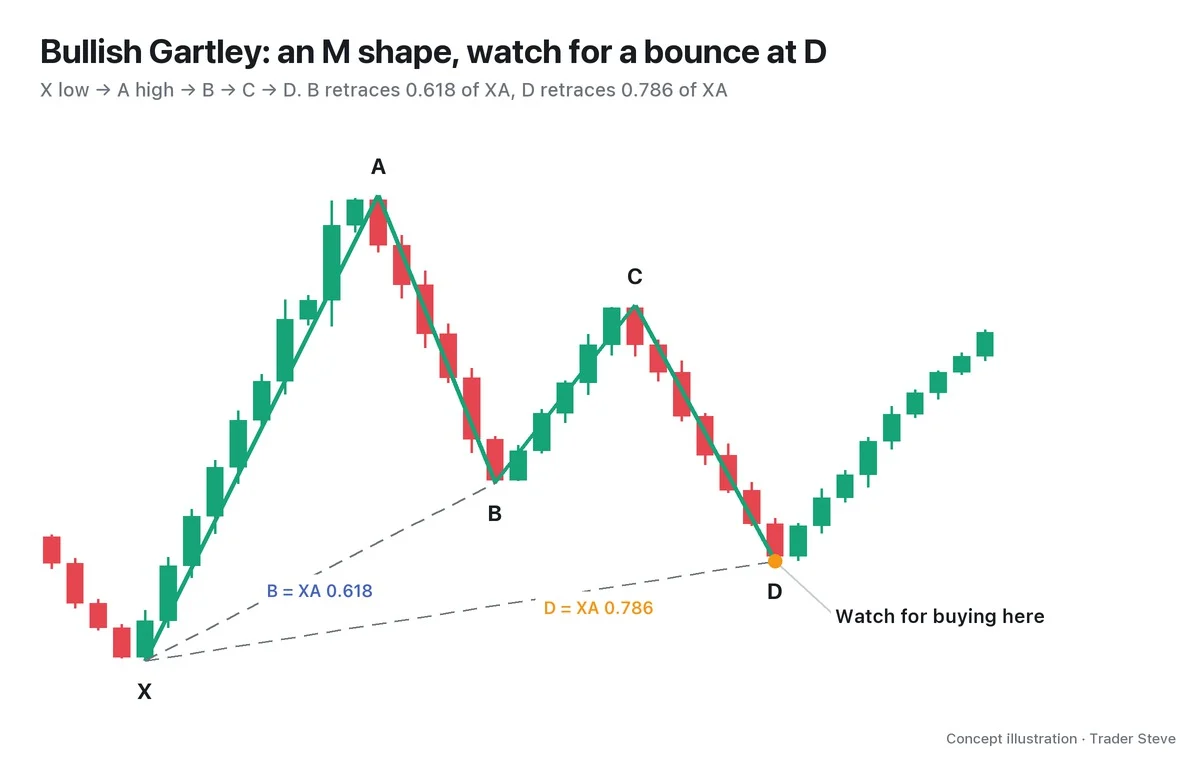
- X → A: the large reference rally. Its length is the yardstick for every ratio.
- A → B: the first pullback. Price comes down to around 0.618 of the XA rally.
- B → C: price rises again but fails to clear A.
- C → D: the second pullback. Price comes down to around 0.786 of the XA rally.
- D: the candidate spot where you can start looking for a reversal. The price zone where D is likely to form is called the potential reversal zone (PRZ).
Only three marks separate the Gartley from other harmonic patterns: B at 0.618, D at 0.786, and D does not go beyond X. Remember those three and you can picture the shape.
2. The Bullish Gartley (M) and the Bearish Gartley (W)
The Gartley comes in two directions.
| Type | Order of points | Shape | What you watch for at D |
|---|---|---|---|
| Bullish Gartley | X low → A high → B → C → D low | M | a buying reaction |
| Bearish Gartley | X high → A low → B → C → D high | W | a selling reaction |
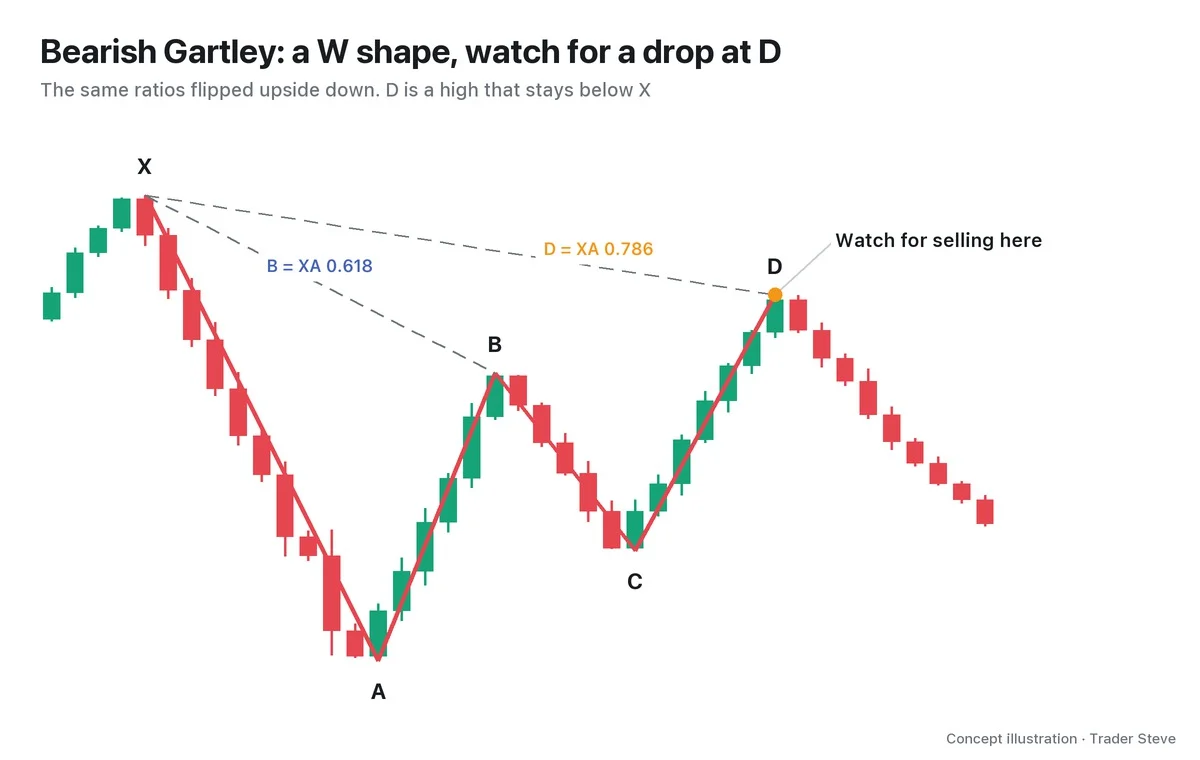
The bearish Gartley is the mirror image of the bullish one. After a large drop (XA), the bounces climb back to 0.618 (B) and 0.786 (D) of the XA decline. The ratios are identical; only the direction changes.
3. Where the Name Comes From: From "Gartley 222" to Fibonacci Ratios
The pattern is said to take its name from a retracement chart that H.M. Gartley printed on page 222 of his 1935 book Profits in the Stock Market, which is why it is also called the "Gartley 222." The original drawing, however, did not carry today's precise Fibonacci numbers. Later traders such as Larry Pesavento and Scott Carney (The Harmonic Trader) worked out the ratios. The widely used "B 0.618, D 0.786" standard is the one Carney set out.
You don't need to memorize the history. What matters is that this pattern is not a magic formula someone invented; it is a retracement shape that showed up often in markets, with numbers attached to it later.
4. Why 0.618 and 0.786: Where People Hold On, Then Give Up
Price does not stop at a Fibonacci ratio because the ratio has some mysterious power. I made this point clearly on a live stream.
"Fibonacci analysis honestly has no real basis. It's just built on a number sequence, right? But it's a psychological benchmark. That's why it works. … When people are down about half, they can hang on. But when about 70% of what they were holding is gone, they can't take it." — Trader Steve, live stream, Sep 13, 2026 (translated from Korean) · ▶ Watch this moment (Short, Korean audio)
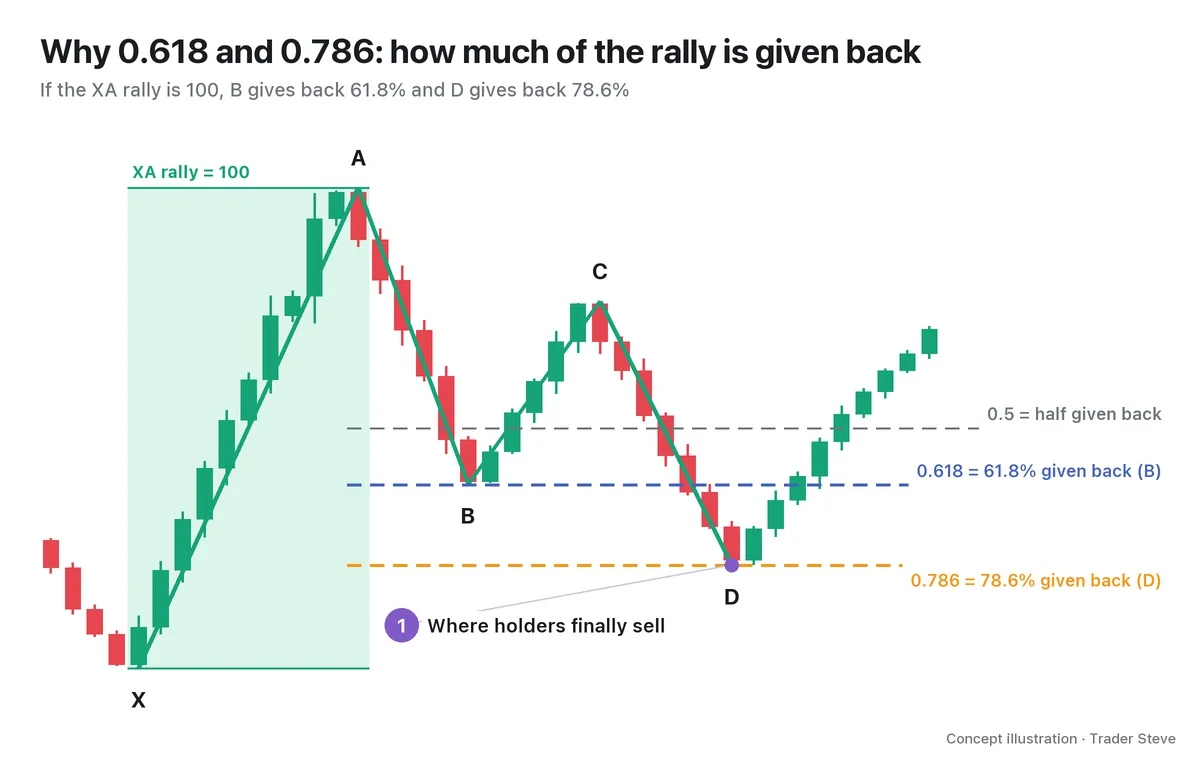
It's easier to understand if you picture someone who bought at X.
- A half (0.5) retracement: their profit is cut in half, but it still feels bearable: "It'll go back up."
- A 0.618 retracement (B): most of the profit starts to disappear. If a bounce follows here (B → C), they feel relieved.
- A 0.786 retracement (D): price is pushed down again and gives back close to 80% of the rally. The size that was held with "I'll at least save what's left" gets dumped.
The flow I described on the live stream is the same. When what you thought was your profit is almost all gone, people sell to save whatever is left, and someone is on the other side buying what they sell. Seen this way, D sitting at 0.786 in a Gartley can be understood as a number that marks a spot where weak hands give up and big players can absorb the selling. Of course, it is only a spot where they can absorb it; there is no guarantee they will.
5. In the End It's Structure: What It Means for D to Stay Above X
In a bullish Gartley, D must stay above X no matter how deep it goes. Put in terms of structure, D is a higher low than X. Price has pulled back deeply, but the uptrend of higher lows is still alive. If D breaks below X, that structure has collapsed and the pattern is invalid.
"Elliott Wave? It's all based on structure. All that harmonic stuff, and ICT too, it's all a story about structure." — Trader Steve, live stream, Aug 25, 2026 (translated from Korean) · ▶ Watch this moment (Korean audio)
So when you look at a Gartley, before the ratio numbers, it is better to ask: "Can this D become a higher low (a lower high, in the bearish version)?" Let's check it on a real Bitcoin (BTC) chart.
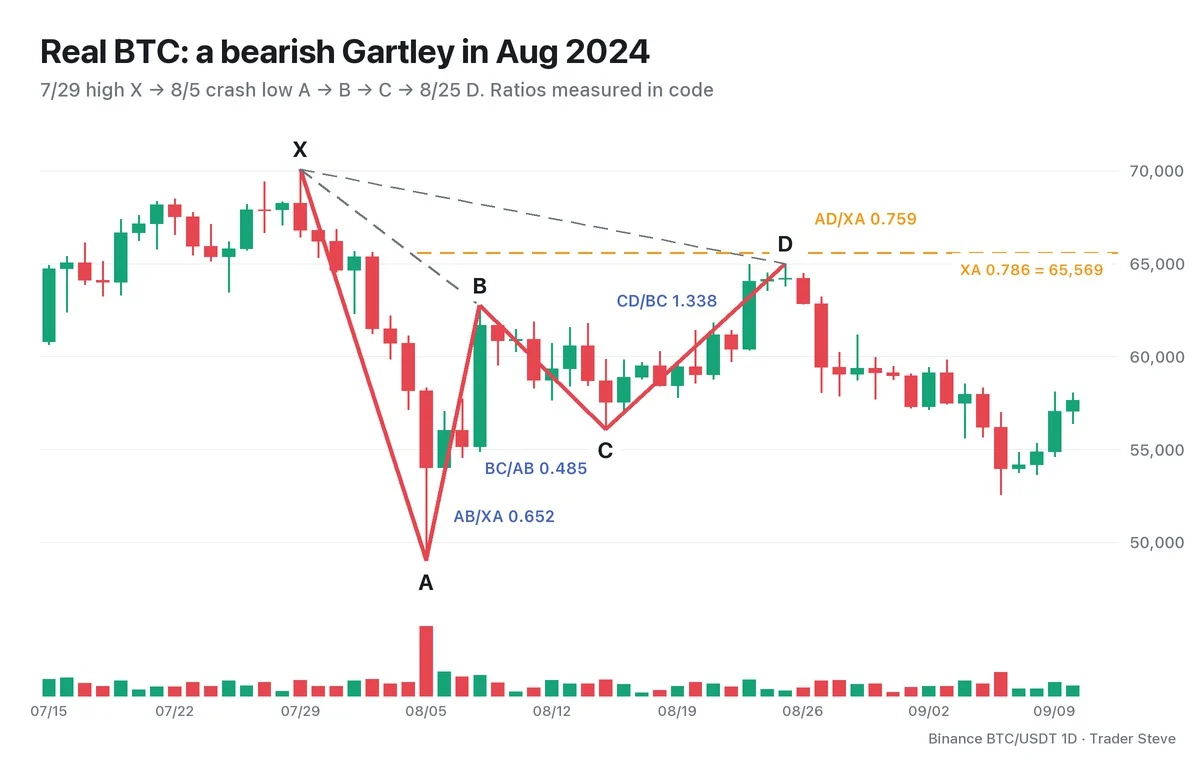
After Bitcoin fell hard from the Jul 29, 2024 high of 70,080 (X) to the Aug 5 crash low of 49,000 (A), the bounces that followed formed a bearish Gartley shape.
- B 62,745: a 0.652 retracement of the XA decline (textbook 0.618)
- C 56,079: a 0.485 retracement of AB
- D 65,000: a 0.759 retracement of the XA decline (textbook 0.786 = 65,569)
- CD is 1.338 times the length of BC
As you can see, a real chart does not match the textbook numbers exactly. That is why in harmonics you don't ask "Is it exactly 0.786?" but check in numbers whether it falls within tolerance. The structural condition also held: D was a lower high that stopped below X (70,080). As the right side of the chart shows, price was pushed down again after D, falling to 52,550 on Sep 6, but a single outcome tells you nothing about how reliable the pattern is. How to set the tolerance, and how to plan the entry and stop-loss at this spot, are covered in Parts 2 and 3.
The shared case H-BTC-2024-08-G is the BTC daily chart 70,080→49,000→62,745→56,079→65,000. Cypher Part 1 (harmonic/cypher/blog01, H-BTC-2024-08-C) is a different XABCD from the same case group: it takes the last four points and adds 52,550. This lesson asks about the retracement of XA; the Cypher lesson asks about the retracement of the new XC.
Key Takeaways
- A Gartley is a retracement pattern drawn with five XABCD points and four legs.
- The Gartley's marks are B = 0.618 of XA, D = 0.786 of XA, and D does not go beyond X.
- A bullish Gartley is an M shape (a buying reaction at D); a bearish Gartley is a W shape (a selling reaction at D).
- 0.786 is where most of the rally has been given back: a psychological spot where holders tend to give up.
- In the end, D is a question of structure: can it become a higher low (a lower high, in the bearish version)? It is not a confirmed signal.
In Part 2, we'll cover how to find a Gartley on a chart step by step, the ratio checklist, and how to draw the PRZ.
If repeating these calculations for every market gets tedious, the market-by-market analysis report below may help.
This lesson adapts the text, figures and live-stream quotes of the Trader Steve TA series for the web, translated from the original Korean. Check the text and figure captions for the timing and interpretation of each real example, and read conceptual diagrams and real charts separately.
Corrections: support@omnisight.report