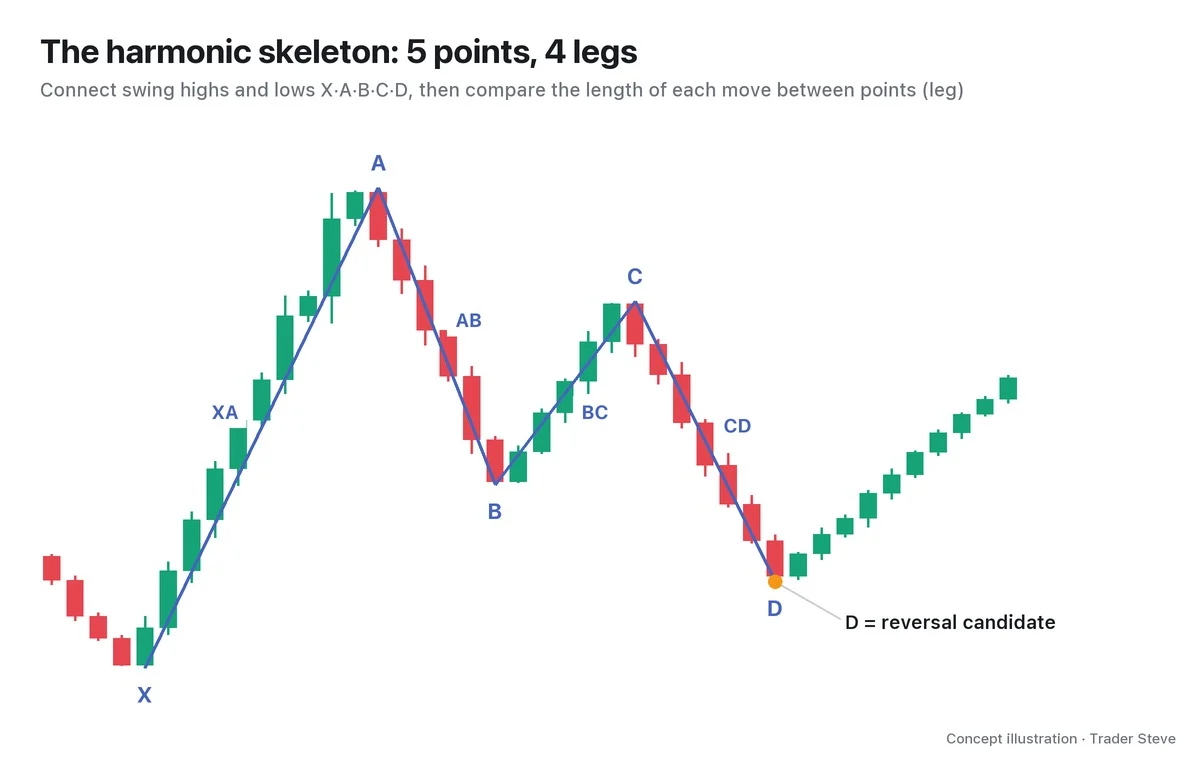
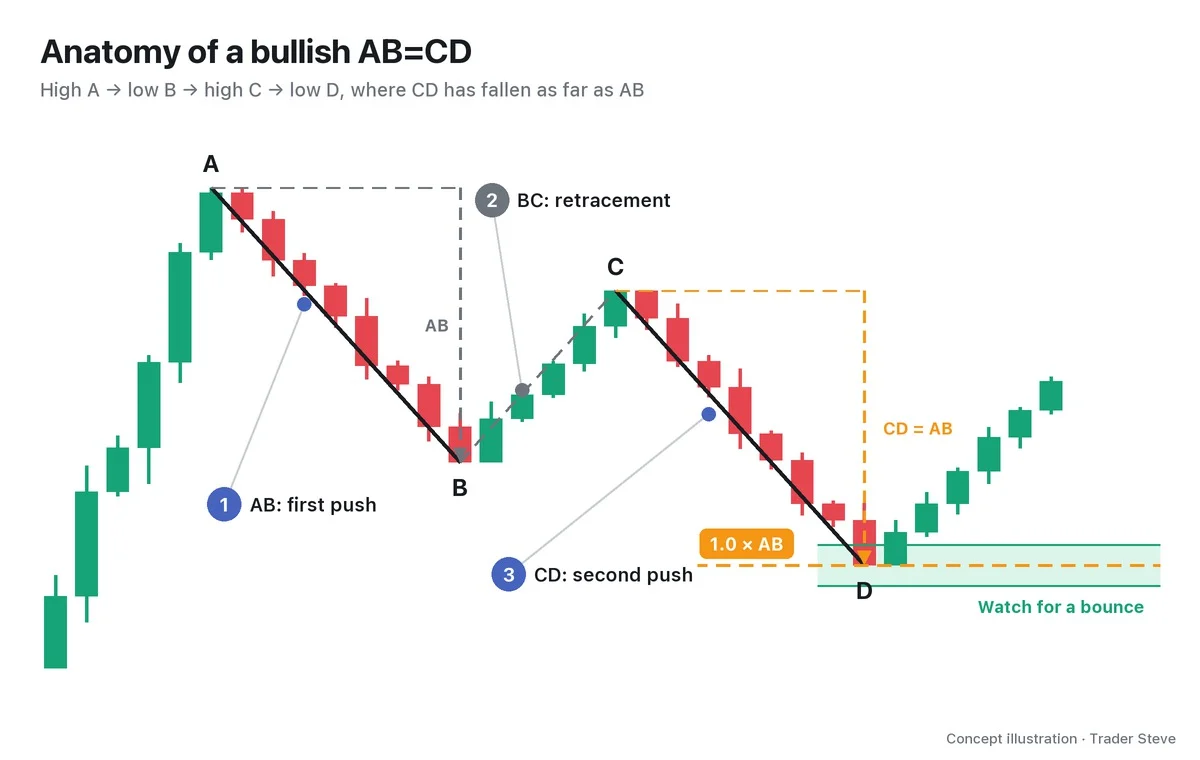
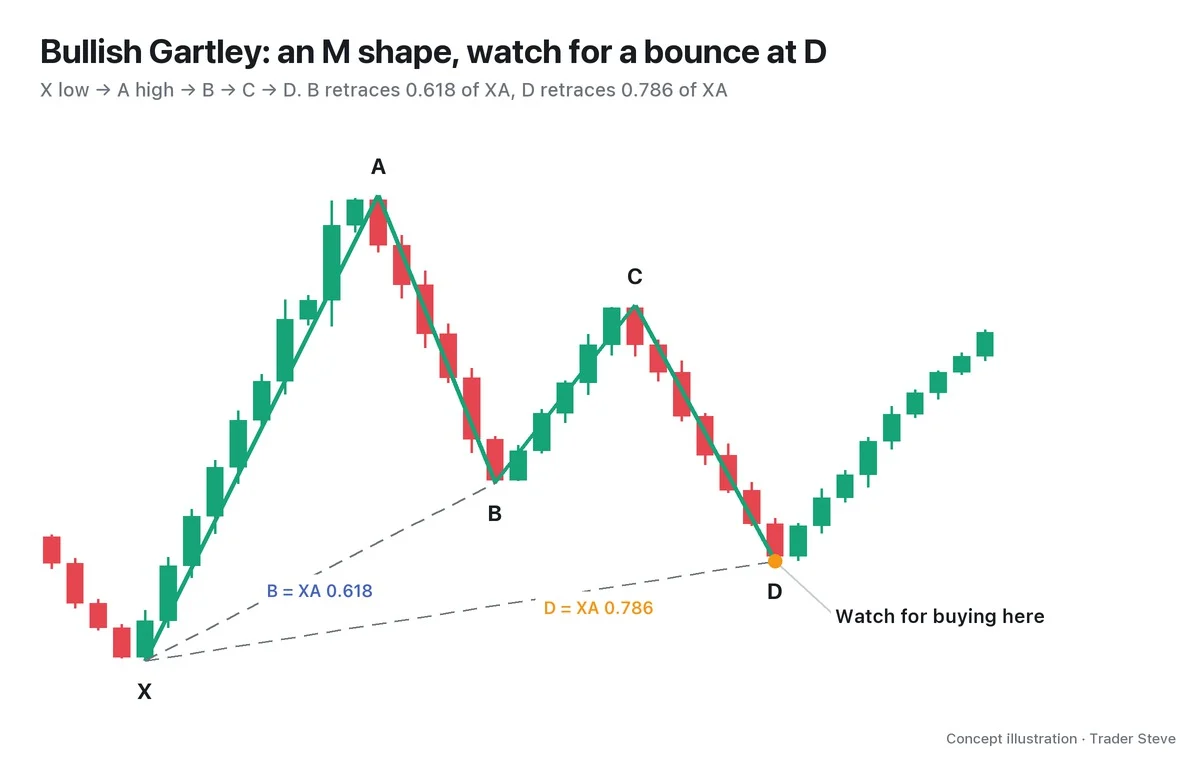
What Is the Shark Pattern? A Harmonic Reversal Where C Goes Beyond A
Historical examples for learning · not current prices or trade recommendations.
Contents
Every so often on a chart, price pokes just past the prior high and then rushes back down the path it just climbed. If you chased the breakout, this is an easy place to get caught off guard. The Shark pattern is a harmonic pattern that groups this move into five highs and lows. This lesson uses diagrams to cover the shape of the Shark, why it forms, and what to watch for near its starting point.
1. The One-Line Definition: C Goes Beyond A, and D Returns Near X
The Shark is a pattern that connects five swing points, X, A, B, C and D, in which C pushes past A and a long CD leg then brings price back near the starting point, X. It is generally credited to Scott Carney, who introduced it in the early 2010s.
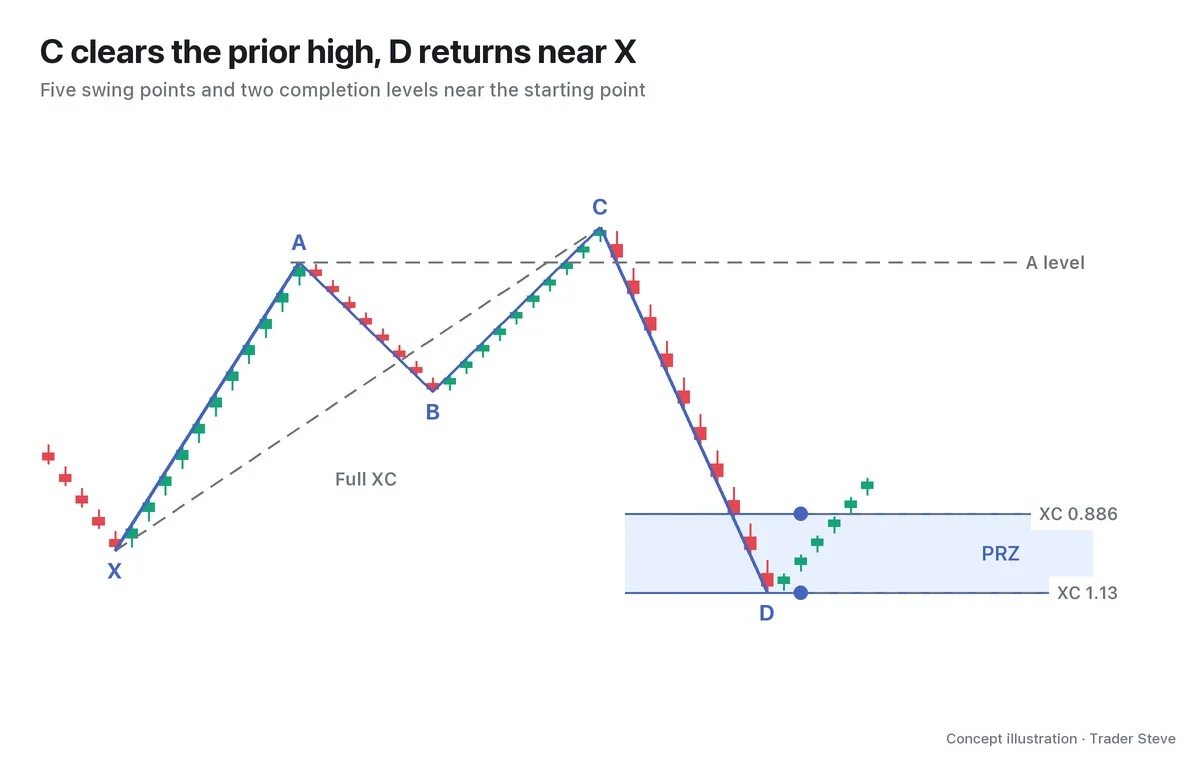
- XA leg: the first rise, from the X low to the A high.
- AB leg: gives back part of that first rise. B stays above X.
- C: price rises again from B and makes a high above A. BC is 1.13–1.618 times the length of AB.
- D: price comes down fast from C to the spot that retraces 0.886–1.13 of the whole XC move.
To start, just remember: "It clears the prior high, then comes all the way back to where it started." The blue band is the potential reversal zone (PRZ), where several calculations cluster. If the five points or the PRZ are new to you, you may want to read Harmonic Basics (related lesson) first.
2. The Bullish and Bearish Versions Are Mirror Images
A Shark is named for the reaction you watch for at D. In the bullish version you watch whether a decline stops; in the bearish version, whether a rally stops.
| Type | Where C sits | What you watch for at D |
|---|---|---|
| Bullish Shark | a high above A | whether price bounces from a low near X |
| Bearish Shark | a low below A | whether price gets pushed back from a high near X |
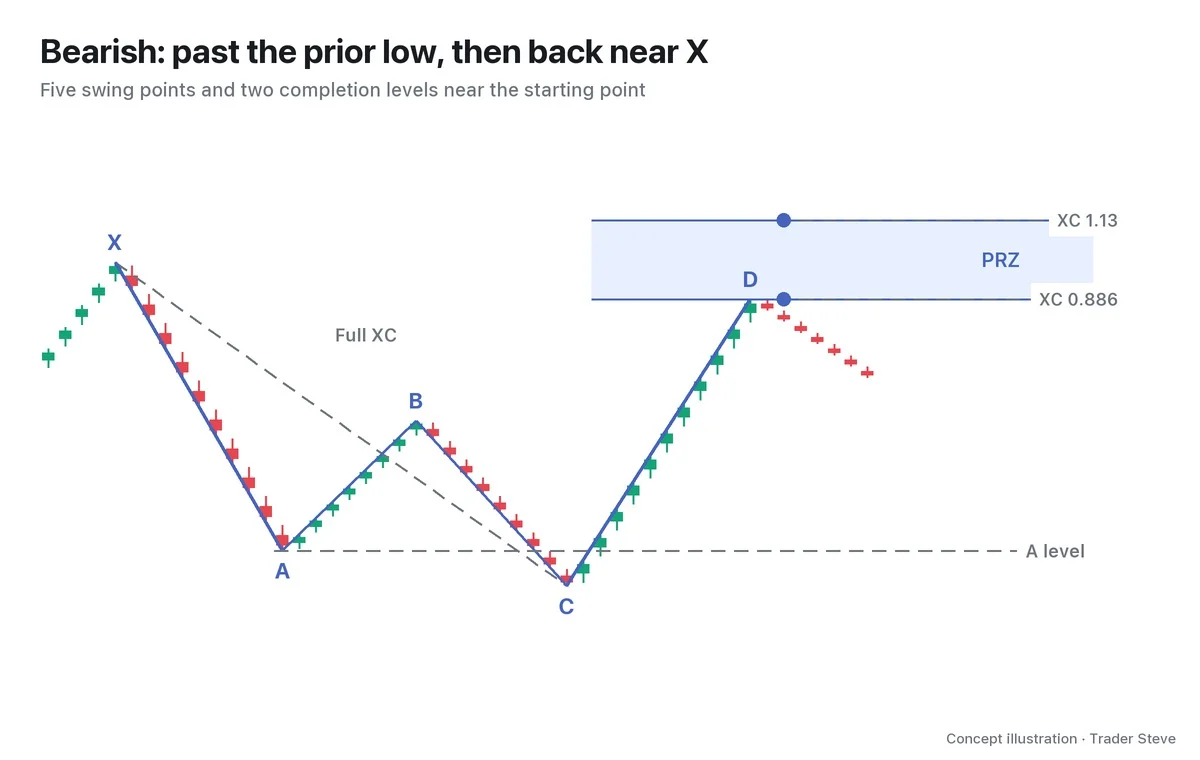
If you look at other sources, the points may carry different names. Carney's original labels are 0, X, A, B and C, with the last point, C, as the completion point. To stay consistent with the other harmonic lessons, this series uses X, A, B, C and D.
| Original labels → this series |
|---|
| 0→X · X→A · A→B · B→C · C→D |
Just be careful not to read another source's C as the C in this lesson.
3. Why Price Rushes Back After the Breakout
Above A in a bullish Shark, orders to buy the breakout can gather alongside the stop-loss orders of short positions. When C briefly stabs above that level, these orders get filled together. If follow-through buying then fades and price drops back below A, the traders who bought expecting a breakout start closing out too. The explanation is that these overlapping orders make CD fast and long.
On a live stream, I described a move through a prior high like this. It was not a comment about the Shark itself, but it helps you understand C's failed breakout.
"The most important criterion: poking at it without damaging the prior high is fine. While it pushes through the liquidation size here, it might slip just a little above. But unless a body closes through it, or it climbs up and closes like this — if it just pokes above and drops, this can become a spot that gets a very strong correction to the downside." — Trader Steve, live stream, Aug 22, 2026 (translated from Korean) · ▶ Watch the stream highlights (Korean audio)
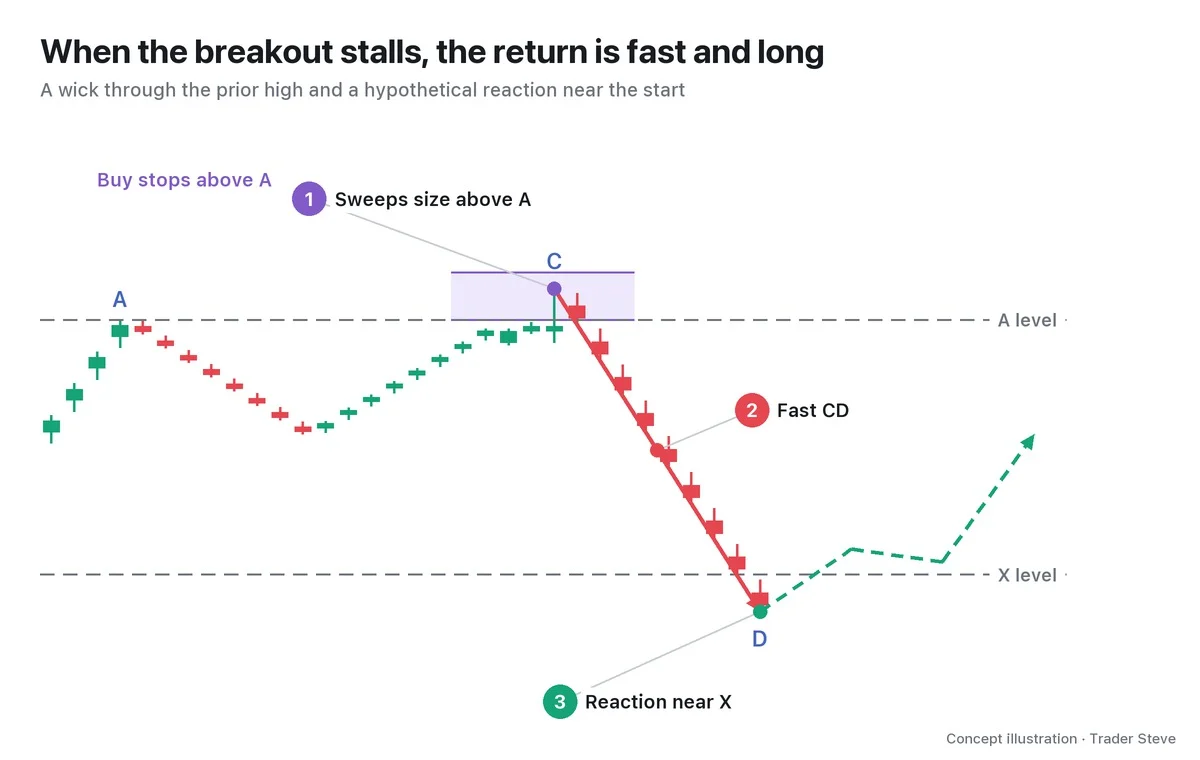
It is a lot like thinking someone has walked out the door, when they only stuck a foot over the threshold and stepped back inside. This kind of failure also connects to the swing failure pattern (SFP). The detailed distinction is covered in ICT Swing Failure Pattern (related lesson).
On the other side, the area near X is the floor where price started its earlier move. If price tests that floor again and can't go any lower, you start to see someone absorbing the selling. Explaining a reaction near a prior low, I said this:
"It taps a double bottom, and then you get a swing failure like this — it tried to push lower, failed and went up, bounced up. Once you get that structure, it completely eats up the selling pressure, and it's a spot where the trend turns. So in fact, this double bottom far more often leads to a sharp bounce." — Trader Steve, live stream, Aug 28, 2026 (translated from Korean) · ▶ Watch this moment (Short, Korean audio)
I was describing a double bottom in a Korean stock. The Shark's D connects to it because it, too, retests a prior floor. Treat this as an explanation that helps you understand the move, not a confirmed fact about who owns the orders.
4. Two Ways It Differs from Other Harmonics
Compared with the Gartley, Bat, Butterfly and Crab, there are two things to look at first in a Shark.
- C moves outside A. In those patterns C stays inside AB, but in a Shark BC has to be longer than AB. This extension leg, more than B's ratio, is what identifies a Shark.
- D is measured on XC, not XA. Because C traveled farther, the ruler has to stretch from X all the way to C. The length of CD, coming down from C, divided by XC is D's depth.
Think of XA as the first hill you climbed and XC as the full height up to the peak above it. To see how far you have come down from the peak, measuring only the hill won't do. In the illustration, XC 0.886 is inside X, and 1.13 is a little beyond X. Why I treat the two as a single band, and the detailed criteria, are covered in Part 2. For the ratios, see Basics Fibonacci (related lesson); for a comparison with the previous topic, see Harmonic Crab (related lesson).
5. A First Look at the Real Shape: ETH 12-Hour Chart
Let's look at the Ethereum (ETH) chart from spring 2024. This case was picked after the outcome was known, and D, too, is a swing confirmed only after later candles printed. All dates and times are Korea Standard Time (KST, UTC+9), and each time is the open of its candle.
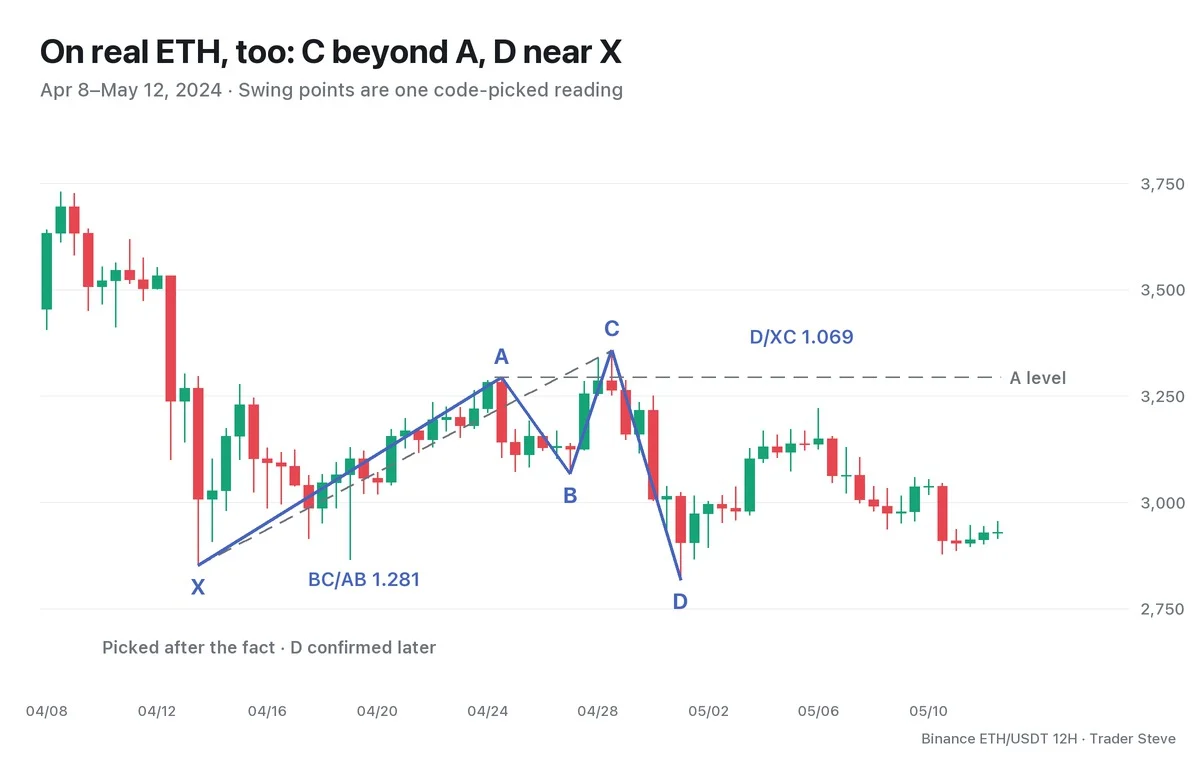
- X 2,852.0 at 21:00 on Apr 13 → A 3,293.6 at 21:00 on Apr 24 → B 3,066.7 at 09:00 on Apr 27. AB/XA is 0.514.
- C is 3,357.4 at 21:00 on Apr 28, higher than A. BC/AB is 1.281, inside the textbook range.
- D is 2,817.0 at 09:00 on May 1, slightly below X. CD/XC is 1.069 and CD/BC is 1.859; both are inside the textbook range as well.
The point here is not "the Shark called the bottom." It is the sequence: C went past A, and then a long retracement brought price back near X. The actual D landed between the two completion candidates; it did not stop neatly on a single textbook number.
6. Watch the Short Reaction Before the Big Trend
The Shark is a pattern for watching how price reacts when, after a long run, it retests the area near its starting point. Carney's description of the Shark also emphasizes the short countertrend move that follows a retest of established support or resistance. Picture a rubber band pulled hard that snaps back for a moment.
A bounce from D does not mean the whole larger trend has reversed. I first check whether the decline stops at that spot. The specific confirmation and target planning are covered in Part 3.
Key Takeaways
- The Shark is a five-point pattern in which C goes beyond A and D returns near X.
- C's extension is measured with BC/AB, and D's depth with CD/XC.
- D is where you watch for a reaction within the XC 0.886–1.13 band.
- What you look for first is a fast, short reaction, not a major trend reversal.
In Part 2, we'll turn the order for picking the five points, the ratio table and the two completion levels into a checklist.
If repeating these calculations by hand for every market gets tedious, the Omnisight Report, which brings several theories together, may help.
This lesson adapts the text, figures and live-stream quotes of the Trader Steve TA series for the web, translated from the original Korean. Check the text and figure captions for the timing and interpretation of each real example, and read conceptual diagrams and real charts separately.
Corrections: support@omnisight.report