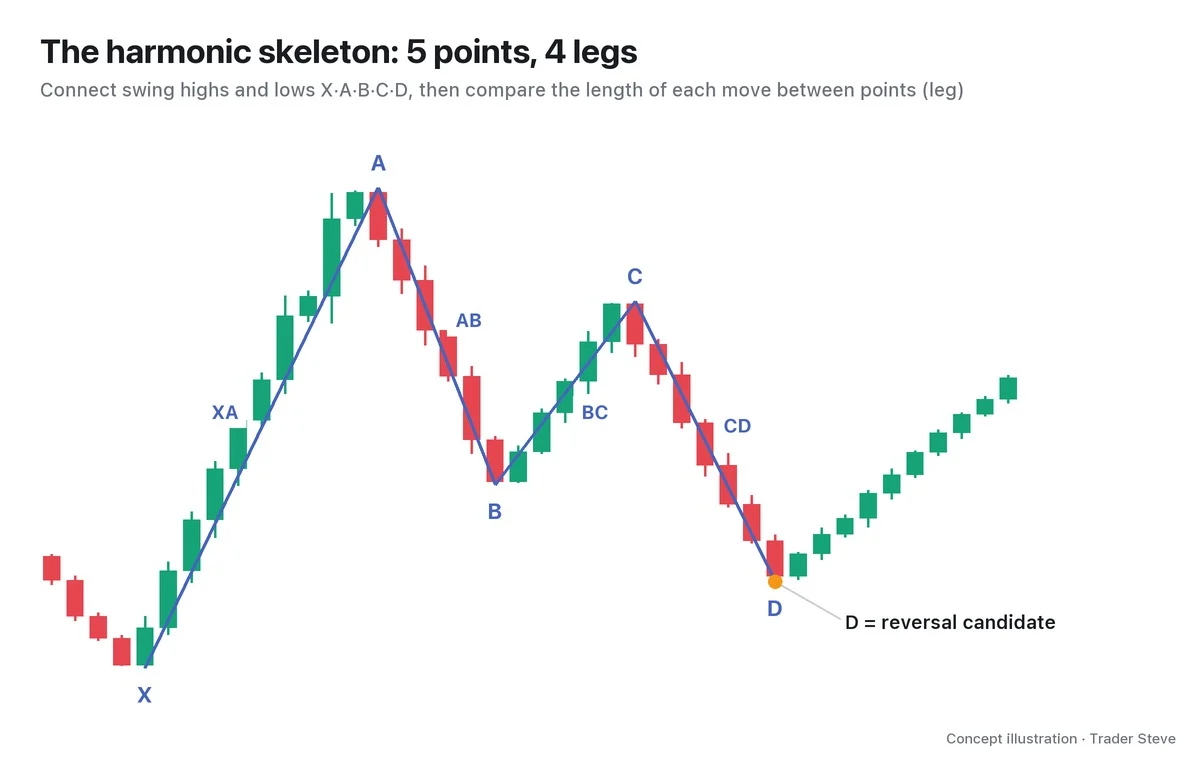
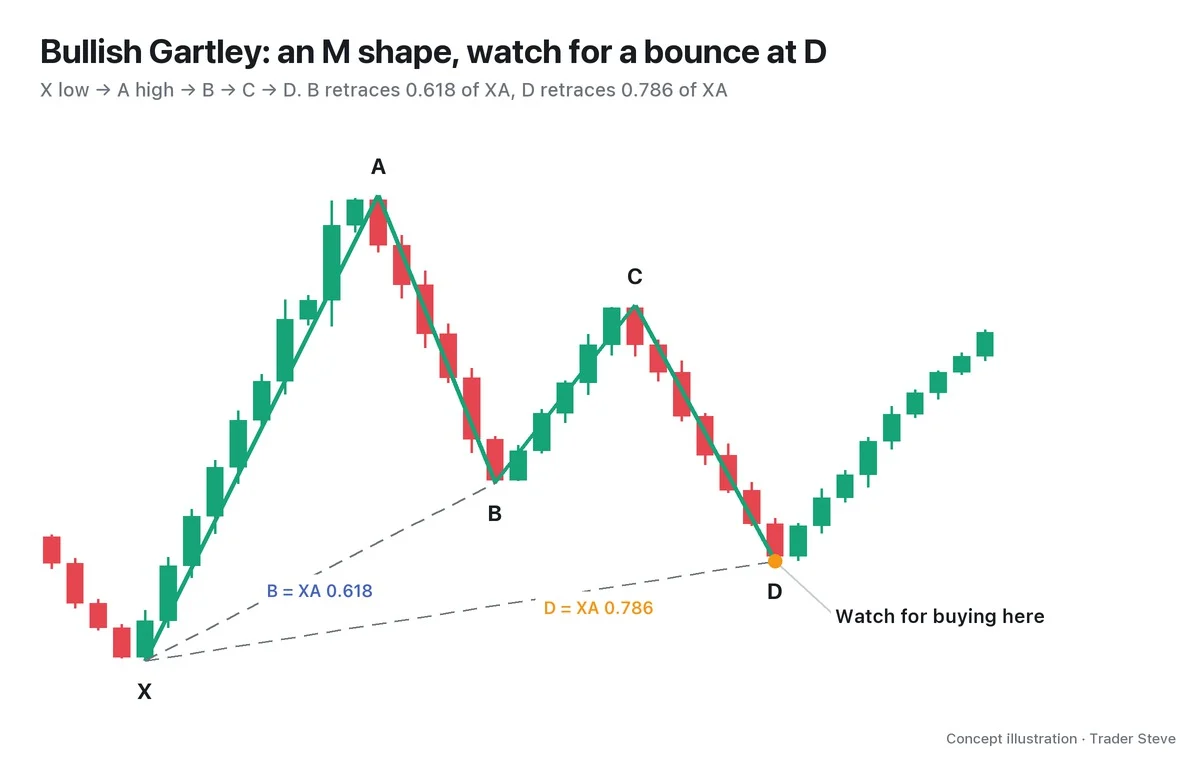
What Is the Three Drives Pattern? Why Price Turns After Three Pushes
Historical examples for learning · not current prices or trade recommendations.
Contents
Watch charts long enough and you'll see the same rhythm: price breaks a low, bounces, then breaks the low again. The Three Drives pattern is a harmonic pattern that groups this movement into three pushes and two pullbacks. This lesson uses charts to walk through the order of the six points, how the bullish and bearish versions differ, and why the final push can run out of steam.
1. The One-Line Definition: Six Points, Three Pushes, Two Pullbacks
A Three Drives pattern is a structure that pushes three times in the same direction, each time beyond the previous high or low, and pauses twice in between. The legs that push are called drives; the legs that pause in the opposite direction are called corrections.
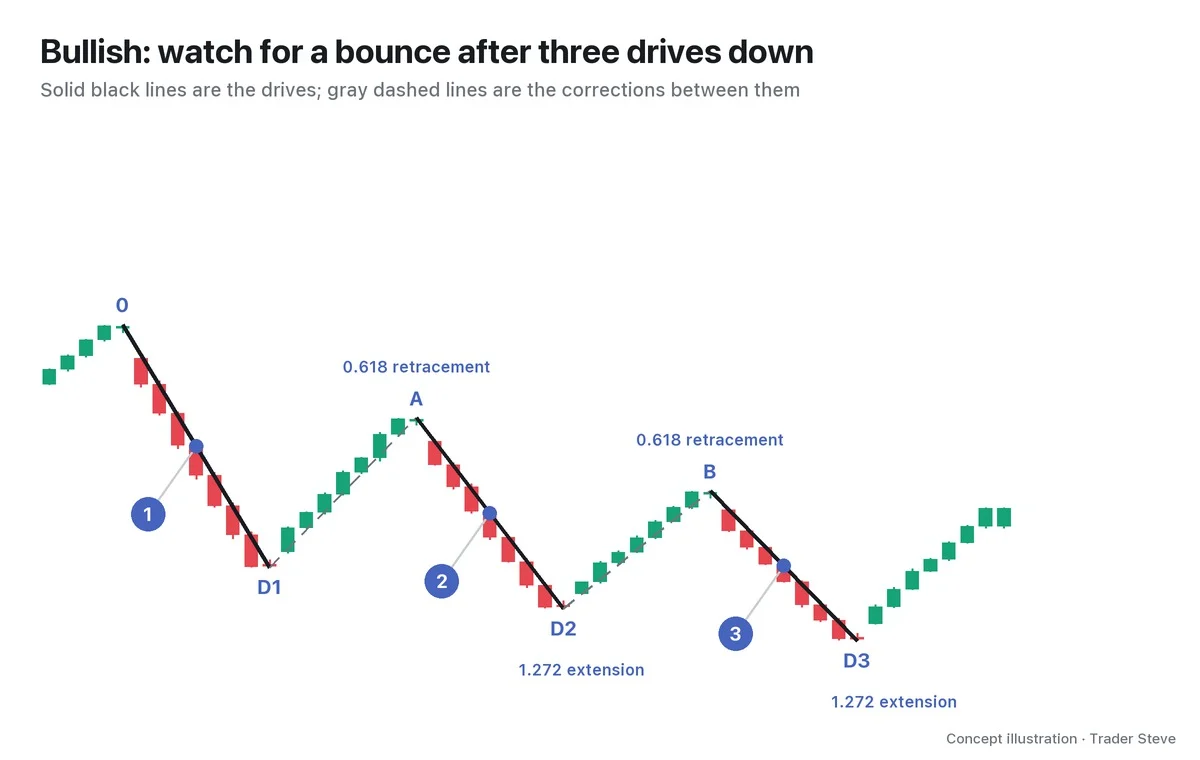
- 0 → D1: the first push. 0 is the starting point and D1 is the first low.
- D1 → A: a bounce that retraces part of the first drop.
- A → D2: price falls again and makes a low below D1.
- D2 → B: the second bounce. B stays below the earlier bounce high, A.
- B → D3: the final drop makes a low below D2.
One starting point, three points where a push ends and two points where a correction ends: six points in all. Picture walking down a staircase, stepping up briefly, then heading down again. For highs and lows, read this alongside the Basics Swings and Trend topic (related lesson).
2. The Bullish Version Comes Down; the Bearish Version Goes Up
The name follows the direction of the reaction you watch for at D3, not the direction of the three pushes. That's why the name and the picture can feel backwards at first.
| Type | Point order | Where D3 sits | What to watch at D3 |
|---|---|---|---|
| Bullish Three Drives | high → low → high → low → high → low | a new low below D1 and D2 | whether the decline stops and price bounces |
| Bearish Three Drives | low → high → low → high → low → high | a new high above D1 and D2 | whether the rally stops and price pulls back |
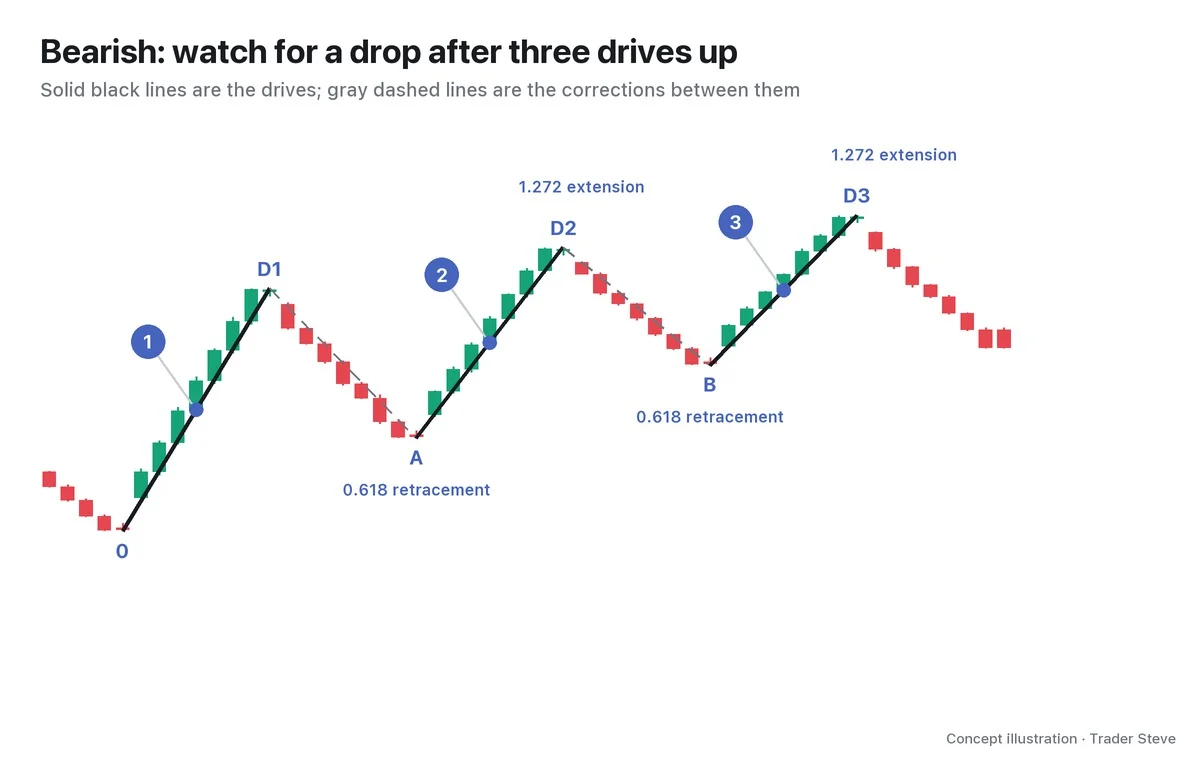
In the bullish version B stays below A; in the bearish version B stays above A. Flip the shape and the sequence is the same: pushes and corrections alternate. You also need to check how far each correction retraced in between.
3. Why It Forms: Price Can Make a New Extreme While the Follow-Through Fades
In the bullish version, when price drops below the prior low, it can trigger the stop-loss orders of long positions parked below that low, along with sell orders from traders chasing the breakdown. Those orders can push the decline one step further, but that doesn't mean fresh sellers keep piling in afterward.
- It triggers the orders beyond the prior low. The move can speed up the moment the low breaks.
- The momentum to push again fades. After the final push, there's room for the trend to pause or react the other way.
When the momentum driving a trend runs out like this, it's called exhaustion. Think of pushing a door open three times: the door opens a little wider each time, but the person pushing gets weaker. Candles alone can't tell you whose orders they are, so treat this as a way to understand order flow. The moment price reaches beyond a prior extreme ties in with ICT Liquidity Sweeps (related lesson).
On the live stream, I described the moment the momentum behind a rally runs out like this. It wasn't a comment about the Three Drives pattern itself, but it helps explain exhaustion.
"It got pushed up hard, but if you get the sense that 'this is the limit,' you have to be able to cut it right there. When you trade along with the live stream, you can feel that the push has run out. But if you just sit there blankly without that feel, going 'nice, it's pushed its way up, hold on a little longer and it's back to my average entry price, come on,' it can suddenly roll over from right there and tumble straight into hell." — Trader Steve, live stream, Oct 13, 2026 (translated from Korean) · ▶ Watch the stream highlights (Korean audio)
4. Why It's Harmonic: Ratios and Symmetry on Top of the Count
Harmonic analysis puts a ruler on the shape: Fibonacci ratios. The typical values are a 0.618 retracement and a 1.272 extension. A retracement is measured against the length of the push just before it; an extension is measured against the length of the correction just before it. The numbers in the picture may look alike, but the denominators differ.
That's why you need to keep the lengths apart. If you draw both retracements at 0.618 and both extensions at 1.272, drive 3 / drive 2 comes out to 0.618 × 1.272 = about 0.786. Equal lengths don't happen automatically. Price symmetry, whether the last two pushes are about the same length, is compared separately.
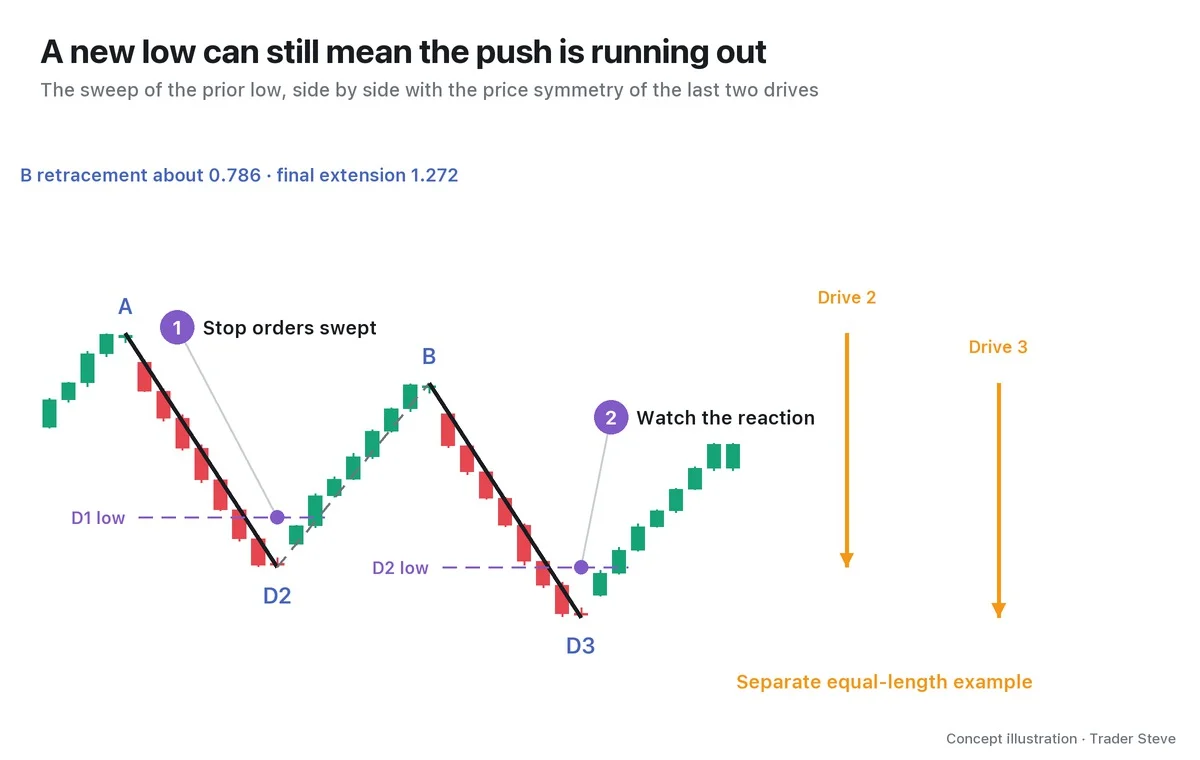
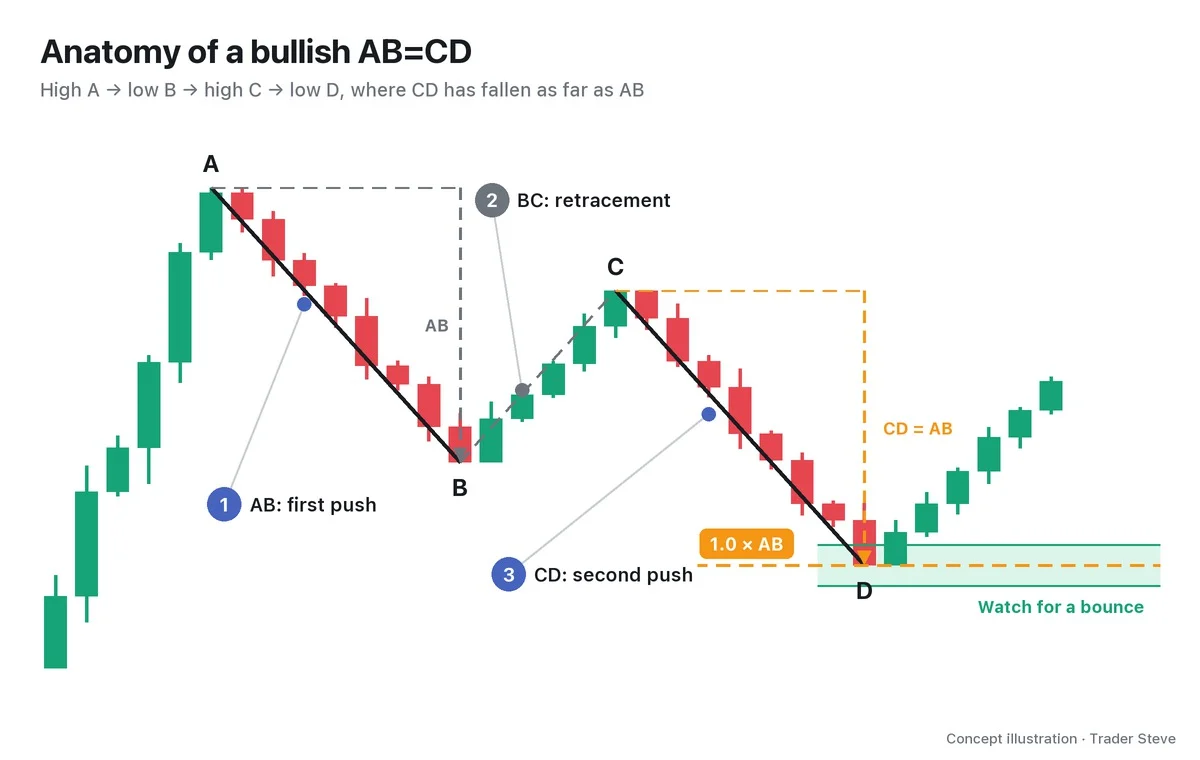
In the equal-length example, A → D2 and B → D3 are two legs in a 1:1 ratio. This connects to the equal-legs idea in the AB=CD pattern (see Harmonic AB=CD, harmonic/abcd). Three pushes in a row also resemble waves 1, 3 and 5 of an Elliott Wave impulse (see Elliott Wave Impulse Waves, elliott/impulse), but the conditions you check are different. The basics of the ratios and the potential reversal zone (PRZ) are covered in Harmonic Basics (related lesson).
5. A Quick Real Example: ETH With Approximate Ratios and Broken Time Symmetry
Let's look at the Ethereum (ETH) 4-hour chart from Aug–Sep 2026. This approximate case was picked after the fact, and the six points are swings confirmed using the candles that came later. All times are Korea Standard Time (KST, UTC+9), and each one is the open time of its candle.
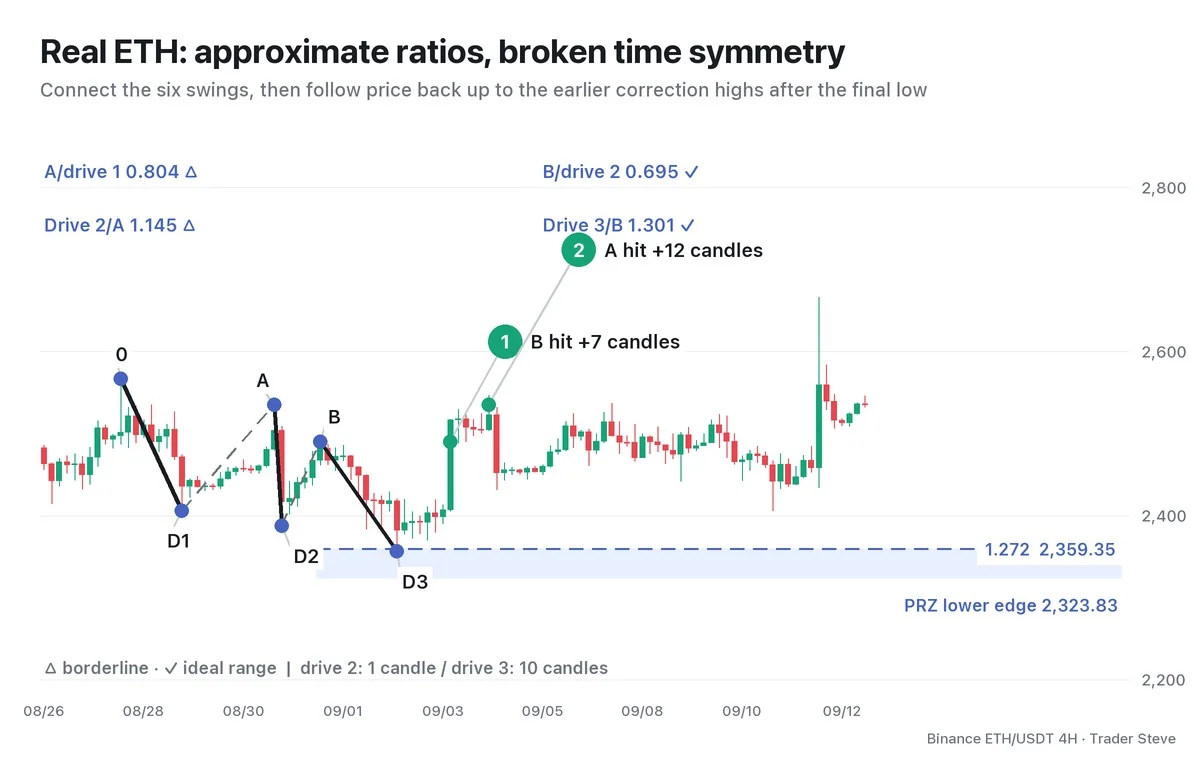
- 0 Aug 27 17:00 2,566.53 → D1 Aug 29 01:00 2,405.97 → A Aug 31 01:00 2,534.98. A/drive 1 is 0.804 △.
- D2 Aug 31 05:00 2,387.28 → B Sep 1 01:00 2,489.95 → D3 Sep 2 17:00 2,356.41. Drive 2/A is 1.145 △, B/drive 2 is 0.695 ✓ and drive 3/B is 1.301 ✓.
The first retracement of 0.804 and the second push's extension of 1.145 fall outside their ideal ranges of 0.618–0.786 and 1.272–1.618. Both are still within the tolerance limits, but they are recorded as approximate to keep them apart from the textbook version. The length ratio of the last two pushes is 0.904, so they're similar, but drive 2 took 1 candle and drive 3 took 10 candles, so the time symmetry is off.
Projecting 1.272–1.618x the last correction down from B gives a PRZ of 2,323.83–2,359.35. D3 stopped 2.94 past the 1.272 line. Price then first reached B at 21:00 on Sep 3, 7 candles later, and A at 17:00 on Sep 4, 12 candles later. For now, just note what kind of reaction followed the final low.
The lesson from a real case is less a trick for calling the third push than the habit of recording what fits and what doesn't, side by side. A trend can keep going even after the third push. D3 is a place to watch for a reaction; entry and stop-loss planning come in Part 3, and the mistake of trusting the count alone comes in Part 5.
Key Takeaways
- Read a Three Drives pattern as three pushes and two corrections: six points.
- In the bullish version, watch for a reaction after three new lows; in the bearish version, after three new highs.
- Even when price breaks a prior extreme, exhaustion can set in once follow-through orders dry up.
- Check the ratios, and the price and time symmetry of the last two pushes, separately.
- In the ETH case, 0.804 and 1.145 are approximate, and the time symmetry was off as well.
In Part 2, we'll cover the conditions for picking the six points precisely, along with the ratio table and a checklist.
If repeating this process by hand for every asset feels tedious, the Omnisight Report, which brings several theories together, may be worth a look.
This lesson adapts the text, figures and live-stream quotes of the Trader Steve TA series for the web, translated from the original Korean. Check the text and figure captions for the timing and interpretation of each real example, and read conceptual diagrams and real charts separately.
Corrections: support@omnisight.report