BOS, CHoCH and MSS Meaning: Break of Structure and Trend Reversal
Historical examples for learning · not current prices or trade recommendations.
Contents
Listen to any ICT chart breakdown and you'll keep hearing phrases like "it broke the BOS line," "we got a CHoCH," or "the MSS is confirmed." All three are names for the same kind of event: which reference line in the chart's structure (the staircase of highs and lows) price has crossed on a closing basis. This lesson explains what structure is and what a break of structure (BOS), a change of character (CHoCH) and a market structure shift (MSS) each tell you, using three diagrams and one real Bitcoin daily chart.
1. Market Structure: The Staircase of Highs and Lows
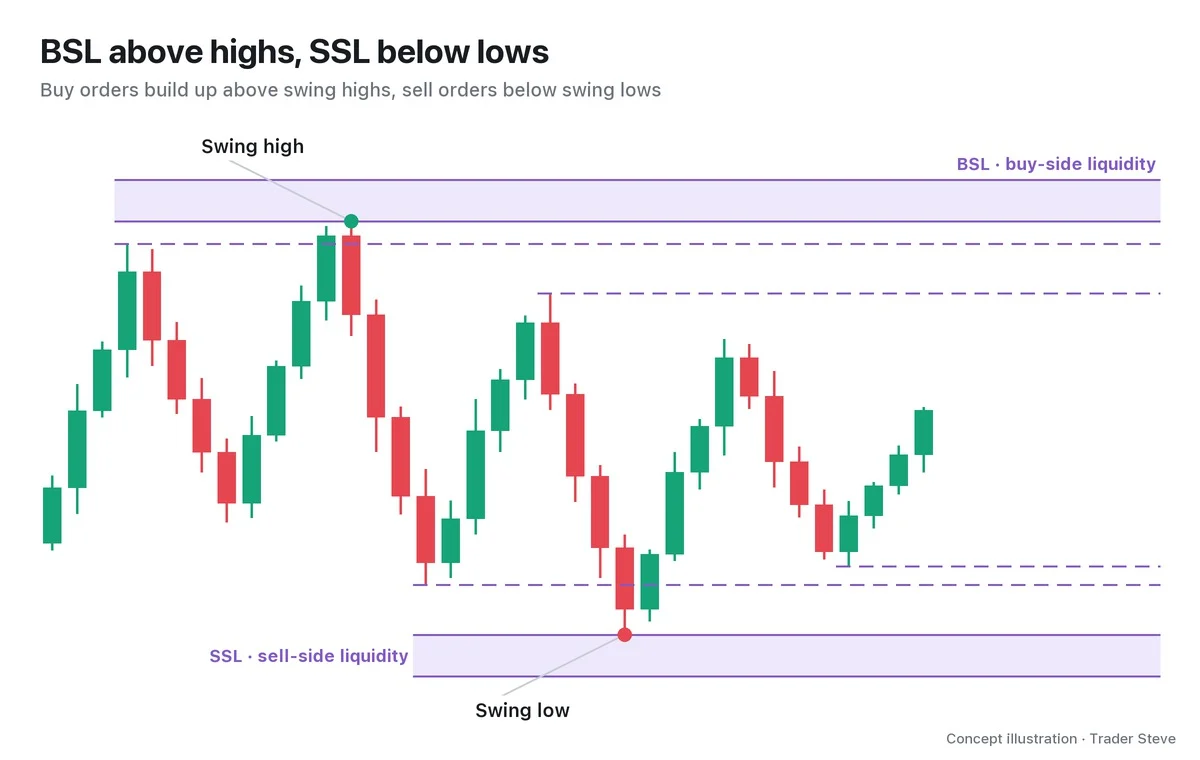
Price doesn't move in a straight line; it goes up and down. The turning points in between are swing highs and swing lows, and connecting them in order gives you a staircase.
- Bullish structure: higher highs (HH) and higher lows (HL).
- Bearish structure: lower highs (LH) and lower lows (LL).
In this series, a swing is a candle that is higher (or lower) than the 3 candles to its left and the 3 to its right (a 7-candle window in total). How to pick swings is covered in more detail in the Swings and Trend topic and the Market Structure topic.
Seen as a staircase, the most recent high and the most recent low become your reference lines. A name is attached the moment price crosses one of those lines with a close, not just a wick. Whether you call it a BOS, a CHoCH or an MSS depends on which direction it broke, whether it was the first break against the trend, and what kind of candle did it.
2. BOS: A Break With the Trend Means "It Keeps Going"
A break of structure (BOS) is a close beyond the most recent swing in the same direction as the current trend. In an uptrend, that means closing above the prior high; in a downtrend, closing below the prior low.

Each time price bounces from an HL and closes above the prior HH, you get a BOS, and that break creates a new HH. A BOS is a confirmation signal that the trend is still alive.
On my live streams I call this reference line the "BOS line." On the Oct 8 stream I described a BOS as "the line that breaks the structure": once price has pushed through that line, even if it comes back down, the structure has already broken, so I treat it as having turned up.
3. CHoCH: The First Break Against the Trend Is a Warning That "It May Change"
A change of character (CHoCH) is the first closing break against the direction of the current trend. In an uptrend, a close below the most recent low that was holding up the rally (the HL) is a CHoCH. Which of several lows to use as the reference is covered in detail in Part 2.
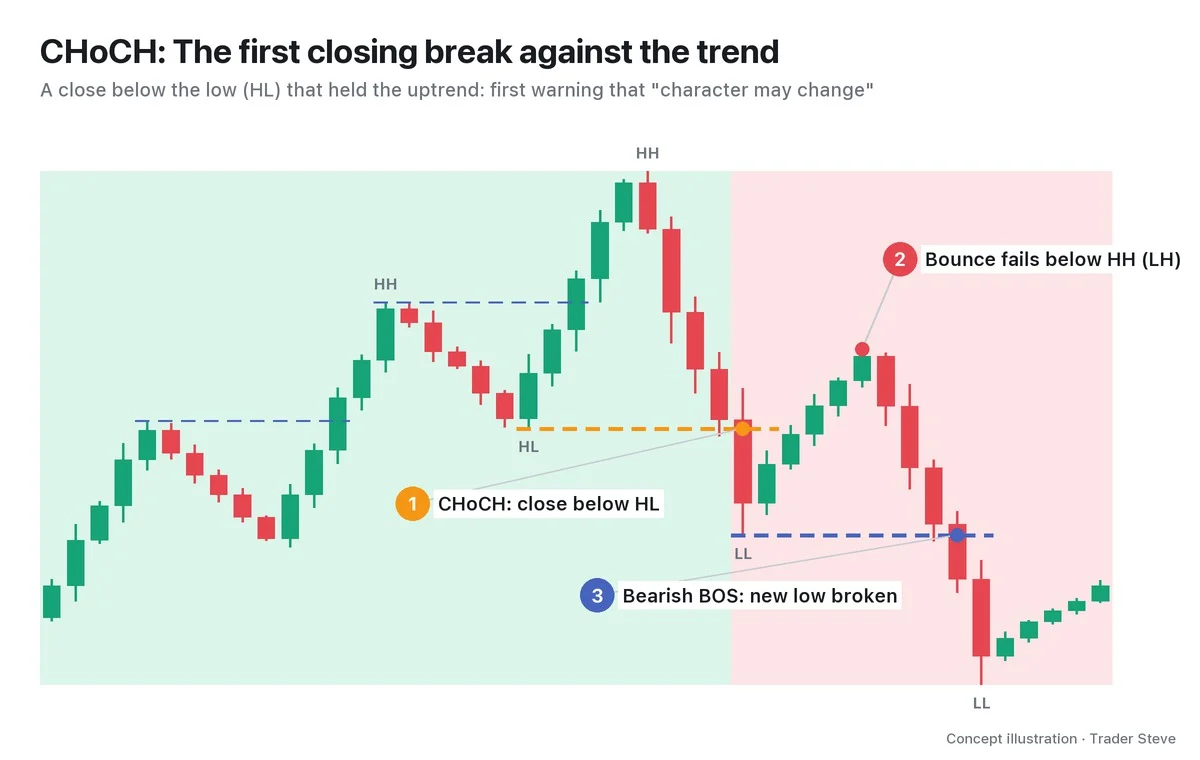
A close below the HL means the buyers couldn't defend that level.
But a CHoCH is a warning, not a confirmation. As in the diagram, a bearish structure only takes hold after the bounce fails to clear the previous HH, forms an LH, and is followed by a bearish BOS that breaks the new low. It's also common for price to reclaim the high right after a CHoCH (failure cases are covered in Part 4).
Flip the direction and it's a mirror image. In a downtrend, a close above the most recent high that was capping the decline (the LH) is a bullish CHoCH.
"Because it broke through all the BOS lines and change-of-character lines in front of it, the structural shift to the upside has basically happened." — Trader Steve, live stream, Aug 27, 2026 (translated from Korean) · ▶ Watch the stream highlights (Korean audio)
4. MSS: Sweep the Liquidity, Break With a Large Candle, and the Case for a Reversal Gets Stronger
Market structure shift (MSS) is ICT's original term. In this series, I define it in practical terms as a CHoCH that comes with a strong displacement candle. The typical sequence has three steps.
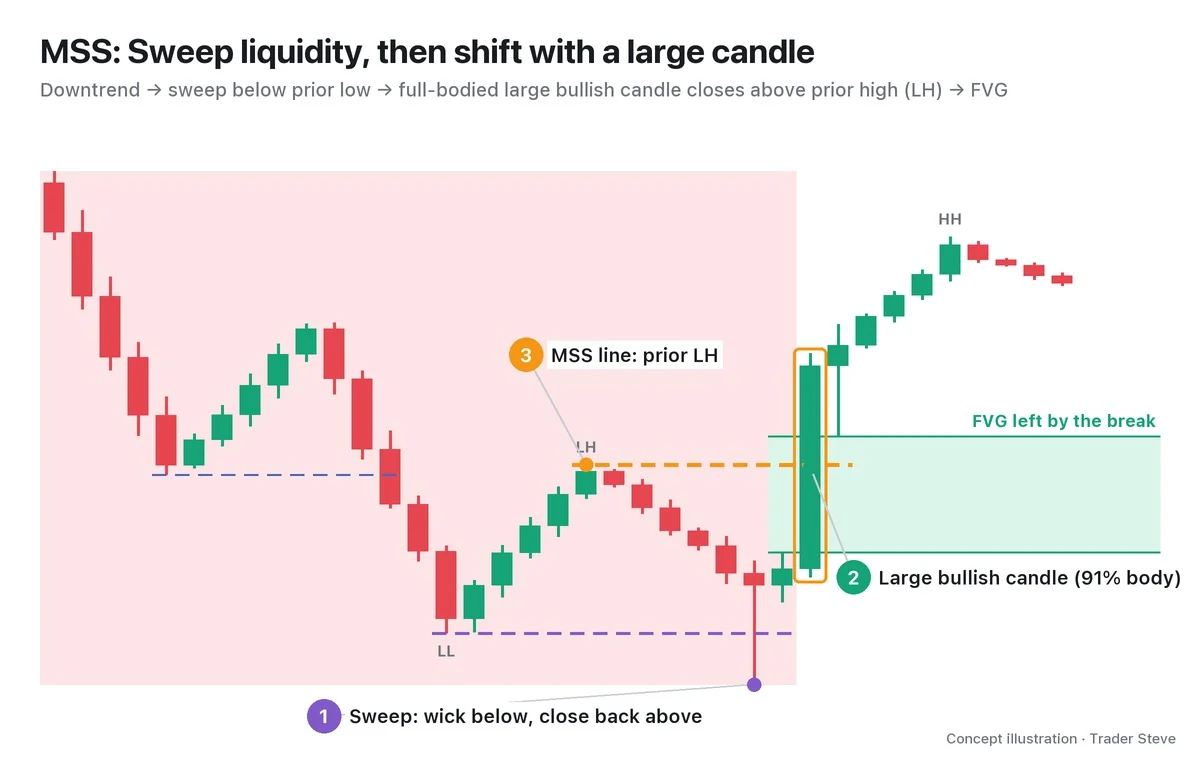
- Sweep: a wick pokes below the prior low and takes the stop-loss orders resting there, but the candle closes back above the low. It didn't close below, so it is not a bearish BOS.
- Large candle: right after, a full-bodied large bullish candle appears (in the diagram, the body is 91% of the candle's full range).
- Break of structure + FVG: that large candle closes above the prior LH and, because it moved up so fast, leaves a fair value gap (FVG).
A CHoCH and an MSS break the same reference line; the difference is how it broke. An MSS that swept liquidity and broke with a large candle carries more weight as evidence of a reversal than a CHoCH where a small candle barely made it across. Note that in smart money concepts (SMC), CHoCH and MSS are often used almost interchangeably. What counts as a large candle is covered in detail in the next topic, Displacement.
| Type | What it breaks | What it tells you | Conviction |
|---|---|---|---|
| BOS | The prior high (uptrend) or low (downtrend) in the trend direction | The trend is continuing | Confirmation (existing direction holds) |
| CHoCH | The reference swing against the trend (the HL in an uptrend) | Character may be changing | First warning (failures are common) |
| MSS | The same line as a CHoCH, but with a sweep, a large candle and an FVG | Structure is shifting | Stronger evidence than a CHoCH |
5. A Real Bitcoin Daily Chart: One CHoCH, Two Bearish BOS
I redrew the Bitcoin daily chart for Apr–Jun 2026 using the same rules (swings with 3 candles to the left and 3 to the right, 7 candles in total; breaks judged on the close).
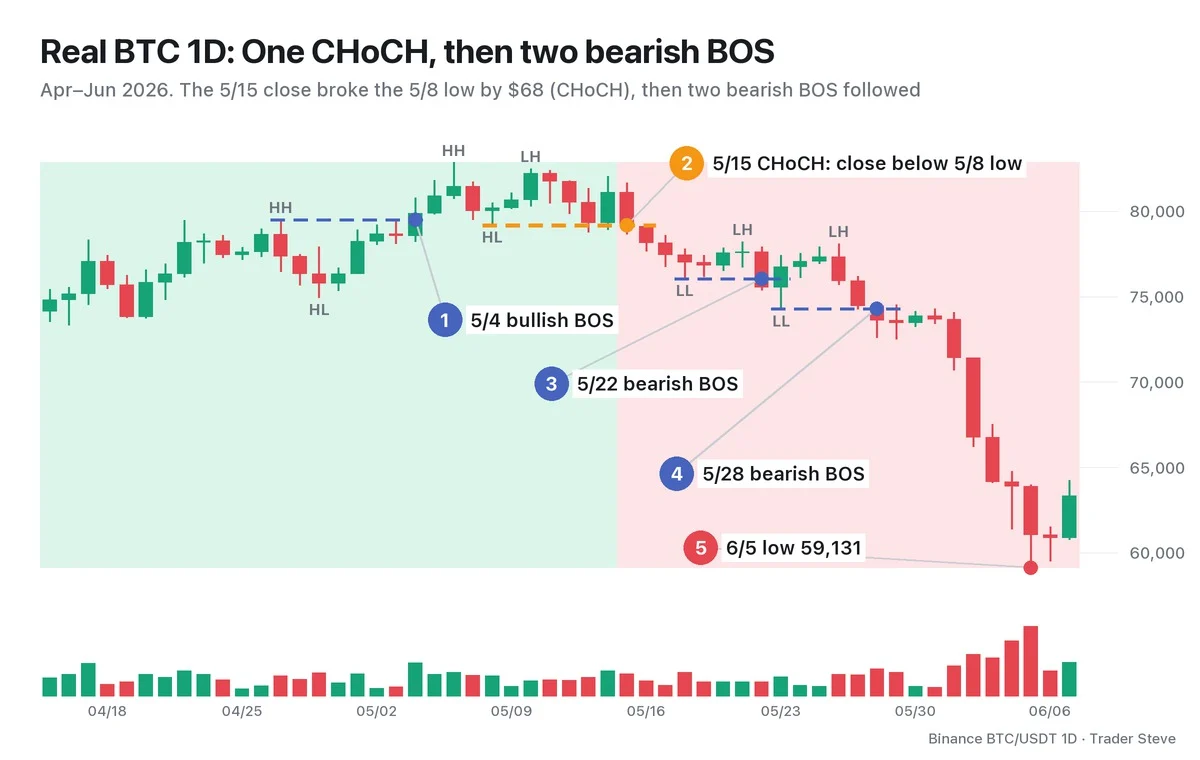
- Uptrend: the low rose from 73,724 on Apr 20 to 74,938 on Apr 29 (HL), and the May 4 close of 79,861 cleared the Apr 27 high of 79,486 for a bullish BOS (①). The May 6 high of 82,850 is the HH.
- Warning: the May 10 bounce stalled at 82,479 and failed to clear the HH. The May 15 close of 79,113 then broke below the May 8 low of 79,181 — the start of that bounce and the most recent HL — by $68, for a CHoCH (②).
- Confirmation: the May 22 close of 75,540 broke the May 18 low of 76,051, and the May 28 close of 73,618 broke the May 23 low of 74,290, giving two bearish BOS in a row (③④). The daily low on Jun 5 was 59,131, 28.6% below the May 6 high.
The 5/15 CHoCH candle was -2.44%, with a 66% body (it passed the 65% threshold), a range of 1.50x the average true range (ATR) and no FVG, so it fell short of the four shared displacement conditions (see ICT Displacement Part 2, ict/displacement/blog02). At that point it was a CHoCH, not an MSS — still the warning stage. What confirmed the warning was the BOS that followed (the 5/22 candle was a bearish candle with an 82% body ratio). This is why you don't draw a conclusion from the CHoCH alone; you watch whether a BOS follows.
"It's taken out the high now. So like it or not, a structural shift into a pattern of higher highs and higher lows is happening." — Trader Steve, live stream, Aug 28, 2026 (translated from Korean) · ▶ Watch the stream highlights (Korean audio)
It's the same principle, just in the opposite direction. When a chart that has been sliding closes above its prior high, you first accept that, like it or not, the structure is changing. Structure is decided by the close, not by your expectations.
Key Takeaways
- Market structure is the staircase of highs and lows: HH and HL in an uptrend, LH and LL in a downtrend.
- BOS: a close beyond the most recent swing in the trend direction. It confirms the trend is continuing.
- CHoCH: the first closing break against the trend. It is a first warning, not a confirmation, so you confirm it with the LH and BOS that follow.
- MSS: a CHoCH that comes with a sweep → large candle → FVG. It breaks the same line, but the evidence is stronger.
- All three are judged on the close, not the wick.
In Part 2, we'll cover the rules for finding BOS and CHoCH precisely on a chart, including which highs and lows count as swings and how to tell a wick break from a close break.
If running this structure check by hand every day across many markets and timeframes is too much, take a look at the Omnisight Report below.
This lesson adapts the text, figures and live-stream quotes of the Trader Steve TA series for the web, translated from the original Korean. Check the text and figure captions for the timing and interpretation of each real example, and read conceptual diagrams and real charts separately.
Corrections: support@omnisight.report