
What Is a Breaker Block? How a Broken Order Block Flips Its Role
Historical examples for learning · not current prices or trade recommendations.
Contents
Sometimes you expect a reaction at an order block and price simply runs straight through it. Most traders erase that zone and move on, but ICT gives a separate name to the case where a broken order block is later used again in the opposite role. That zone is the breaker block (BB). This lesson uses charts to show what a breaker is and why it ends up playing the opposite role from the one it started with.
1. The One-Line Definition: A Failed Order Block Used in Reverse
A breaker is an order block that was broken after price swept liquidity once and shifted structure. When price returns to that zone after the break, what used to be resistance acts as support, and what used to be support acts as resistance.
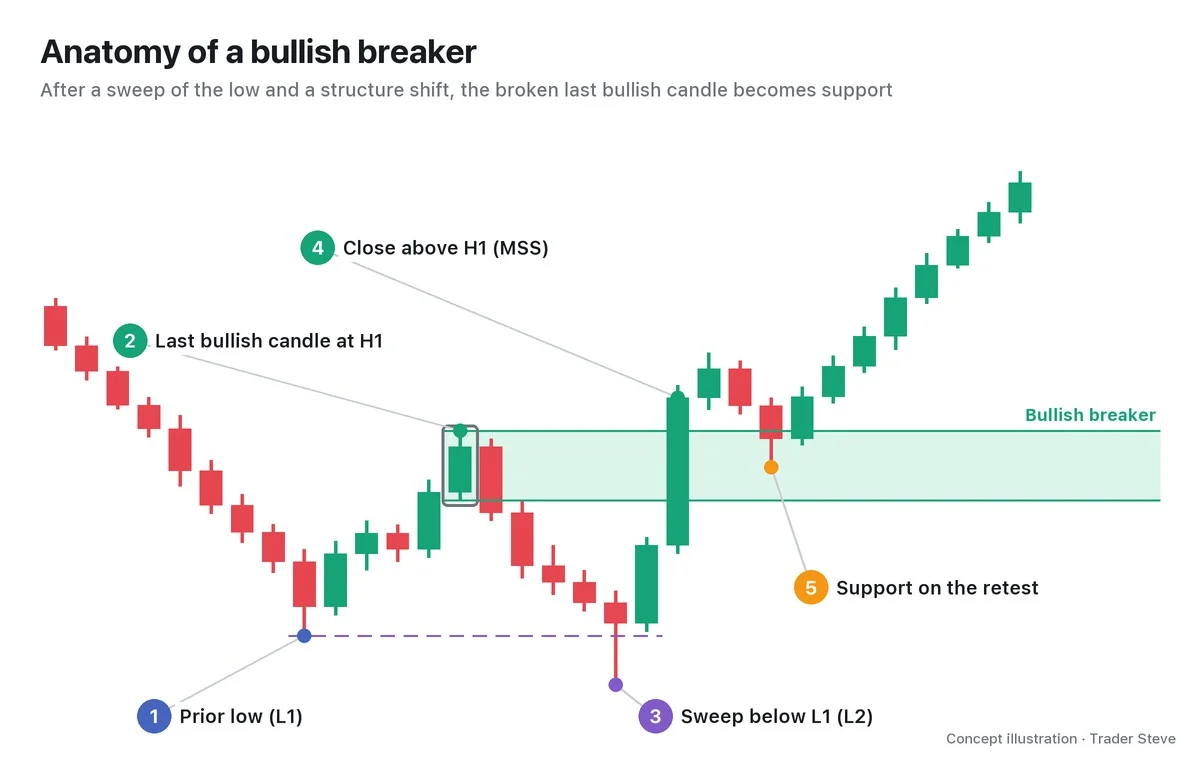
Follow the chart in order:
- Price makes the low L1 and rises.
- There is a last bullish candle that makes the high H1. Selling comes in there and price falls, so this candle starts out as a bearish order block (OB).
- Price drops below L1, sweeps the stop orders resting under it (a liquidity sweep) and makes the low L2.
- A strong bullish candle follows right away and moves above H1 on a closing basis. Price has broken the most recent swing in the opposite direction, so this is a market structure shift (MSS). The order block from step 2 is broken at the same time.
- When price pulls back and reaches the range of that last bullish candle (the green box), it now reacts as support, not resistance.
This green box is a bullish breaker. The zone covers the candle's full range, from its low to its high, and the 50% price between the high and the low is called the mean threshold (MT). The MT is the midpoint of the block's defined low and high. The midpoint of the body is kept separate and labeled body-mid.
2. Bullish and Bearish Breakers
Breakers come in two directions, and the bearish one is the bullish one flipped upside down.
| Type | Sequence | Key condition | Breaker candle | New role |
|---|---|---|---|---|
| Bullish breaker (+BB) | L1 → H1 → L2 → close above H1 | L2 < L1 (sell-side liquidity sweep) | the last bullish candle that made H1 | resistance → support |
| Bearish breaker (-BB) | H1 → L1 → H2 → close below L1 | H2 > H1 (buy-side liquidity sweep) | the last bearish candle that made L1 | support → resistance |
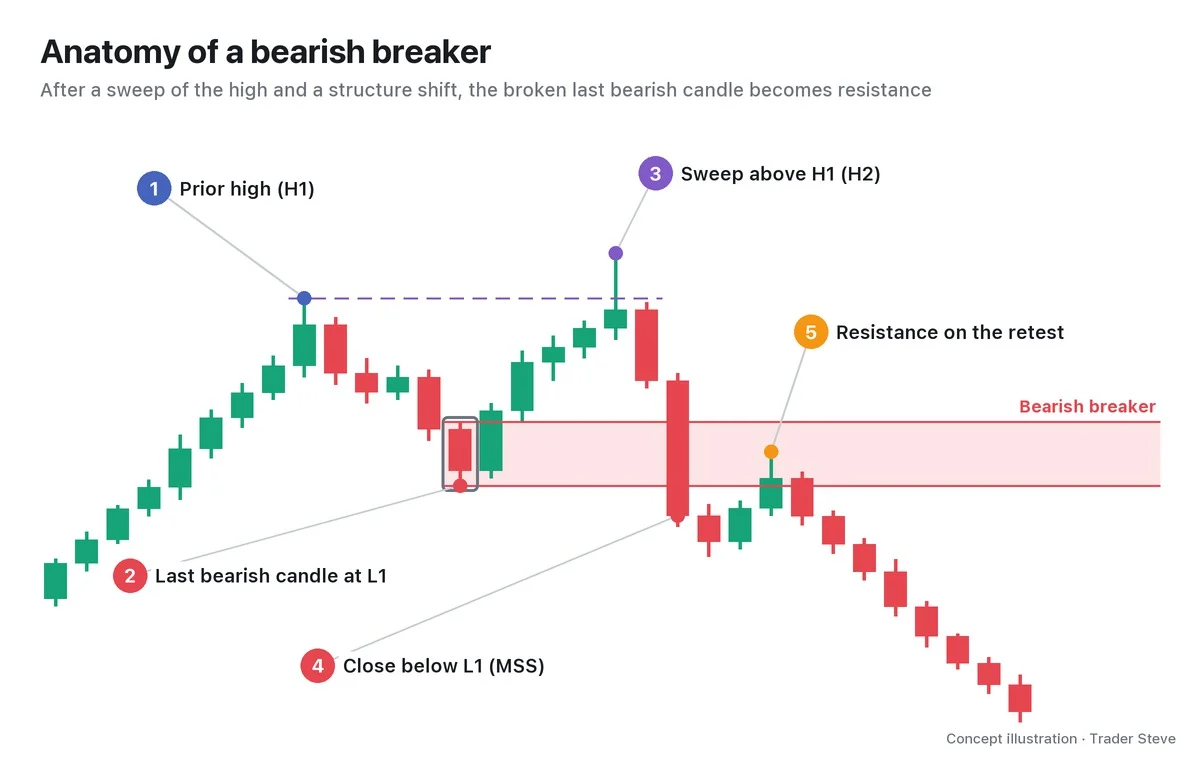
The most important column in the table is "Key condition." For a bullish breaker, the second low must be lower than the first (L2 < L1). That is the footprint of price sweeping the stop orders clustered below the first low before it turned up.
3. Why the Role Flips: Trapped Traders Looking to Break Even
How can the same price zone be resistance first and support later? It makes sense once you follow the position of the people who placed orders there.
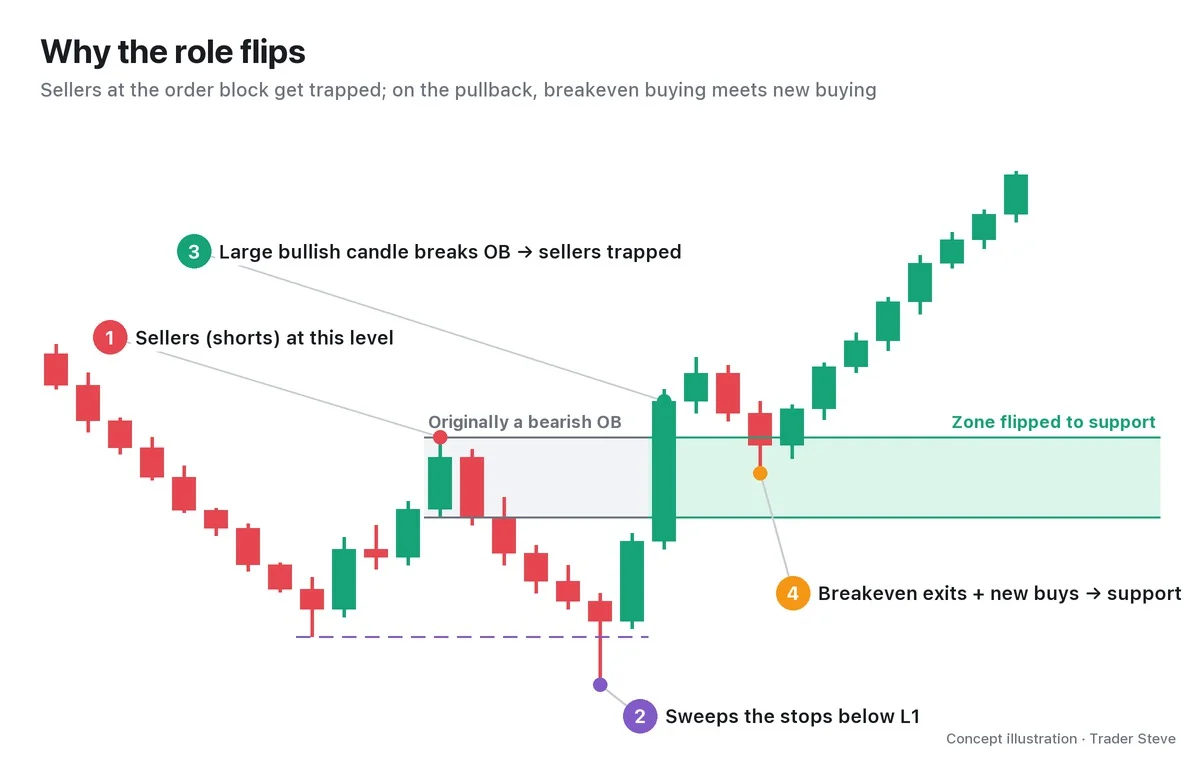
① At first, the people who sold near H1 look right, because price falls. But ② price sweeps below L1 and absorbs all the stop orders sitting there, and then ③ a large bullish candle carries price above H1. Now the people who sold near H1 are trapped in a losing position.
On the live stream, I explained why order blocks get broken like this:
"Once price reaches this yellow box, inside this weekly order block, people go long here in a big way. Then someone dumps all their size into that and price comes back down. Why? Because they need to buy it back cheap." — Trader Steve, live stream, Oct 21, 2026 (translated from Korean) · ▶ Watch the stream highlights (Korean audio)
When many people place orders in the same direction at an order block, the other side can build a position by filling all that size. The more an order block is "the level everyone is watching," the more often it gets swept and broken like this.
④ When price later returns to that zone, two kinds of buying overlap. One is the trapped sellers buying to close their positions near breakeven (closing a short is a buy order). The other is new buying from traders who saw the structure shift. That is how a place where selling used to come in turns into a place that holds price up.
The principle itself is the same role reversal covered in Basics Support and Resistance. On the live stream, I call it the support/resistance flip (S/R flip).
"An S/R flip is nothing fancy. It's a flip of support and resistance — a spot where a reversal happened. These are lines that used to be resistance but turn into support once they're broken — you could call them support/resistance lines." — Trader Steve, live stream, Oct 1, 2026 (translated from Korean) · ▶ Watch the stream highlights (Korean audio)
4. How It Differs From an Order Block and an S/R Flip
The three look alike, but the conditions you check are different.
- Order block (see ICT Order Blocks, ict/ob): the last opposite-color candle right before a strong move. You expect a reaction in the original direction.
- S/R flip (see Basics Support and Resistance, basics/support-resistance): the general phenomenon of broken support or resistance playing the opposite role. It has no extra conditions.
- Breaker: only those S/R flips where an existing OB was closed through together with an MSS, after a sweep of the opposite side's liquidity. Price must first sweep the opposite high or low (①) and then break the most recent swing on a closing basis (②).
If one condition is missing, the name changes too. If an order block was broken but there was no sweep beforehand (on the bullish side, L2 is higher than L1), it gets a separate name: mitigation block (MB). The difference between the two is covered in detail in Parts 2 and 5, and in the next topic, ICT Mitigation Blocks (related lesson).
5. A Real BTC Daily Chart
Let's find the same sequence on a real Bitcoin (BTC) daily chart.
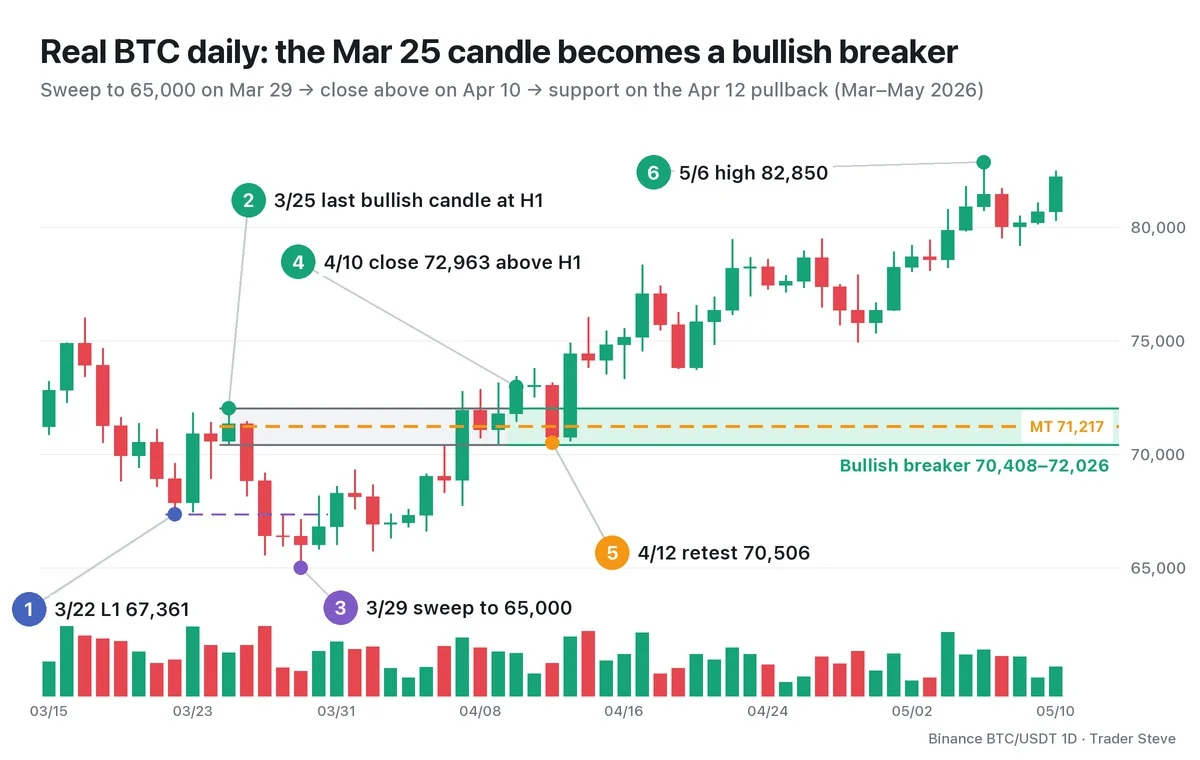
- The Mar 22 low of 67,361 is L1.
- The Mar 25 bullish candle made the high of 72,026. It is the last bullish candle that made H1.
- On Mar 29, price fell below L1 to 65,000 and swept it.
- A +4.5% large bullish candle printed on Apr 7, but it closed at 71,924, just below H1. Price moved in and out of the zone from Apr 7 to Apr 9, and the first close above H1 came on Apr 10 (close 72,963). That confirms the structure shift.
- On Apr 12, price pulled back to a low of 70,506 and touched the zone for the first time. It dipped to between the MT (71,217) and the zone low, but closed at 70,741, inside the zone.
- From there, price rallied to the May 6 high of 82,850, about 17.5% above the retest low. No daily candle closed below the zone along the way.
I picked this case because it worked out. Breakers fail too. If price closes on the far side of the zone (for a bullish breaker, below the zone low), the breaker is invalid. Part 4 looks at successful and failed cases side by side.
A back-up (BU) is an ordinary resistance-to-support retest. It overlaps with a breaker only when the sweep, the MSS and the close through the OB are all in place.
Key Takeaways
- A breaker is the zone where an order block broken by a sweep plus a structure shift plays the opposite role.
- A bullish breaker is the last bullish candle that made H1 (support); a bearish breaker is the last bearish candle that made L1 (resistance).
- The key conditions are the sweep (L2 < L1, H2 > H1) and a structure shift on a closing basis.
- The role flips because trapped traders exiting near breakeven and new entries overlap in the same price zone.
- It is not a confirmed signal. A close on the far side of the zone invalidates it.
In Part 2, we'll cover the four steps for finding a breaker on a chart (sweep → structure shift → picking the candle → first retest) and how to draw the zone.
Checking the sweep and the structure shift by hand for every market takes time. The Omnisight Report lays out these structures for each market.
This lesson adapts the text, figures and live-stream quotes of the Trader Steve TA series for the web, translated from the original Korean. Check the text and figure captions for the timing and interpretation of each real example, and read conceptual diagrams and real charts separately.
Corrections: support@omnisight.report


