What Is Displacement? Displacement Candles and Big-Player Footprints
Historical examples for learning · not current prices or trade recommendations.
Contents
Charts are full of large candles. Some form because serious money piled into one side; others spike briefly and drift right back to where they started. In ICT, the first kind — a move with real conviction behind it — is called displacement. This lesson uses charts to show what displacement is, why it happens, and what footprints it leaves on a chart.
1. The One-Line Definition: Fast, Large and One-Directional
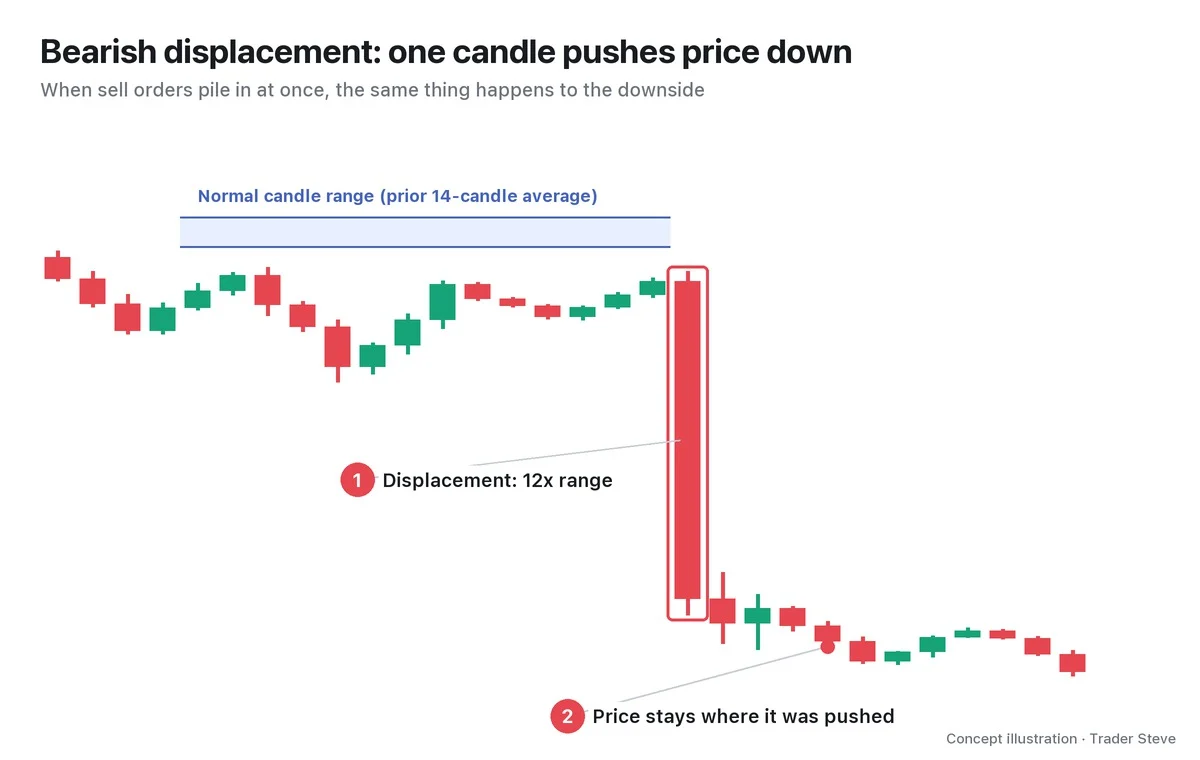
Displacement is a move in which big players' orders pile into one side and push price quickly and far in a single direction. The candle at the center of that move is called a displacement candle.

The blue band at the bottom of the chart shows how far each of the previous 14 candles normally moved (the average range). The displacement candle covered 11x that distance in a single candle. Three words sum it up:
- Fast: price gets there in one or two candles, not slowly over many.
- Large: the move dwarfs what a normal candle covers.
- One-directional: no back-and-forth; the body is full and the candle travels one way.
Also note ②: price doesn't snap right back after being pushed — it stays near where it landed. That tells you the market has, for now, accepted that price.
2. Bullish and Bearish Displacement
Displacement comes in two directions. When buy orders pile in, price is pushed up; when sell orders pile in, it is pushed down.
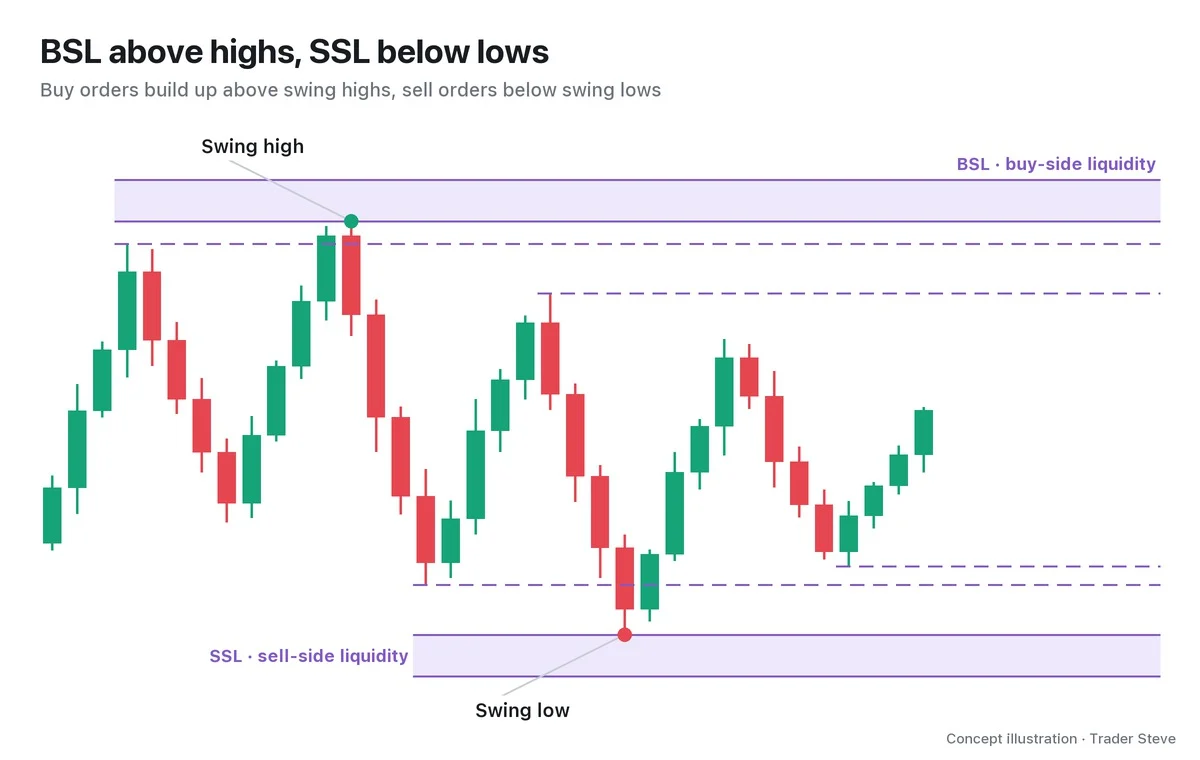
| Type | What it looks like | What it means |
|---|---|---|
| Bullish displacement | Large, full-bodied bullish candle with a short upper wick | Large buy orders absorb the sell-side supply all at once and drive price up |
| Bearish displacement | Large, full-bodied bearish candle with a short lower wick | Large sell orders absorb the buy-side demand all at once and drive price down |
One point to settle here: not every large candle is displacement. A large candle with a long wick, or one that spikes on a news headline and reverses on the very next candle, may be big, but leaves no sustained one-directional push behind it. Part 2 breaks this distinction down condition by condition.
3. Why It Happens: Pushing Price Costs Money
For price to go up, someone has to buy the sell orders stacked above it. Buy a little at a time and price rises a little at a time. But when a big player buys in one go, the supply above is consumed all at once and price gets pushed higher. In other words, pushing price in one direction costs money.
I once walked through this from the big players' point of view while explaining a liquidation map on the live stream.
"Going up from here, you have to keep buying as you push it, right? Pushing price up like this costs money. Once you factor in that cost too … I'd have to spend my own money buying about 200 more." — Trader Steve, live stream, Oct 1, 2026 (translated from Korean) · ▶ Watch this moment (Short, Korean audio)
That is why a displacement candle is a footprint showing that someone actually spent money to push price. And that much money is not something a handful of individual traders can put up. When a large candle printed right after a US stock's earnings release, I said this:
"Nvidia's earnings come out and — boom! … Look at that volume explode. The volume is just insane. The institutions are simply sweeping it higher. … Volume this huge isn't something retail traders can produce." — Trader Steve, live stream, Aug 27, 2026 (translated from Korean) · ▶ Watch the stream highlights (Korean audio)
On the live stream, I use phrases like "large bullish candle / large bearish candle," "breaking through with the body" and "a breakout on volume" more often than the word "displacement." They point to the same thing: a place where large orders piled into one side and pushed price away.
4. Four Footprints Displacement Leaves
You can't see directly whether big money was behind a move. Instead, you confirm it from the footprints the move leaves on the chart.
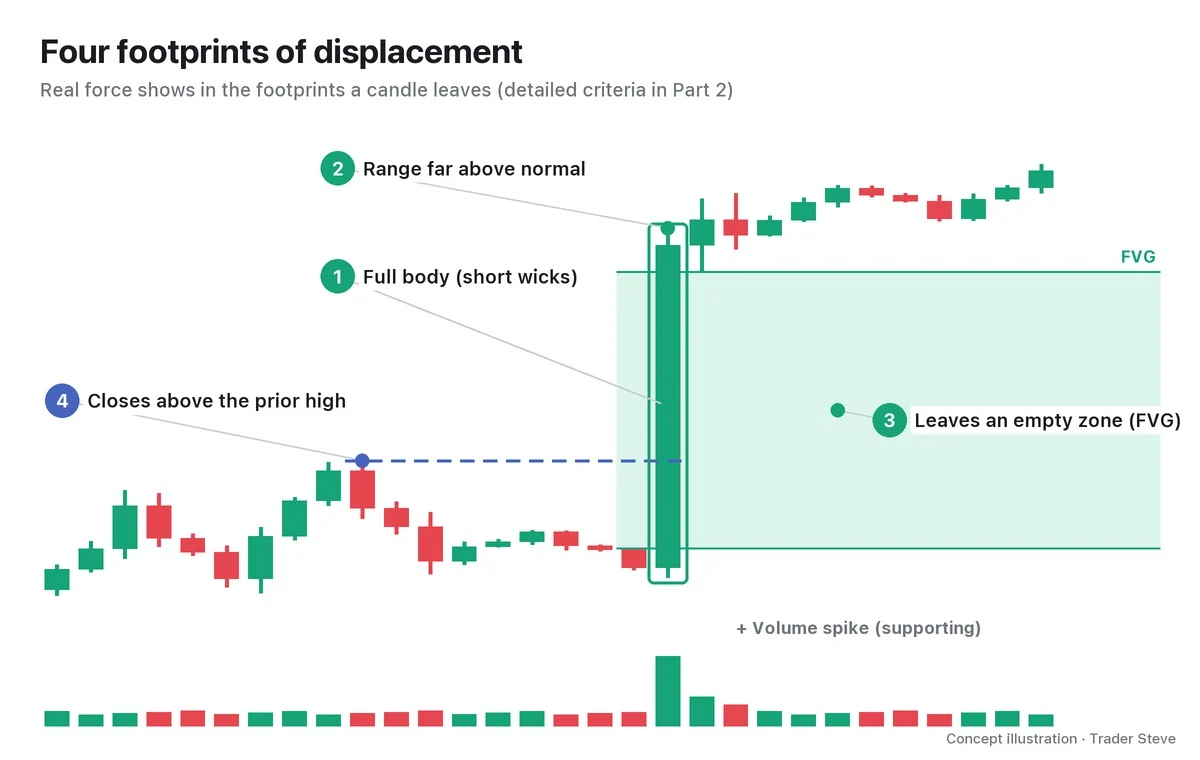
- A full-bodied candle: the body takes up most of the candle's length. Short wicks mean the other side barely pushed back.
- A range far above normal: clearly larger than the average range of recent candles.
- It leaves a fair value gap (FVG): price moves so fast that the wicks of the candles before and after don't overlap, leaving an empty price zone. Think of an FVG as the track displacement leaves behind (for details, see ICT FVG Part 1, ict/fvg/blog01).
- It closes beyond the prior high (or the prior low, for a move down): not a wick poking through, but a body that crosses and closes on the other side. This is what leads to a market structure shift (MSS) (see ICT BOS and CHoCH, ict/bos-choch).
A volume spike is supporting evidence. When it shows up too, the move is more convincing, but volume alone doesn't make something displacement. The next part covers how to test these four footprints with numbers. If reading candle bodies and wicks is new to you, you may want to start with Basics Candlesticks (related lesson).
5. A Real Ethereum Chart
Let's see how the concept illustration looks on a real chart, using the Ethereum (ETH) 4-hour chart. Every number below was recalculated from Binance prices. All dates and times are Korea Standard Time (KST, UTC+9).
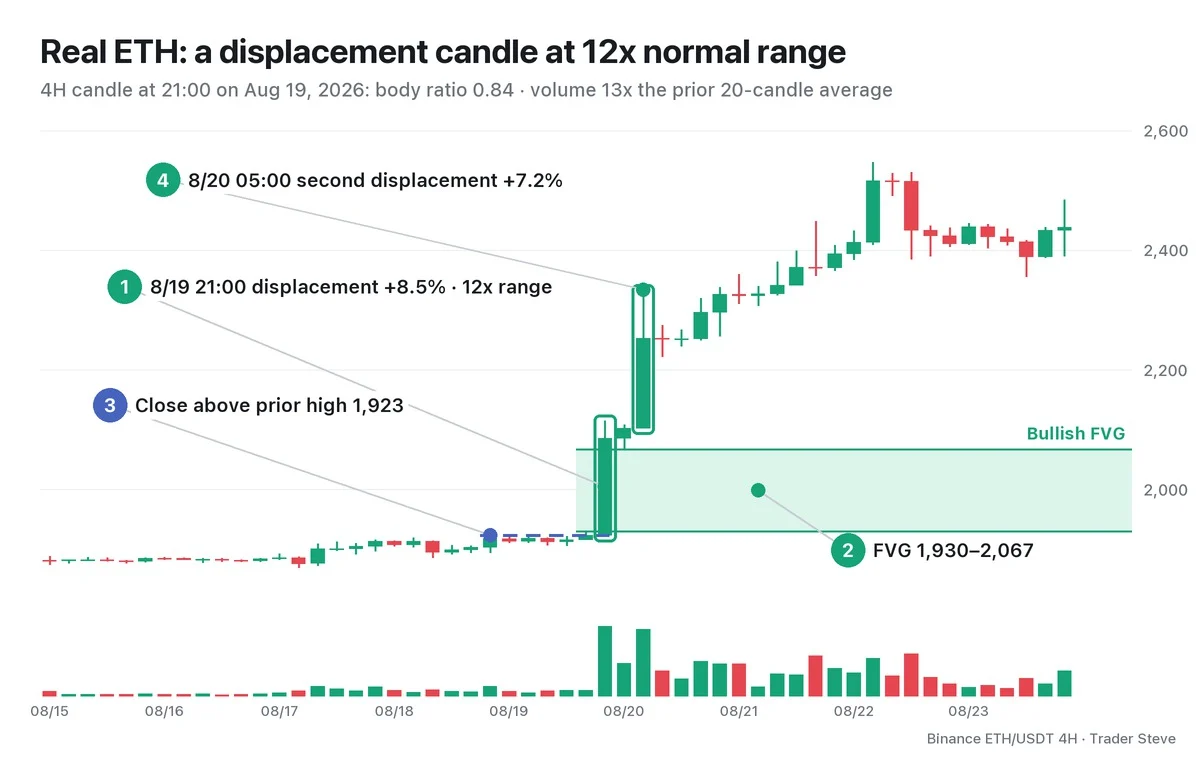
From the early hours of Aug 15 through the 17:00 candle on Aug 19 — nearly five days — the gap between Ethereum's high and low was just 3.3%. Then a single 4-hour candle at 21:00 on Aug 19 pushed price from an open of 1,923 to a close of 2,086, a +8.5% move in one candle.
- Body: body ratio 0.84. The body takes up most of the distance between the high of 2,115 and the low of 1,922.
- Range: this candle's range was about $193; the average range of the prior 14 candles was about $16. That's 12x normal.
- FVG: it left a bullish FVG at 1,930–2,067 between the candles before and after it.
- Break of structure: it closed above the prior high of 1,923, set by the 21:00 candle on Aug 18.
- Volume: 13x the average of the prior 20 candles.
After one pause candle, the 05:00 candle on Aug 20 followed with another +7.2% (a range 7.6x normal). A one-directional stretch built from one or two back-to-back displacement candles like this is called a displacement leg. For reference, as of Oct 24, price had not come back down into the FVG this candle left even once. Strong displacement doesn't always give you a deep pullback — Part 3 returns to this when deciding where to enter.
Key Takeaways
- Displacement is a move in which large orders pile into one side and push price quickly and far in a single direction; the candle at its center is the displacement candle.
- Pushing price one way means absorbing the other side's orders, and that costs money. A displacement candle is the footprint of that money being spent.
- Four footprints: a full body, a range far above normal, an FVG, and a close beyond the prior high or low. A volume spike is supporting evidence.
- Not every large candle is displacement. Check whether the footprints are there with it.
In Part 2, we'll cover four conditions for identifying a displacement candle with numbers, and how to filter out candles that look like displacement but aren't.
Doing this identification by hand for every market and every candle takes real time. A report that lays out ICT structure for each market is available at the link below.
This lesson adapts the text, figures and live-stream quotes of the Trader Steve TA series for the web, translated from the original Korean. Check the text and figure captions for the timing and interpretation of each real example, and read conceptual diagrams and real charts separately.
Corrections: support@omnisight.report