
What Are the ICT 2022 Model and the Unicorn Model? How They Work
Historical examples for learning · not current prices or trade recommendations.
Contents
Once you've learned fair value gaps (FVGs), liquidity sweeps and the market structure shift (MSS) one at a time, one question is left: "So when do I actually get in?" ICT's entry models answer it by tying those tools together in a fixed order. This lesson uses charts to walk through the four steps of the most widely used one, the 2022 model, and the unicorn model, which keeps the same framework but narrows the entry zone.
1. What an Entry Model Is: A Sequence, Not a Tool
Concepts like FVGs and order blocks tell you "where price may react." But a chart always has several of those places, and the concepts alone don't tell you which one to use or when.
An entry model adds a sequence. It is a blueprint that decides in advance what has to happen first, what you confirm next, and finally where you get in and where you admit you were wrong. If the sequence isn't there, you don't take the trade, however good the spot looks. Making the "reasons not to enter" explicit is the most useful thing an entry model does.
2. The 2022 Model: One-Line Definition and Four Steps
The ICT 2022 model (ICT 2022 Mentorship Model) gets its name from the entry sequence ICT laid out in his free 2022 mentorship. In one line: "Sweep the stops on one side, flip the other way, then get in when price comes back to the gap that move left behind."
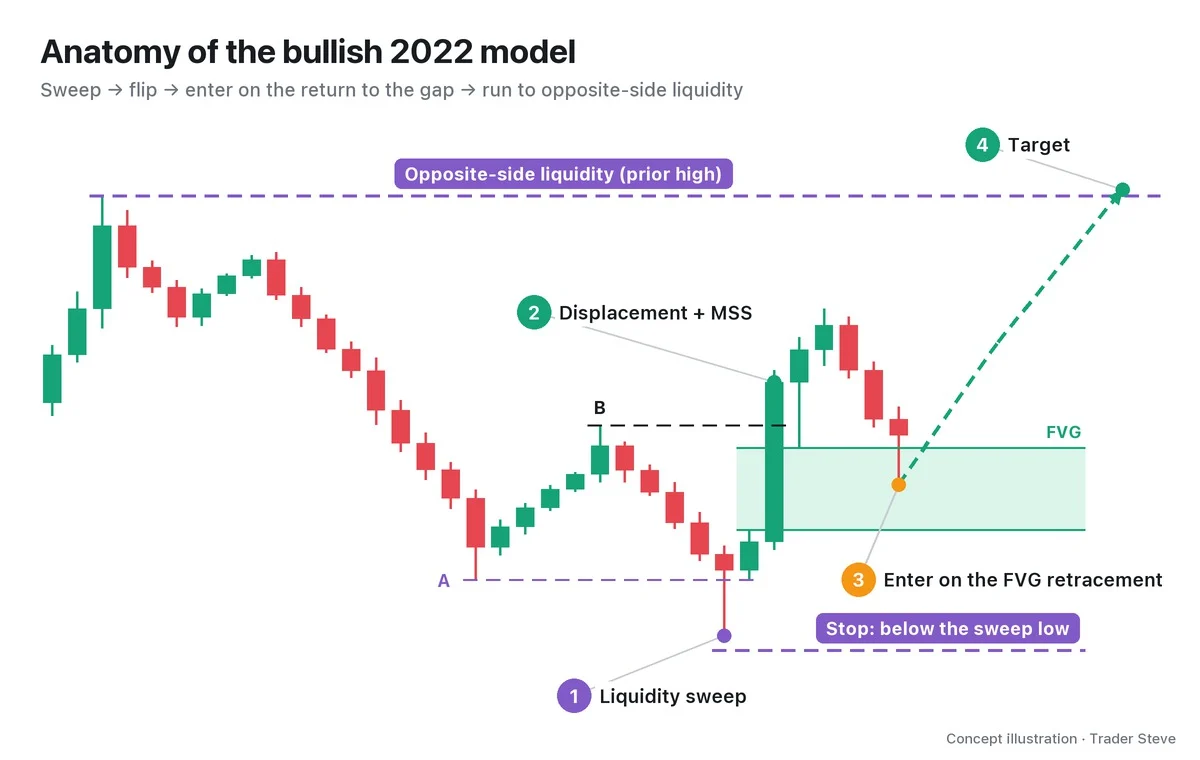
- Liquidity sweep: below the prior low (A) sit the stop-loss orders of long positions — sell-side liquidity (SSL). The first step is price wicking below A and coming back up.
- Displacement and market structure shift (MSS): right after the sweep, a strong large-range candle takes out the high in between (B) on a closing basis. A wick above B alone doesn't count.
- Entry on the FVG retracement: strong displacement usually leaves an FVG. Instead of chasing the breakout, you get in when price comes back into that FVG. The stop goes below the sweep extreme (S).
- Opposite-side liquidity: the target is the liquidity resting on the other side — the buy-side liquidity (BSL) above the prior high. ICT calls this the draw on liquidity (DOL).
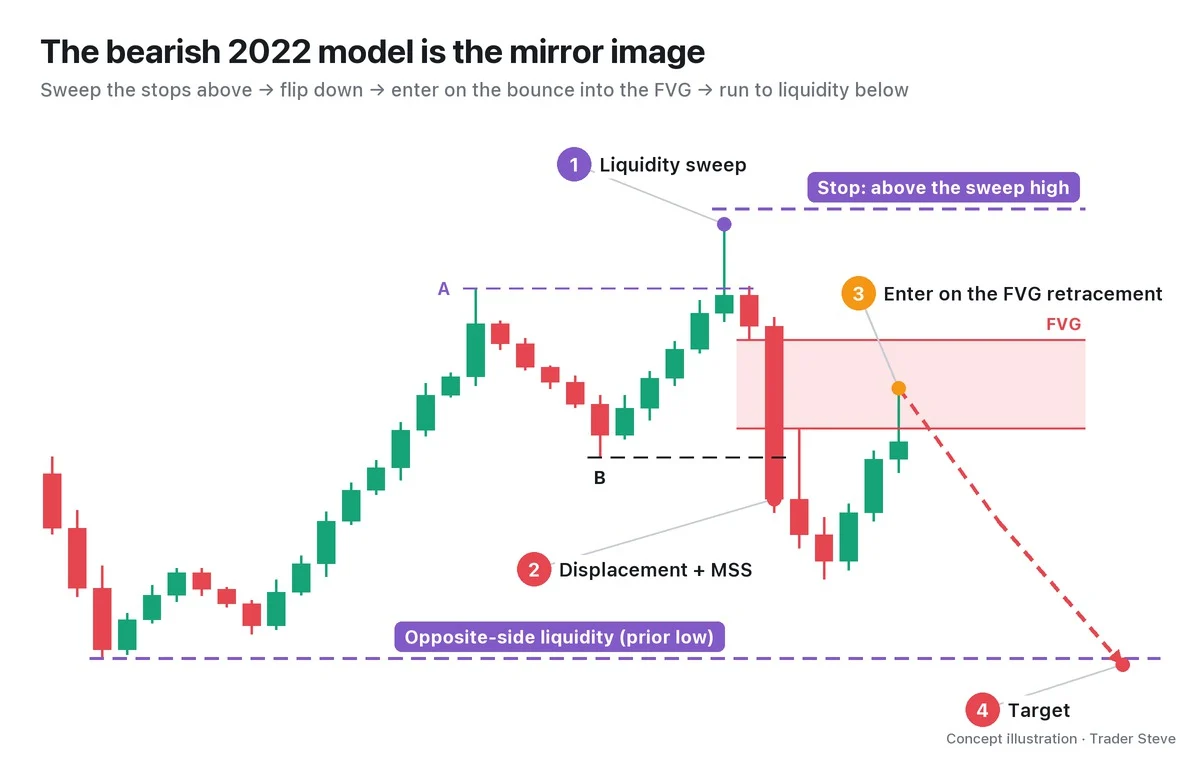
A bearish setup is the same picture flipped upside down.
3. Why This Order
Each step is there for a reason.
Why the sweep comes first. Anyone buying large size needs someone to sell to them. When the stop orders below a low are triggered, those stops become market sell orders, and the buyer gets to fill that size at a cheaper price. On the live stream, I explained the same idea like this:
"There's some liquidity stacked up down here. If I were one of the big players … which makes me more money — just pushing it up like this, or pushing it down once and then up? … If I push it down like this, I pick up more size at a cheaper price, and then I drag it up here and sell here." — Trader Steve, live stream, Sep 21, 2026 (translated from Korean) · ▶ Watch the stream highlights (Korean audio)
Why you wait for the MSS. A sweep on its own looks exactly like the case where price "sweeps and just keeps falling." Only a strong displacement that closes above B gives you evidence that direction has changed.
Why you enter on the retracement. The FVG left by the displacement is a zone where, after a sharp one-way move, the high–low ranges of the first and third candles don't overlap; if price revisits it, you watch for a reaction. If you chase from the top of the breakout candle, you have to sit through that entire retracement.
"It pushes off here — and because this is where the structural shift starts, you don't go long right here. It'll step back down once, coming back to fill the gap one way or another. Then that's where I'm saying you take the long." — Trader Steve, live stream, Aug 28, 2026 (translated from Korean) · ▶ Watch the stream highlights (Korean audio)
I didn't use the name "2022 model" there, but the sequence is the same: sweep → shift structure → get in when price returns to the gap. Each ingredient has its own lessons (liquidity sweeps, break of structure (BOS) and change of character (CHoCH), FVGs) if you want more detail.
4. The Unicorn Model: Same Framework, Narrower Zone
The unicorn model uses the 2022 model's framework unchanged but narrows the entry to the price range where a breaker block and an FVG in the same direction overlap.
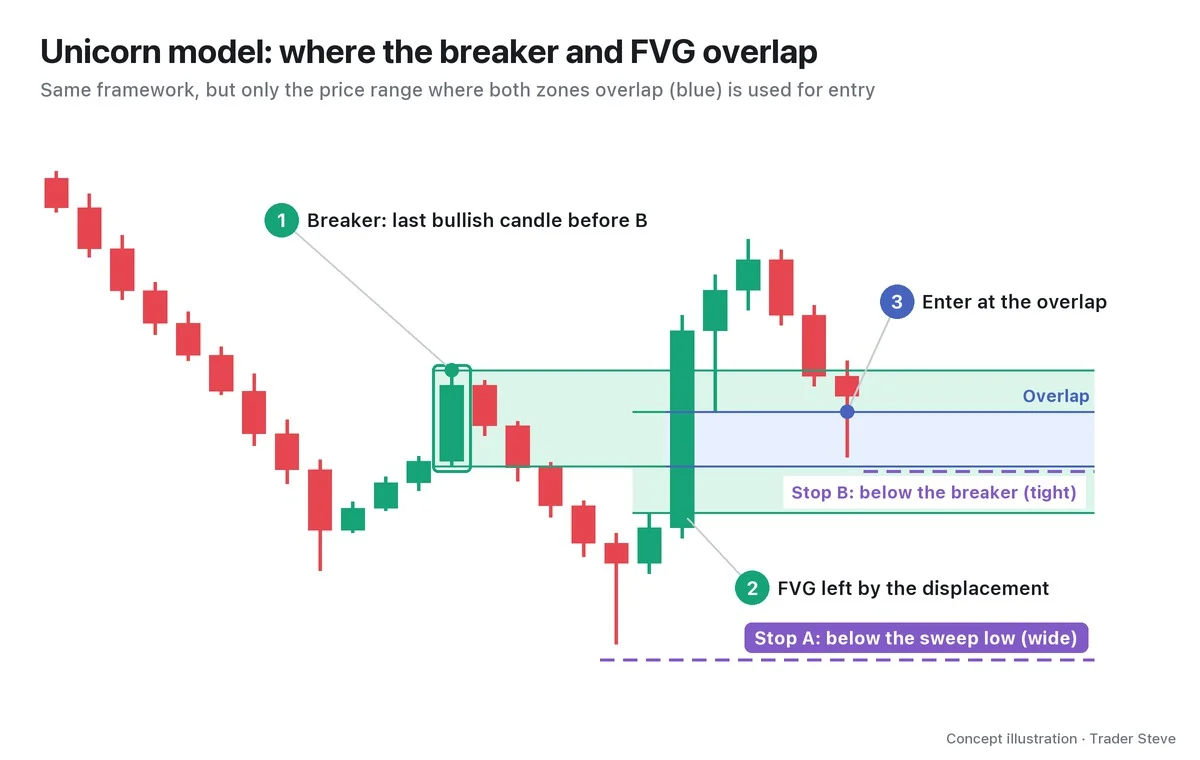
In a bullish setup, the breaker is the last bullish candle before B on the rise from A to B. Once the sweep and the MSS take out both its low and its high, its range becomes a zone that has switched roles. When that zone and the FVG point to the same price range, you have two layers of evidence, and the entry zone shrinks to their intersection.
- Overlap = [the higher of the breaker low and the FVG bottom, the lower of the breaker high and the FVG top]
- It is a unicorn only when this width is greater than zero. If they don't overlap, it isn't a unicorn — it's just a 2022 model.
Because the zone is narrow, a stop right below the breaker gives you a larger risk-to-reward ratio, but you also get shaken out more easily. Part 2 covers how to pick the breaker and calculate the overlap, and Part 3 covers where to put the stop.
5. On a Real BTC 4-Hour Chart
Here is a stretch of the Bitcoin (BTC) 4-hour chart from July–August 2026 where this exact sequence played out. Every location and price was found and calculated in code. Times are Korea Standard Time (KST, UTC+9).
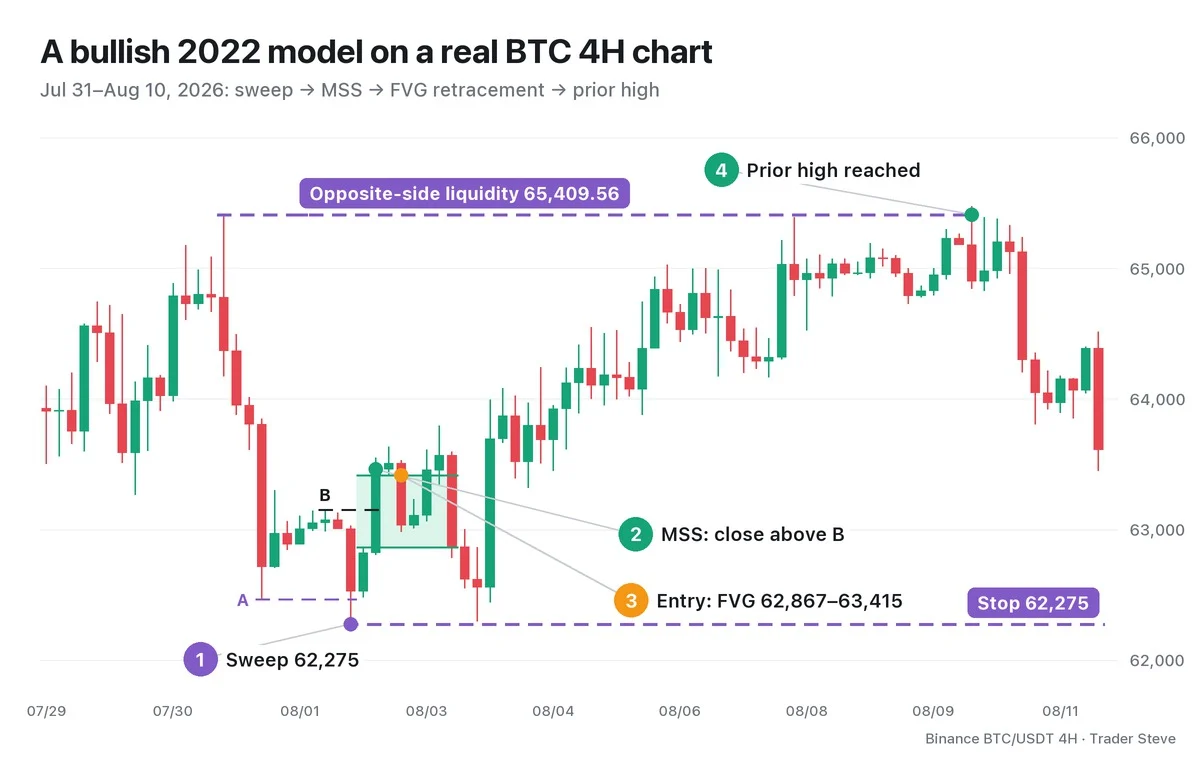
- Sweep: low A on the 21:00 candle of Jul 31 was 62,466, and high B on the 17:00 candle of Aug 1 was 63,150. The 01:00 candle on Aug 2 dropped to 62,275, sweeping 191 below A.
- MSS: the 09:00 candle the same day opened at 62,823.65 and closed at 63,461.95, clearing B on a closing basis.
- FVG retracement: the FVG left by this large bullish candle was 62,866.62–63,415.26 (consequent encroachment, or CE — the 50% midpoint — at 63,140.94). The 17:00 candle came back down to 62,982.38 and filled into the FVG. Entering at the top of the FVG with the stop at the sweep extreme of 62,275 puts the risk at 1,140.26.
- Opposite-side liquidity: the target was 65,409.56, the high of the 09:00 candle on Jul 31 where the decline began. Price cleared that high on the 05:00 candle of Aug 10, for about 1.75 times the risk (1.75R, where 1R is the distance from entry to stop).
It wasn't a comfortable ride. The low of the 17:00 candle on Aug 3 was 62,300, just above the stop. After the target, price pulled back to 62,535.24 on Aug 14 and then rallied to 79,500 on Aug 21, and the 62,275 stop was never broken in all that time (14.1R from the same entry). Still, remember that the target the model set was the opposite-side liquidity at 65,409.56.
For reference, the breaker in this setup was the bullish 17:00 candle on Aug 1 that made high B (62,986.31–63,150), and it overlapped the FVG, so the unicorn condition was met as well. The entry candle's low of 62,982.38 passed through that entire overlap.
Key Takeaways
- An entry model is a trading blueprint that ties tools like the sweep, MSS and FVG together in a fixed order.
- The 2022 model has four steps: ① liquidity sweep → ② displacement and MSS (a close beyond B) → ③ entry on the FVG retracement → ④ opposite-side liquidity.
- Why that order: sweep the stops first, confirm evidence of a change in direction, and enter on the retracement instead of chasing.
- The unicorn model uses the same framework but enters only in the zone where the breaker and the FVG overlap. No overlap, no unicorn.
- The model makes you set the stop and target before you enter; it does not guarantee the outcome.
In Part 2, we'll cover a five-step checklist for finding the 2022 model and the unicorn on a real chart, and how to draw the breaker and the overlap.
Checking this sequence by hand on every market takes real time. The Omnisight Report lays out liquidity, structure shifts and FVG locations for each market.
This lesson adapts the text, figures and live-stream quotes of the Trader Steve TA series for the web, translated from the original Korean. Check the text and figure captions for the timing and interpretation of each real example, and read conceptual diagrams and real charts separately.
Corrections: support@omnisight.report


