What Is a Fair Value Gap (FVG)? How It Forms and Why Price Returns
Historical examples for learning · not current prices or trade recommendations.
Contents
Every so often a single large candle leaps across a price range and leaves an empty stretch behind it. In ICT, that stretch is called a fair value gap (FVG), and it is one of the first things traders look for when planning entries, stops and targets. This lesson uses charts to show what an FVG is, why it forms, and why price often comes back to it.
1. The One-Line Definition: Three Candles Whose Outer Ranges Don't Overlap
An FVG is the price range left open when you take three candles as a group and the wicks of candle 1 and candle 3 do not overlap.
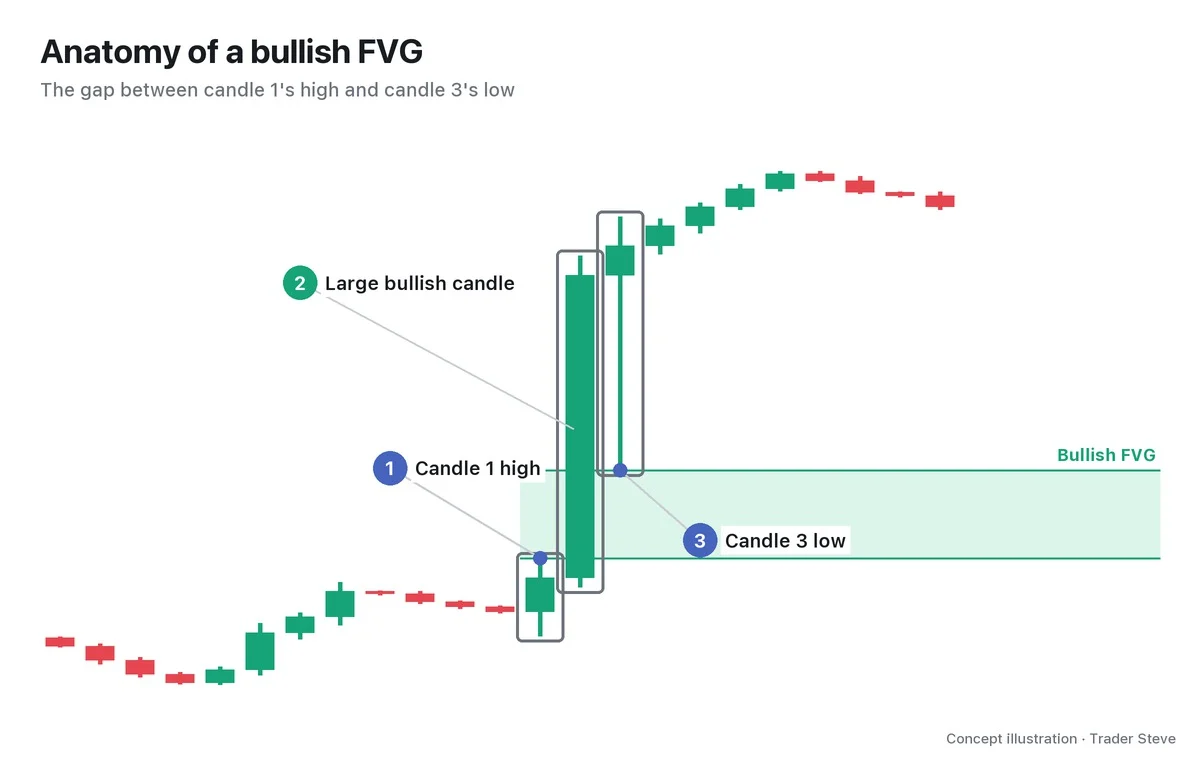
- Candle 1: the candle just before the move starts
- Candle 2: the large candle that drives price sharply higher
- Candle 3: the candle that follows
If candle 3's low is above candle 1's high, the two candles' ranges do not overlap. That non-overlapping range is the FVG. Note that OHLC data alone cannot tell you that little volume actually traded inside it.
2. Bullish and Bearish FVGs
FVGs come in two directions.
| Type | Other name | Range | When it forms |
|---|---|---|---|
| Bullish FVG | BISI (buy-side imbalance, sell-side inefficiency) | candle 1 high to candle 3 low | strong buying makes price jump higher |
| Bearish FVG | SIBI (sell-side imbalance, buy-side inefficiency) | candle 3 high to candle 1 low | strong selling makes price drop lower |
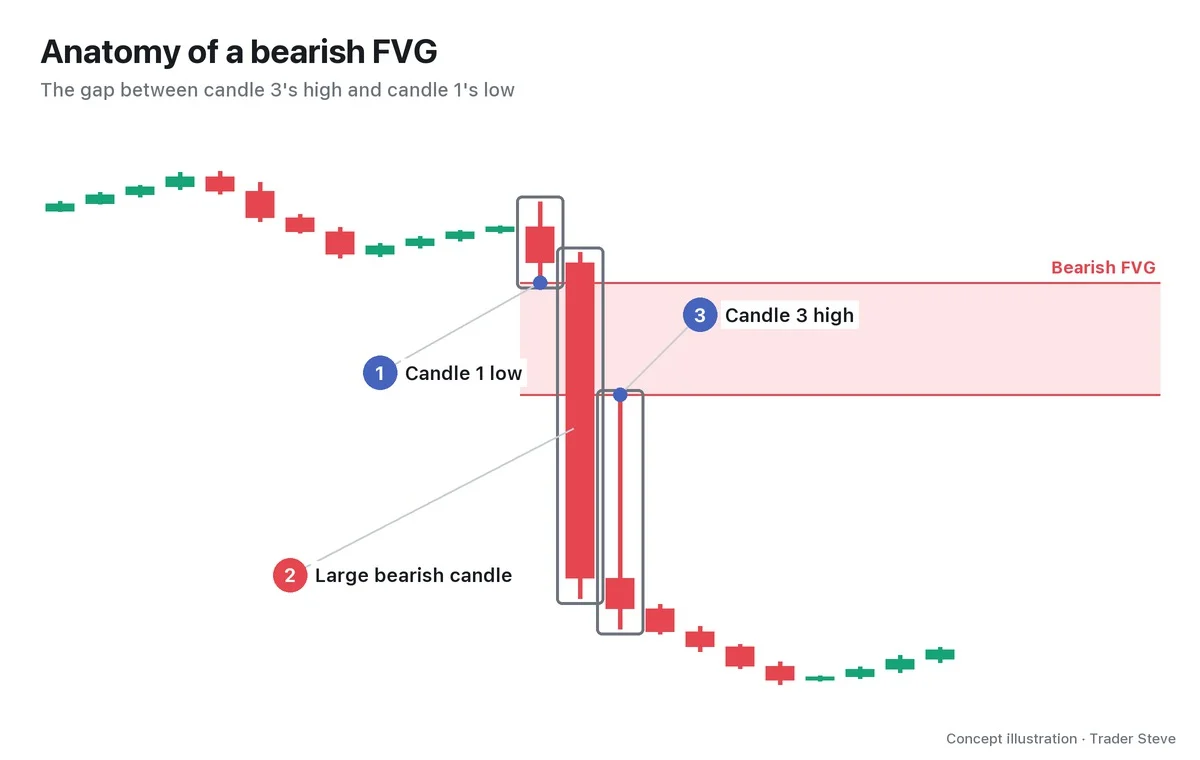
If BISI and SIBI feel like a mouthful, it is enough to remember "the gap left when price jumped up" and "the gap left when price dropped down."
3. Why It Forms: Aggressive Orders Meet Thin Liquidity
Price moves where buyers and sellers meet. When a wave of buy orders hits at once and there isn't enough sell-side size to absorb it, price can't climb step by step — it skips upward.
"Think of these blue boxes as zones where buyers wanted to fill a lot of size, but nobody was selling to them, so price jumped as it went up." — Trader Steve, live stream, Aug 24, 2026 (translated from Korean) · ▶ Watch this moment (Short, Korean audio)
Every trade has a buyer and a seller. An FVG is a zone where aggressive orders or an imbalance in resting liquidity moved price so fast that the ranges of the first and third candles never overlapped. A low-volume node (LVN) is a different measurement — a price level where little volume traded — so whether an FVG and an LVN line up has to be checked separately on a volume profile. On the live stream, I also call this "a hole punched in the liquidity."
4. Why Price Comes Back
FVGs matter because the market often returns later to fill that empty zone. This is called a rebalance.
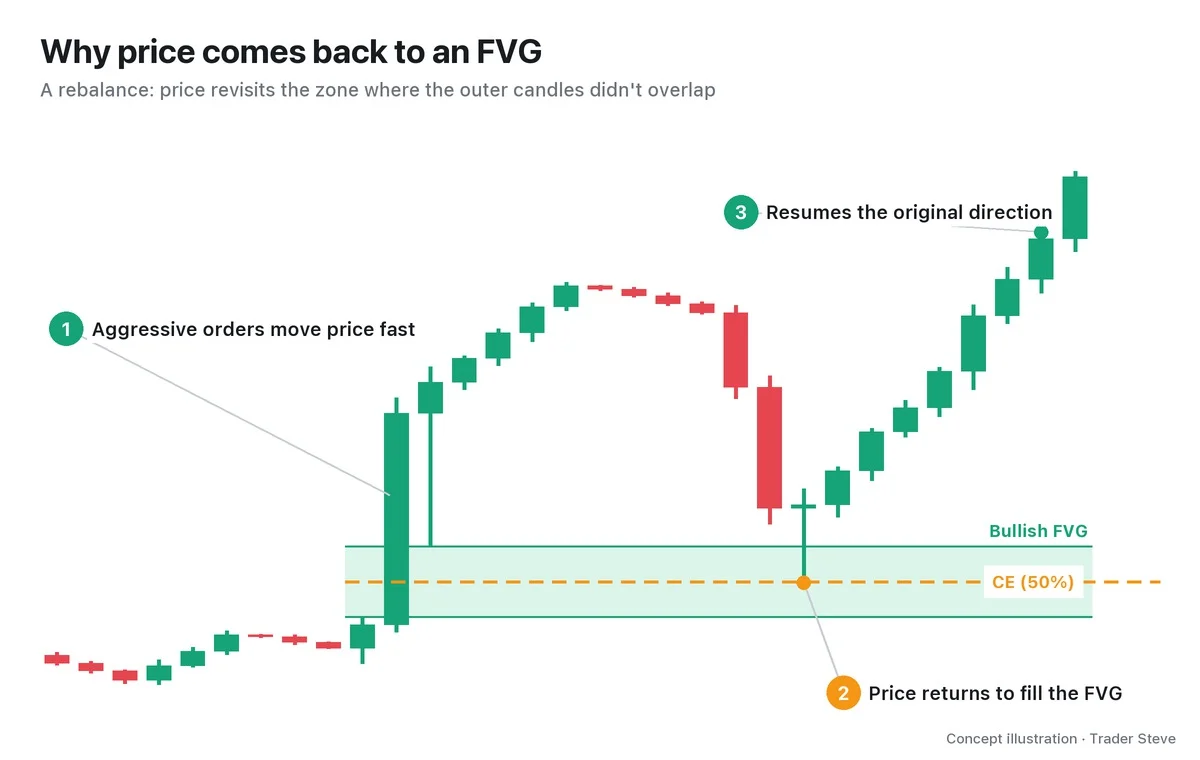
There are two hypotheses for why price returns. Neither the orders nor anyone's average entry price can be confirmed from OHLC data alone.
- Unfilled orders: price may have moved too quickly for some orders to be filled in that range. The hypothesis is that buying interest may emerge if price returns.
- The average entry of whoever pushed price up: if the side that drove the move built its position near there, it has a reason to defend that zone when a pullback reaches it.
The consequent encroachment (CE) marked on the chart is the exact midpoint (50%) of the FVG. Pullbacks often react near this midline without filling the whole gap, so it gets its own line. Part 2 covers CE in detail.
One point is worth stressing. An FVG is a place price may revisit, not a place price is guaranteed to bounce from. It is common for price to fill the gap and keep going straight through it. That's why you don't trade an FVG on its own — you check whether other evidence lines up with it (Part 5).
5. When They Appear Most: Forceful Moves
FVGs rarely form in quiet, sideways markets. They appear in clusters when price is being pushed hard in one direction.
"The biggest tell when manipulation shows up — a phase where price is pushed up hard — is that fair value gaps start appearing everywhere." — Trader Steve, live stream, Oct 12, 2026 (translated from Korean) · ▶ Watch the stream highlights (Korean audio)
Let's check it on a real Bitcoin chart.
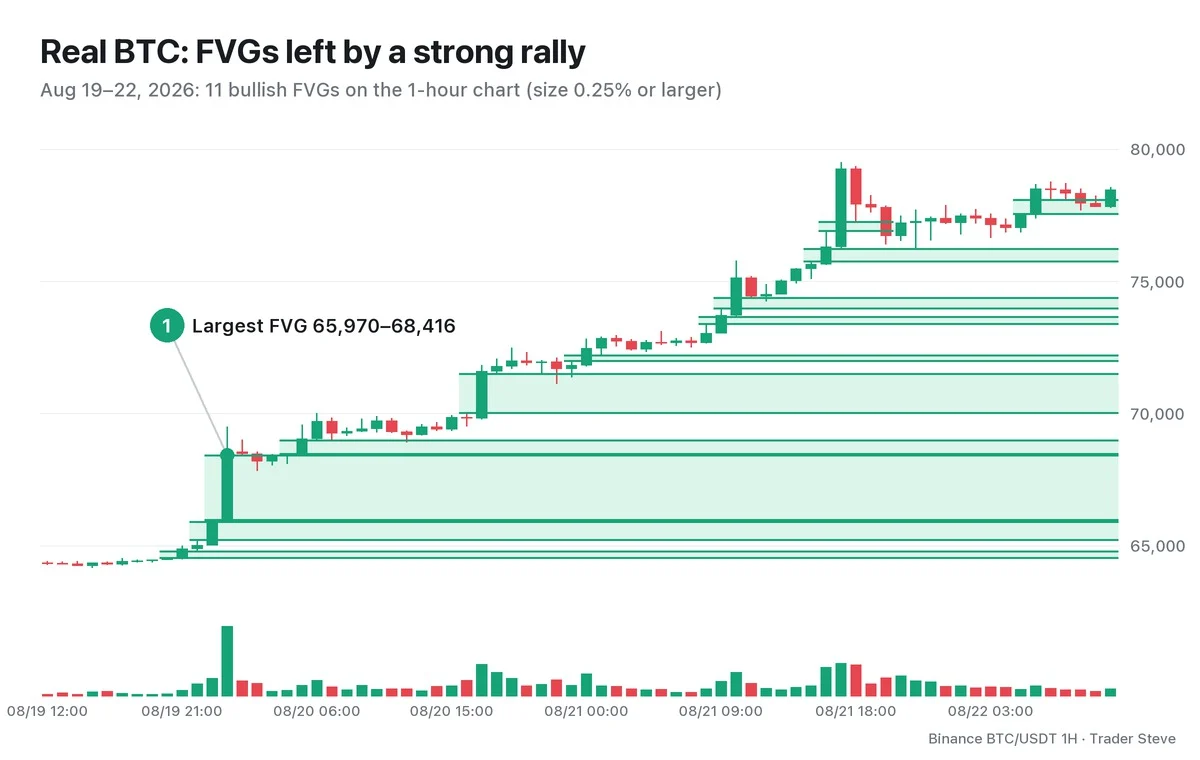
From the night of Aug 19, Bitcoin rallied hard for three days, and the 1-hour chart alone printed 11 bullish FVGs. The largest is the 65,970–68,416 range created by the large bullish candle that opened at 00:00 KST on Aug 20. Each green box stacked like a staircase is a price range where the first and third candles' ranges did not overlap.
How densely the FVGs formed is itself evidence of how one-sided the move was.
Key Takeaways
- An FVG is the empty price range where the wicks of candle 1 and candle 3 do not overlap in a three-candle sequence.
- A bullish FVG (BISI) runs from candle 1's high to candle 3's low; a bearish FVG (SIBI) runs from candle 3's high to candle 1's low.
- It is the non-overlapping zone left after a sharp move; if price revisits it, watch how price reacts.
- The harder price is pushed, the more FVGs form.
- It is a place price may revisit, not a confirmed signal. Always check whether other evidence lines up.
In Part 2, we'll cover how to find and draw FVGs precisely on a chart, along with CE and the criteria for picking FVGs that matter.
This lesson adapts the text, figures and live-stream quotes of the Trader Steve TA series for the web, translated from the original Korean. Check the text and figure captions for the timing and interpretation of each real example, and read conceptual diagrams and real charts separately.
Corrections: support@omnisight.report